TRACKING THE SPATIAL EVOLUTION OF URBAN HEAT ISLANDS
Rui Zhua,∗, Eric Guilbertb, Man Sing Wongc
aDept. of Land Surveying and Geo-informatics, The Hong Kong Polytechnic University, Hong Kong, China - [email protected] b
Dept. of Geomatics Sciences, Laval University, Qu´ebec, G1V 0A6 (QC) Canada - [email protected] c
Dept. of Land Surveying and Geo-informatics, The Hong Kong Polytechnic University, Hong Kong, China - [email protected]
Commission II, WG II/1
KEY WORDS:Spatiotemporal data modeling; Urban heat islands; Remote sensing
ABSTRACT:
The urban heat island (UHI) phenomenon occurring in the urban areas or city-clusters is increasingly becoming a severe problem in the urbanization process. Previous research mainly rely on grid analysis techniques to study temperature data from images recorded at fixed time instants. The evolutionary process of UHI in both time and space has not been investigated yet. This research designs an object-oriented spatiotemporal model to reconstruct the evolution of UHI and provide a qualitative interpretation. Each UHI is modeled as a spatiotemporal field object with it own life cycle. Dynamic behavior of an UHI is defined by sequences of spatial changes (e.g. contraction or expansion) and topological transformations (e.g. merge or split). The model is implemented in an object-relational database and applied to air temperature data collected from weather stations every hour over three days. UHIs with their behavior were extracted from the data. Results suggest that the model can effectively track and provide a qualitative description of the UHI evolution.
1. INTRODUCTION
Urban heat island is a phenomenon where temperature in urban areas is obviously higher than in surrounding rural areas. With the increasing rate of urbanization process, many rural areas have gradually become urbanized areas, small and middle-sized cities expand to metropolises, and mega cities grow to spatial contigu-ous city clusters, which cause the UHIs occurring in the cities or city clusters to have a measurable influence on the weather and even regional climate evolution. Hence, much work has been done to study the causative factors and adverse effects of UHI from thermal intensity images derived from satellite images and from meteorological station records.
Work in this direction consisted mainly in correlating thermal in-tensity from static surface temperature images with environmen-tal (Lo et al. 1997, Dousset and Gourmelon 2003, Stathopou-lou and Cartalis 2006) or social indicators (Buyantuyev and Wu 2010). Recently, consideration has also been given to studying the dynamic evolution of UHI where UHI are defined as clus-ters of pixels, moving towards object-based analysis. For exam-ple, (Keramitsoglou et al. 2011) proposed an object-based im-age analysis to reveal thermal pattern that thermal intensities of hotspots are strongly correlated to their extent.
In another direction, GIS tools can be used to study and visual-ize UHI causative factors such as ventilation (Wong and Nichol 2013). However conventional GIS data models and analytical tools provide no qualitative information about the processes oc-curring within UHIs and trends that can take place over long pe-riods of time (McIntosh and Yuan 2005). More in-depth study of UHI could be performed by automatically extracting the dynam-ics of a UHI during its whole lifetime through the analysis of a set of images. Such an approach requires the inclusion of the tem-poral dimension and thus the extension of the 2D spatial model to a spatiotemporal model. A fully object-oriented model where each UHI is addressed as an object with its own attributes would also help in adding a qualitative description to the information extracted from the data.
∗Corresponding author
Besides works from the remote sensing community, the GIS com-munity has looked at data models to represent dynamic geograph-ical phenomena. The objective of these models is to be able to describe the spatiotemporal behavior of objects observed in se-quences of images. Geographical phenomena can be defined as field objects corresponding to geo-objects with an internal struc-ture defined by variations of field-like properties within the object boundary (Goodchild et al. 2007). Their dynamic is driven by their activities, events and processes and can be observed through changes and movements (Yuan and Hornsby 2008). Such an ap-proach fits especially well with environmental phenomena such as UHI which can be seen as objects whose characteristics change through time. Processes and events are spatiotemporal objects de-fined with time attributes (e.g. starting and ending time), thematic attributes and dynamic attributes describing movement (McIn-tosh and Yuan 2005) and are linked to entities involved in the events. The data model can combine both raster and vector repre-sentations as thematic data are computed from grid points inside the entities (Bothwell and Yuan 2010).
Topological transitions between two consecutive time steps are defined by topological relationships between objects. (Renolen 2000) introduced a framework where each spatiotemporal object experiences its generic behavior as eitheraliveordead, and seven types of transition between two status: creation, alteration, de-struction, reincarnation, annexation, deduction, and reallocation. Several studies applied this framework in specific applications (Bothwell and Yuan 2011, Guilbert and Lin 2007, Nixon and Hornsby 2010) where objects can merge or split leading to the creation and destruction of new objects.
through simple queries.
The rest of this paper is organized as follows. Section 2 presents related work on spatiotemporal modeling of field data. Section 3 presents the new conceptual model centred on UHI as spa-tiotemporal objects. Section 4 empirically evaluates the proposed method on a case study. Finally, Section 5 concludes and points to future research.
2. OBJECT MODELING OF URBAN HEAT ISLANDS
In our work, UHI are identified from thermal images as regions in urban areas where the temperature is higher than that in rural ar-eas. At this stage, other factors influencing temperature variation are not considered and thermal exchanges at different elevations are omitted. UHI are seen as field objects whose thematic at-tribute is the temperature intensity defined by the difference with a threshold temperature observed in rural areas at the same time.
With the heat intensity varying through time, UHI appear when the temperature difference is above a threshold and disappear when it falls below this threshold. Hence each UHI has a finite lifetime. While active, the UHI shape can change as it can ex-pand and contract with temperature variation. It can also undergo transformations as neighbouring UHI can overlap or move apart.
In an object-oriented approach, an UHI hence can be modeled as a field-object with spatial (its shape) and thematic (temperature intensity) time-dependent attributes and UHIs can be associated by spatiotemporal relationships. Changes in the UHI shape and structure can be recorded at each time instant to provide a quali-tative description of the UHI evolution.
2.1 UHI changes
Only movements related to the UHI extent are modeled. From our preliminary observations, we consider that UHI are localized phenomena which do not move away from their point of origin and displacement is not seen significant, even influenced by so-lar radiation or during the year due to the seasonal changes. At each instant, the UHI movement is defined by one of these three values:
• expandingwhen the area grows bigger.
• stablewhen the area remains constant.
• contractingwhen the UHI is getting smaller.
2.2 UHI transformations
Apart from these spatial changes, UHIs go through several trans-formations during their life cycle. Most obvious transtrans-formations are the appearance and disappearance of a UHI when the intensity variation leads to a UHI to appear or to vanish. Other transfor-mations occur when UHIs either split or merge. These operations can be seen in different ways in the UHI life cycle. A merge can be modeled as the disappearance of two UHIs and the appearance of a new one or as the absorption of one by another. Similarly, a split can be seen as the appearance of two new UHIs or as one UHI splitting off another. These transformations are defined as:
• inherited mergewhen one UHI is absorbed by an existing one;
Behavior Groups Dynamic Behaviors for the UHI A (A, B, and C are three UHIs)
event-based dynamic behaviors
area change
topological transition
A
appear A disappear
A
A
C
inherited split
A
B
C
generated split
A A
B inherited merge
C A
B generated merge A
A expand A A
stabilize
A A
contract
Figure 1: Definition of the dynamic behaviors of an UHI
Figure 2: UHI behavior classification
• generated mergewhen the merge of two UHI leads to a new UHI;
• inherited splitwhen a part of an UHI detaches and forms a new UHI;
• generated splitwhen a split leads to the creation of two new UHI.
All these transformations and changes defined above are illus-trated in Figure 1. Changes correspond to continuous transfor-mations which do not modify the UHI structure. As such, they are observed on time intervals. Topological transitions modify the structure as they lead to the creation or removal of UHI. They correspond to discrete operations recorded at a given time instant. Conceptually, all these changes are summarized in a hierarchical set of concepts in Figure 2. The main two categories are move-ments related to changes in the UHI shape and transformations related to structural changes.
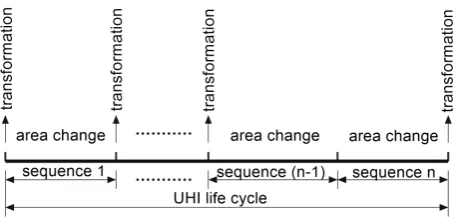
The lifetime of an UHI can then be decomposed in sequences and processes (Figure 3). A sequence is a time interval associated to one type of spatial change. For example a period of time dur-ing which an UHI expands corresponds to one sequence. A pro-cess occurs at a time instant and relates one or several sequences from one or several UHI with a topological transition. Hence, the lifetime of an UHI can be described by a series of consecutive sequences and by a series of processes.
Figure 4: Class diagram of the UHI model.
2.3 UHI behavior model
UHI are extracted as sets of polygons such that temperatures within the polygons are higher than a reference rural temperature, which varies constantly through time. Hence, UHI are not mod-eled in a continuous time-space representation but by a composi-tion of discrete objects from which the behavior is reconstructed. Adapting the framework proposed by (McIntosh and Yuan 2005) to the UHI behavior, we adopt the following definitions:
• an UHIzoneis an area on a temperature image of contiguous cells whose values are above the threshold temperature;
• asequenceis a group of zones undergoing the same change in consecutive snapshots. Consecutive sequences can be re-lated together by looking at the relationships between the last zone of a sequence and the first zone of the following sequence;
• aprocessis a group of sequences related by a topological transition. These sequences can belong to different UHI in the case of a split or a merge.
The life cycle of an UHI is then composed by a series of consecu-tive sequences and processes. Figure 4 presents the class diagram where zones, sequences and processes are objects that compose UHI. As sequences and processes are related, the life cycle of a UHI can be reconstructed from its processes. The temperature class is a discretization of the temperature defined by a 2D grid at each time instant. A zone is bounded by a polygon, having a finite extension, and defined at a given time instant. A sequence is then an aggregation of consecutive zones. Sequences are also linked to their previous and following sequences. This allows for the full qualitative description of the UHI behavior as a series of sequences where the UHI expands and contracts.
Processes model the topological transitions of Figure 4. One pro-cess is associated to one or several sequences, the role of a se-quence depending on the type of process. For example, an inher-ited split is associated to the sequences of the main UHI preceding and following the split and to the sequences of the UHI splitting away from the main UHI. Contrary to (McIntosh and Yuan 2005), processes do not include only split and merge but all topological transitions, allowing the description of a UHI life cycle as a series of processes.
3. APPLICATION TO UHI TRACKING
3.1 Study area
The model was implemented and tested on a dataset acquired from the Southeast Coastal Ocean Observing Regional Associa-tion (SECOORA). The dataset provides air temperature data mea-sured at approximately 1.5 meters above the ground from 171
!!!
00.250.5 1 1.5 2Decimal Degrees Study Area of New York City-Clusters
Figure 5: Urbanized areas in the northeast region of the USA.
weather stations along the coastline of New York representing a large urban area (Figure 5). Data were collected hourly from June 7, 2014 at 9.00 am to June 10, 2014 at 9.00 am. To have represen-tative rural temperature for extractingzonesof UHIs, three rural temperatures were collected and averaged each hour as the refer-enced rural temperature. Then,zonesof UHIs were extracted au-tomatically such that temperatures within which are higher than the referenced rural temperature. 102 sample points are located in the urbanized area, which ensures that a sufficient number of UHIs covering multiple urban areas can be generated. Tempera-tures over the whole area of study were interpolated by Universal Kriging, providing a temperature image at each time instant.
3.2 Extraction of UHI changes
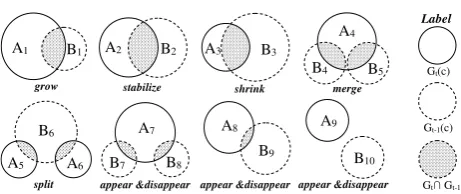
appear &disappear appear &disappear appear &disappear
grow merge
Figure 6: Intersection cases of the UHIGt(c)in two consecutive
time instants
Behaviors shown in Figure 2 are identified for each time instant. Movements are computed based on the displacement and area variation as shown in Figure 6. If there is no intersection between two consecutive UHI polygons, it is reasonable to consider they have no relationship. If two polygons overlap on a sufficiently big area, they are considered to be two representations of the same UHI at two consecutive time instants. Hence changes at timeti
are more specifically defined as follows:
• appear: the zone at timetidoes not intersect with any zone
at timeti−1;
• disappear: the zone at timeti−1does not intersect with any
zone at timeti;
• expand: the UHI polygon intersects with a UHI at timeti−1
and its area is bigger;
• contract: the UHI polygon intersects with a UHI at time
• stable: the UHI intersects with a UHI at timeti−1and their
areas are equivalent;
• merge: one UHI shape attioverlaps with several UHI at
ti−1. If one UHI atti−1is much bigger than the others and
of an area close to the UHI atti, the UHI is supposed to be in the continuity of the big UHI and we have aninherited merge. If the new UHI cannot be associated to one specific UHI, it is considered a new UHI qnd we have agenerated merge.
• split: several UHI polygon attioverlap with one polygon at
ti−1. If the shape attiis similar to one specific polygon at ti−1, it is aninherited splitotherwise it is agenerated split.
If twozonesatti−1 overlap the samezoneatti, three different
situations may occur: (1) they merge together into one if both of them overlap significantly with thezoneatti, (2) one disappears
and the other one keeps existing when only one pair of zones respectively attt−1 andtihas a significant overlap, or (3) none
of them have significant overlapping meaning that they are not related with each other such that the two atti−1 disappear and
the one attiappear.
3.3 Computation
The model was implemented and results from the tracking system were stored into an object-relational database managed with Post-greSQL 9.3.4. The database allows for the retrieval of processes and of the life cycle of each UHI through SQL queries.
Several threshold parameters were defined to recognize different types of movement and transformation. First, in order to be re-lated together, zones identified at two consecutive time instants need to overlap significantly. This is done by checking if the in-tersection of two zones is similar in size to the smaller of the two zones. A relative thresholdεrelatedis defined for this (equation 1).
1− area(U HIti∩U HIti−1) min(area(U HIti), area(U HIti−1))
≤εrelated (1)
The type of event the UHI undergoes depends then on the number of associations a zone has with other zones. If a zone is associated with one single zone, no transformation occurs and the UHI is changing. If no association can be made, the UHI is appearing or disappearing. Finally, if several associations are made, a split or a merge is taking place.
Two UHI zones are considered of same size if their relative area difference is smaller than a thresholdεarea(equation 2). Hence an UHI is considered to expand if its area has increased ofεarea
between two consecutive time instants. Similarly, if the UHI area decreases byεarea, the UHI is contracting.
area(U HIti)−area(U HIti
−1)
area(U HIti
−1)
≤εarea (2)
A merge occurs when a zone attiis associated with several zones atti−1. An inherited merge occurs if one of the new zones is
sig-nificantly bigger than the others and is similar to the older zone. Hence, a UHI will undergo an inherited merge if one of its asso-ciated zones atti−1has a similar shape as defined by equation 2
otherwise, all new zones correspond to new UHI and we have a generated merge.
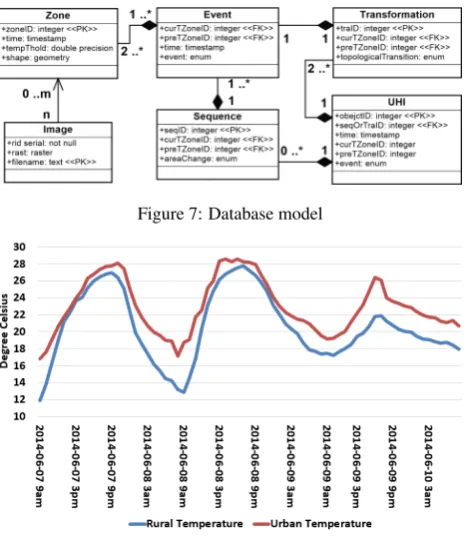
Figure 7: Database model
Figure 8: Database model
Similarly, a split occurs when a zone atti−1 is associated with
several zones atti. An inherited split occurs if one of the older zones is significantly bigger than the others and is similar to the new zone. The difference between inherited and generated split is also checked with equation 2.
3.4 Logical model
The logical model of the database (Figure 7) is derived from Fig-ure 4 diagram. TheZonetable is the main table used to derivate other tables. The boundaryof the zone is defined by a poly-gon, which is extracted form theImagetable storing the set of thermal images. The temperature thresholdtempTholdused to define the zone is also stored as an attribute as the images store the absolute air temperatures. In order to build up sequences and transitions, a new tableEventwas added storing the event com-puted for each zone. Hence this table stores not only the topo-logical transformations but also the spatial changes of Figure 2. AnEventinstance is composed of two attributes which are the current and preceding zones. When the system has reconstructed all the events at each time, theSequencetable is defined relating zones belonging to the same sequence. The table of transforma-tionTransformationis defined by relating topological trans-formations and sequences. Finally, the tableUHIis built from the series of processes and sequences.
4. RESULTS
4.1 Evolutionary trajectories of urban heat islands
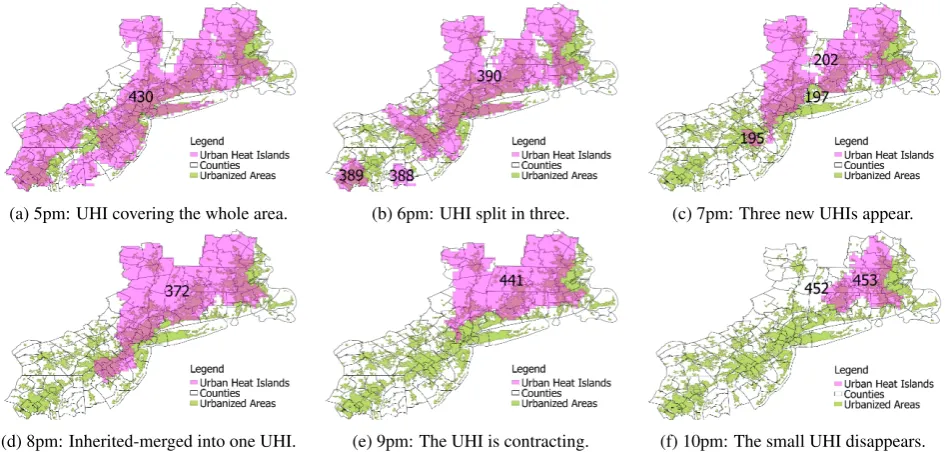
(a) 5pm: UHI covering the whole area. (b) 6pm: UHI split in three. (c) 7pm: Three new UHIs appear.
(d) 8pm: Inherited-merged into one UHI. (e) 9pm: The UHI is contracting. (f) 10pm: The small UHI disappears.
Figure 11: Evolution of an urban heat island at six consecutive time instants
Figure 9: Database model
andεarea=0.1. Directly extracting data from the tables, Figure 9
represents a complete life cycle of an UHI. The figure shows that this UHI appears from 2 am and continuously experienced three sequences and five processes, and finally disappeared due to the generated mergeat 4 pm. This indicates that the system can ef-fectively track the life cycle of each UHI.
Based on the achievement stated above, Figure 10 shows the spatiotemporal evolution of UHI based on an excerpt from the database. Firstly, an UHI identified ascurTZoneIdin the DBMS (i.e. 388and389) areinherited split(as different objects) and
390isinherited split(as the same object) from430, respectively. Then, three UHIs of194,195, and197areinherited merge(as different objects) with202(as the same object) as UHI372. Sub-sequently, this UHIcontractsas411, which isgenerated splitas
452and453simultaneously. Finally, these two UHIs disappear at 10 pm.
Figure 11 accordingly shows the spatial distribution of the above UHIs at six consecutive time instants, which mainly cover the New York city-clusters. The figure clearly indicates dynamic be-haviors of UHIs during in a completelife-cyclefrom 5 pm to 10 pm. More specifically, UHIs are continuously shrinking but do not disappear, possibly because the solar radiation flux decrease while anthropologic heat flux increases. Then, UHIs along the coastline of New York city disappear at 7 pm, probably bene-fiting from the cold sea-wind. Finally, the UHI over the Boston city-cluster disappears at 11 pm. Overall, this example shows that
Figure 10: Evolutionary trajectories of urban heat islands drawn from part of theUHISequencetable
the system can realistically track the evolution of the UHIs and qualify the different behaviors they go through.
5. DISCUSSION AND CONCLUSION
As an original contribution, this study conceptualizes UHI as a two-dimensional plus time field-object, proposes a model to de-scribe the dynamic behaviors of UHIs, and develops a system to evaluate the performance of the model. The model provides a qualitative description of the evolution of a UHI through a series of sequences and processes.
The interpolated surface of near-ground air temperature is reli-able and sufficient for constructing UHIs covering cities or city-clusters in a large area. In this work, rural temperature was set manually by choosing the temperature at several specific loca-tions. However, when studying large areas, the rural temperature used as a reference may vary for the different city clusters. One perspective is to determine automatically the relevant rural tem-perature for each city cluster. To solve this problem, a strategy to automatically set temperature thresholds associated with time and space may be proposed.
looking also at the evolution of the temperature within an UHI to provide also a thematic description. An objective is then to integrate in the model over environmental elements such as the land use or the buildings to study possible relationships and the influence they can have on the development of UHI. For that pur-pose, the UHI behavior may be represented at multiple levels as it can be influenced by factors at more local or global levels over different time scales.
ACKNOWLEDGMENTS
This research has been funded by 2013/14 General Research Fund of The Hong Kong Polytechnic University in the project of De-velopment of a spatiotemporal data model for the analysis of the dynamic behaviour of urban heat islands(Project No. 515513), and Dr. Man Sing Wong also acknowledges the supports from the grant of Early Career Scheme, the Research Grants Council of Hong Kong (Project No. 25201614), and the grant G-YM85 from the Hong Kong Polytechnic University.
REFERENCES
Bothwell, J., Yuan, M., 2010. Apply concepts of fluid kinematics to represent continuous spacetime fields in temporal GIS.Annals of GIS, 16(1), 27–41.
Bothwell, J., Yuan, M., 2011. A Kinematics-based GIS Method-ology to Represent and Analyze Spatiotemporal Patterns of Pre-cipitation Change in IPCC A2 Scenario.ACM SIGSPATIAL GIS ’11, 152–161.
Buyantuyev, A., Wu, J., 2010. Urban heat islands and landscape heterogeneity: linking spatiotemporal variations in surface tem-peratures to land-cover and socioeconomic patterns.Landscape Ecol25(1):17-33.
Dousset, B., Gourmelon, F., 2003. Satellite multi-sensor data analysis of urban surface temperatures and landcover. ISPRS Journal of Photogrammetry & Remote Sensing, 58, 43–54.
Goodchild M.F., Yuan M. and Cova T.J. 2007. Towards a general theory of geographic representation in GIS.Int. J. Geogr. Infor-mation Science21(3):239-260.
Guilbert, E., Lin, H., 2007. A New Model for Cloud Tracking and Analysis on Satellite Images.Geoinformatica, 11(3), 287–309.
Keramitsoglou, I., Kiranoudis, C. T., Ceriola, G., Weng, Q., Ra-jasekar, U., 2011. Identification and analysis of urban surface temperature patterns in Greater Athens, Greece, using MODIS imagery.Remote Sensing of Environment, 115(12), 3080–3090.
Lo, C. P., Quattrochi, D. A., Luvall, J. C., 1997. Application of high-resolution thermal infrared remote sensing and GIS to assess the urban heat island effect.Int. J. Remote Sensing, 18(2): 287– 304.
McIntosh, J., Yuan, M., 2005. Assessing Similarity of Geo-graphic Processes and Events.Transactions in GIS, 9(2), 223-245.
Nixon, V., Hornsby, K. S., 2010. Using geolifespans to model dy-namic geographic domains.International Journal of Geographi-cal Information Science, 24(9), 1289–1308.
Renolen, A., 2000. Modelling the Real World: Conceptual Mod-elling in Spatiotemporal Information System Design. Transac-tions in GIS, 4(1), 23–42.
Stathopoulou, M., Cartalis, C., 2006. Daytime urban heat islands from Landsat ETM+ and Corine land cover data: An application to major cities in Greece.Solar Energy81: 358-368.
Wong M. S., Nichol J. E., 2013. Spatial variability of frontal area index and its relationship with urban heat island intensity. Inter-national Journal of Remote Sensing, 34(3), 885–896.