AUTOMATED PHOTOGRAMMETRIC IMAGE MATCHING WITH SIFT ALGORITHM
AND DELAUNAY TRIANGULATION
Georgios Karagiannis, Francesc Antón Castro, Darka Mioc
National Space Institute, Technical University of Denmark, 2800 Kongens Lyngby, Denmark [email protected], [email protected], [email protected]
Commission II WG II/2
KEY WORDS:Automated image matching, SIFT algorithm, Delaunay triangulation, graph isomorphism, multi-sensor image match-ing, multi-temporal image matching.
ABSTRACT:
An algorithm for image matching of multi-sensor and multi-temporal satellite images is developed. The method is based on the SIFT feature detector proposed by Lowe in (Lowe, 1999). First, SIFT feature points are detected independently in two images (reference and sensed image). The features detected are invariant to image rotations, translations, scaling and also to changes in illumination, brightness and 3-dimensional viewpoint. Afterwards, each feature of the reference image is matched with one in the sensed image if, and only if, the distance between them multiplied by a threshold is shorter than the distances between the point and all the other points in the sensed image. Then, the matched features are used to compute the parameters of the homography that transforms the coordinate system of the sensed image to the coordinate system of the reference image. The Delaunay triangulations of each feature set for each image are computed. The isomorphism of the Delaunay triangulations is determined to guarantee the quality of the image matching. The algorithm is implemented in Matlab and tested on World-View 2, SPOT6 and TerraSAR-X image patches.
1 INTRODUCTION
Most of the older and recent researches (Lowe, 2004, Lowe, 1999, Feng et al., 2008, Yang and Kurita, 2013, Harris and Stephens, 1988, Moravec, 1981, Shi and Tomasi, 1994, Zhao and Ngo, 2013, Harris, 1993) on image matching and registration are based on the concept of detecting feature points in the reference image and then matching them to the corresponding feature points in the other image. This is highly challenging considering that the only information available for a point is its reflectivity in a certain por-tion of the EM spectrum. Certainly, by combining the spectral information of surrounding points, geometrical and topological information can be derived.
In order to solve this problem, local interest points with, as much as possible, unique geometrical, topological and spectral char-acteristics have to be detected. These points should be highly distinctive in the sense that they can be identified successfully against a large database of other points. This uniqueness of fea-ture points is necessary in image matching because in most of the cases in real life, images taken at different dates or/and from dif-ferent sensors are at the same time rotated, translated and differ-ent in scale and illumination. The problem of matching becomes even more complicated by accounting the local and global dis-tortion in both reference and sensed images. In addition, satellite images are even more demanding because they cover very large areas that can confuse the algorithm.
Furthermore, the ground-breaking work of Lowe in 1999 (Lowe, 1999) extended the local feature based previous approaches even more by proposing a scale invariant method, the prominent Scale Invariant Feature Transform (SIFT) method. Even though it is not actually a transform, it is called transform in the sense of trans-forming image data into scale-invariant coordinates(Lowe, 2004). This method is invariant not only in scale but also in rotations, translations and, partially, in illumination changes. A scale space is created by smoothing the images with a Gaussian filter and then sub-sampling them, creating a pyramid structure in which the levels are actually smoothed versions of the original images.
Then, the neighboring pyramid layers are subtracted producing the Difference of Gaussian (DoG) images. Afterwards, local ex-trema points are detected in the DoG images that represent the candidate feature points. Consequently, feature descriptors are created by assigning an orientation to each feature point using 36 bins covering the 360◦of a full circle. Finally, feature points of the reference image are matched with their corresponding feature points in the sensed image by a nearest neighbor criterion.
Finally, in 2008, Bay et al. (Bay et al., 2008) proposed a feature detection method that, in certain applications, approximates or even outperforms other feature detectors such as Harris or SIFT. The Speeded-Up Robust Features (SURF) method relies on the use of integral images that result in a notable reduction of the number of operations. Each entry in the integral image is defined as the summary of the corresponding point in the original image with the neighboring pixels of a specified square neighborhood. The SURF method is conceptually similar to the SIFT one, with the main difference relying on the scale space construction. Us-ing integral images instead of the original ones enables the scale space construction through box filters of any size at exactly the same speed directly to the original image and even simultane-ously. In this way, instead of iteratively sub-sampling the orig-inal image, the box filter is up-scaled. This difference reduces drastically the number of operations and thus, the required com-putational time.
assume the local smoothness of the data. By opposition to these research works, the present research work focuses on a determin-istic image matching quality measure: the percentage of edges in the subgraph isomorphism between Delaunay graphs (the dual graph of the Voronoi diagram or Dirichlet tessellation of the fea-ture points, which capfea-tures the geometric topology of the ob-jects). If the image matching is perfect from the point of view of geometric topology, the two Delaunay graphs are isomorphic and the image matching quality measure is 100 %.
To the best of our knowledge, there has not been any research work using Delaunay triangulation for the automated check of SIFT based image matching. This paper is organised as follows. Section 2 introduces the SIFT method for image matching. Sec-tion 3 shows the results of the automated quality control of the SIFT method based on Delaunay graph isomorphism. Finally, we conclude this paper in Section 4.
2 SIFT-BASED IMAGE MATCHING USING HOMOGRAPHS
The approach that was followed can be divided into three main steps, each one described in separate sections of this chapter. These steps are:
1. SIFT feature extraction:Detection of stable feature points from both the reference and the sensed images for an accu-rate match. This is performed by implementing the SIFT feature detection method as described by Lowe in (Lowe, 2004) and (Lowe, 1999). All the three steps are very im-portant but the quality of this one is the most crucial for the quality of the final accuracy. Any inaccuracy will be compounded until the end influencing all the following pro-cesses.
2. Feature matching:After the independent extraction of the SIFT feature points from both images, features that repre-sent the same point in both images are matched. Each fea-ture point of the reference image is matched with its corre-sponding feature point of the sensed image by computing the Euclidean distance between that feature point and all the feature points in the sensed image. Then, the nearest neighbor is considered a candidate for matching. In order to avoid including false positive matches (points that erro-neously have been matched) and discarding false negative matches (matches that mistakenly have not been included), the distance to the nearest neighbor and the distance to the second closest neighbor is also computed. This is based on the assumption that the distance to the nearest neighbor will be much shorter compared to the one to the second closest.
3. Homographic transformation:Finally, after the detection of pairs of matched points with known image coordinates in both images, the parameters of the image matching will be computed accurately. These parameters take into consider-ation any variconsider-ation in translconsider-ations and rotconsider-ations in addition to scaling and skewness between the two image coordinate systems and form a transformation. Specifically, they form a homographic transformation whose projection in two di-mensions corresponds to a similarity.
The implementation can be represented by four main stages (Lowe, 2004):
1. Scale-space construction and space extremum point de-tection: The algorithm searches all image scales and loca-tions by computing the Laplacians of Gaussians (LoG) for the image with variousσvalues. The differentσvalues act like a scale parameter and in this way, feature points that are -potentially in this stage- invariant to scale and rotations are detected. Difference of Gaussians (DoG) is the difference of two blurred versions of the original image. The two blurred versions occur by applying a Gaussian filter with differentσ in the original image(Lowe, 2004).
2. Key-point localization: For each candidate point from the previous stage, a fit to the nearby data for location, scale and ratio of principal curvatures is performed. Points that are sensitive to noise (have low contrast) or are not well local-ized on an edge are discarded. In this way, the 2-dimensional translation and scale invariance is reached.
3. Orientation assignment:In this stage, the remaining points after the previous stage are assigned with one or more con-sistent orientations based on the average direction of the gra-dient in the vicinity of the point. In this way, the invariance to image rotation is achieved.
4. Key-point descriptor: In the previous two stages, the ro-tation, scale and 2-dimensional translation invariance was ensured. The goal of this stage is to attain the invariance in illumination and 3-dimensional viewpoint of the features. For this purpose, a local image descriptor incorporates the magnitude of the regional gradient for each feature point at selected scale.
These points will be used to compute the parameters that can al-low the computation of the image coordinates of a point on the second image when its image coordinates on the first image are known. These parameters will include the rotations, the transla-tions and the scaling that has to be applied on the coordinate sys-tem of the second image in order totransformit to the coordinate system of the first image. These parameters are the parameters of thehomographic transformationand are the elements of the
homographicmatrixH(Equation 1).
H=
h11 h12 h13
h21 h22 h23
h31 h32 h33
(1)
It is noted that the homography assumes that the images follow the pinhole camera model (the aperture is almost zero and all lenses have negligible width). Now, letXi′ be the vector
coor-dinates of a point in the first image, Xi be the corresponding
coordinates of the point in the second image andHbe the homo-graphic matrix. Then, the relationship of the two points is shown in Equation 2 which is known as thehomography equation.
Xi′ =HXi (2)
Xi′=
Therefore, the image coordinate vector of the first image becomes:
Xi′=
whereZ′iis the distance between the optical center of the camera
and the object in the real world in meters andfis the focal length of the camera.
From Equations 1 and 4a, the homography (Equation 2) can be expanded(Kheng, 2012):
In addition, the homography is defined in unspecified scale since scaling H by scale s does not change the homography equa-tion(Kheng, 2012):
For many points, Equations 7a and 7b yields a system of equa-tions:
Equation 8 is a linear system of equations with eight unknowns (the elements of the homographic matrix). Therefore, four unique pairs of points with known image coordinates in both images are enough to solve it. If more observations are available the error of the computation can be minimized by using least squares in 3 dimensional affine coordinates rather than homogeneous coordi-nates. In practice, the transformation parameters computed using six correct points result in sub-pixel accuracy in this research.
3 QUALITY CHECK OF SIFT ALGORITHM WITH DELAUNAY TRIANGULATION
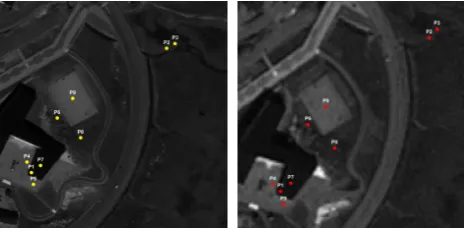
Figure 1 shows the matched points obtained as a result of the aforementioned processing. Figure 1a shows the points in the World View patch and Figure 1b shows those in the SPOT6 patch. It can be observed that there are no false positives among the points and that they are nine in total, a number that is sufficient for the computation of the parameters. The nine pairs of points (observations) are then used to compute the transformation pa-rameters via Equation 8 as described in Section 2. The computed parameters can transform image coordinates from the patch of the World View image to image coordinates of the patch of SPOT6 with a mean accuracy of 0.43 pixels in x-coordinate and 0.51 pix-els in y-coordinate. This accuracy is satisfactory since it is below one pixel.
(a) Matched feature points (yel-low dots) in patch number 7 in World View image
(b) Matched feature points (red dots) in patch number 7 in SPOT6 image
Figure 1: Matched feature points in patch number 7 in World View (1a, yellow dots) and SPOT6 image (1b, red dots). Note the fact that there are no false positive matches.
Figure 2 shows the result of the matching process in the same pair of patches like in Figure 1 but with a slightly looser thresh-old. The result is that seven more matches were detected, two of which were false positives. It is interesting to see how these two false positive observations will influence the accuracy on the computations of the transformation parameters. In this case, the image coordinates of the second image were computed with an accuracy of 3.27 pixels for the x-coordinate and 3.84 pixels for the y-coordinate. Certainly, these values cannot be considered poor but the increase of the error with just two false positives is significant.
(a) Matched feature points (yel-low dots) in patch number 7 in World View image with dis-tance threshold at2.5
(b) Matched feature points (red dots) in patch number 7 in SPOT6 image with distance threshold at2.5
Figure 2: Matched feature points in patch number 7 in World View (1a, yellow dots) and SPOT6 image (1b, red dots) with dis-tance threshold at2.5. This change in the threshold was enough to result in 7 more matched points (16 in total) with the cost of 12.5% commission error (2 out of 16 are false positives).
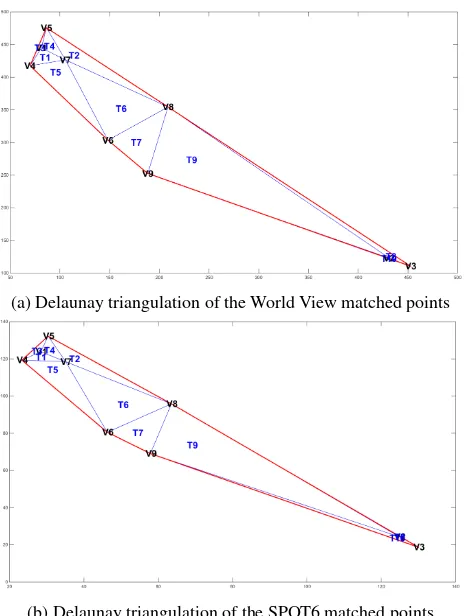
enough but narrow. The size and the shape of the convex hull of the Delaunay triangulation is an indication of the distribution of the points in an image. A small sized convex hull means that the points are all located in a small region of the image. In addition, a narrow convex hull occurs when there is good distribution in one direction but not in the other. Particularly, the two convex hulls show a good distribution in the y-direction but a poor one in the x-direction. Ideally, some points would exist in the vicinity of the left and right boundaries of the images. The good distribution of the points is desired in order to minimize the error from image distortion when computing the transformation parameters. How-ever, even though it didn’t influence the accuracy in this case.
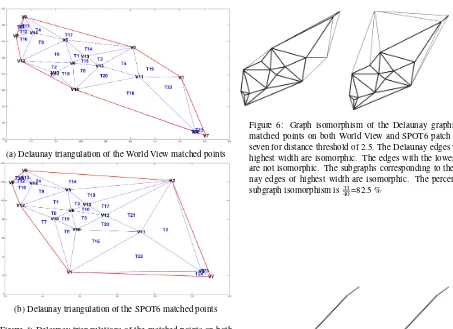
The influence of the false positives on the Delaunay triangulation can be observed in Figures 5, and 6. These figures are plots of the graph isomorphism of the triangulations shown in Figures 3 and 4. In Figure 5 the graphs that correspond to the two triangulations of the generators (feature points) shown in Figure 3 are shown. It can be observed that the two graphs are identical, indicating that each vertex is connected with the same vertices in both triangula-tions. In contrast, the applications with a looser distance thresh-old are different, as it can be seen in the corresponding graphs on Figure 6. Figures 7 and 8 show the minimum spanning trees of the graphs shown in Figures 5 and 6. A minimum spanning tree shows the minimum way of connecting the nodes of a graph. It can be observed that a single false positive can change signifi-cantly the connections among the detected features which implies a reduced accuracy.
4 CONCLUSIONS
In this paper, we have presented a novel quality control technique based on Delaunay triangulation isomorphism (or subgraph iso-morphism) to assess SIFT-based image matching. We have ap-plied this technique to multi-sensor, multi-temporal image match-ing. Further work will present a matching measure based on De-launay triangulation subgraph isomorphism.
REFERENCES
Bay, H., Ess, A., Tuytelaars, T. and Gool, L. V., 2008. Speeded-up robust features (surf). Computer Vision and Image Under-standing 110(3), pp. 346 – 359. Similarity Matching in Computer Vision and Multimedia.
(a) Delaunay triangulation of the World View matched points
(b) Delaunay triangulation of the SPOT6 matched points
(a) Delaunay triangulation of the World View matched points
(b) Delaunay triangulation of the SPOT6 matched points
Figure 4: Delaunay triangulations of the matched points on both World View and SPOT6 patch number seven for distance thresh-old of 2.5. The labels are shown in the same way like in Figure 3. Note how different look the two triangulations with only two false positives out of 16 points in total.
Figure 5: Graph isomorphism of the Delaunay graphs of the matched points on both World View and SPOT6 patch number seven for distance threshold of 3. The two graphs, if assumed without their geometric embeddings, are identical proving that the points are distributed in the same way in the two images.
Figure 6: Graph isomorphism of the Delaunay graphs of the matched points on both World View and SPOT6 patch number seven for distance threshold of 2.5. The Delaunay edges with the highest width are isomorphic. The edges with the lowest width are not isomorphic. The subgraphs corresponding to the Delau-nay edges of highest width are isomorphic. The percentage of subgraph isomorphism is 33
40=82.5 %
Figure 7: Minimum spanning tree of graph in Figure 5
Cao, Z. and Duan, X., 2011. Object Matching Task-oriented Im-age Quality Assessment. In: Cao, Z and Fenster, A and Nyul, LG and Cai, C (ed.), MIPPR 2011: MULTISPECTRAL IMAGE ACQUISITION, PROCESSING, AND ANALYSIS, Proceedings of SPIE, Vol. 8002, Huazhong Univ Sci & Technol; Natl Key Lab Sci & Technol Multi-Spectral Informat Proc; Guilin Univ Elect Technol; SPIE. 7th Symposium on Multispectral Image Processing and Pattern Recognition (MIPPR) - Multispectral Im-age Acquisition, Processing, and Analysis, Guilin, PEOPLES R CHINA, NOV 04-06, 2011.
Feng, H., Li, E., Chen, Y. and Zhang, Y., 2008. Parallelization and characterization of sift on multi-core systems. In: Workload Characterization, 2008. IISWC 2008. IEEE International Sympo-sium on, pp. 14–23.
Fogtmann, M. and Larsen, R., 2013. ADAPTIVE MESH GEN-ERATION FOR IMAGE REGISTRATION AND SEGMENTA-TION. In: 2013 20TH IEEE INTERNATIONAL CONFER-ENCE ON IMAGE PROCESSING (ICIP 2013), IEEE Interna-tional Conference on Image Processing ICIP, Inst Elect & Elect Engineers; IEEE Signal Proc Soc, pp. 757–760. 20th IEEE In-ternational Conference on Image Processing (ICIP), Melbourne, AUSTRALIA, SEP 15-18, 2013.
Harris, C., 1993. Active vision. In: A. Blake and A. Yuille (eds), Active vision, MIT Press, Cambridge, MA, USA, chapter Geom-etry from Visual Motion, pp. 263–284.
Harris, C. and Stephens, M., 1988. A combined corner and edge detector. In: In Proc. of Fourth Alvey Vision Conference, pp. 147–151.
Kheng, L. W., 2012. Camera models and imaging.http://www. comp.nus.edu.sg/~cs4243/.
Lowe, D., 1999. Object recognition from local scale-invariant features. In: Computer Vision, 1999. The Proceedings of the Sev-enth IEEE International Conference on, Vol. 2, pp. 1150–1157 vol.2.
Lowe, D. G., 2004. Distinctive image features from scale-invariant keypoints. Int. J. Comput. Vision 60(2), pp. 91–110.
Moravec, H. P., 1981. Rover visual obstacle avoidance. In: P. J. Hayes (ed.), IJCAI, William Kaufmann, pp. 785–790.
Shi, J. and Tomasi, C., 1994. Good features to track. In: 1994 IEEE Conference on Computer Vision and Pattern Recognition (CVPR’94), pp. 593 – 600.
Yang, Z. and Kurita, T., 2013. Improvements to the descriptor of sift by bof approaches. In: Pattern Recognition (ACPR), 2013 2nd IAPR Asian Conference on, pp. 95–99.