THE DESIGN OF WORKER’S BEHAVIOR ANALYSIS METHOD IN WORKPLACE
USING INDOOR POSITIONING TECHNOLOGY
K. Tabata a, *, H. Konno b, M. Nakajima c a
KOKUSAI KOGYO CO., LTD., 2 Rokubancho, Chiyoda-ku, Tokyo, Japan – [email protected] b
KOKUSAI KOGYO CO., LTD., 2 Rokubancho, Chiyoda-ku, Tokyo, Japan – [email protected] c
KOKUSAI KOGYO CO., LTD., 2 Rokubancho, Chiyoda-ku, Tokyo, Japan – [email protected]
ISPRS ThS9
KEY WORDS: Worker’s Behavior Analysis Method, Indoor Positioning, Smartphone Application, Bluetooth Low Energy, Workplace, Action History
ABSTRACT:
This study presents a method for analyzing workers’ behavior using indoor positioning technology and field test in the workplace. Recently, various indoor positioning methods, such as Wi-Fi, Bluetooth low energy (BLE), visible light communication, Japan’s indoor messaging system, ultra-wide band (UWB), and pedestrian dead reckoning (PDR), have been investigated. The development of these technologies allows tracking of movement of both people and/or goods in indoor spaces, people and/or goods behavior analysis is expected as one of the key technologies for operation optimization. However, when we use these technologies for human tracking, there are some problem as follows. 1) Many cases need to use dedicated facilities (e.g. UWB). 2) When we use smartphone as sensing device, battery depletion is one of the big problem (especially using PDR). 3) the accuracy is instability for tracking (e.g. Wi-Fi). Based on these matters, in this study we designed and developed an indoor positioning system using BLE positioning. And, we adopted smartphone for business use as sensing device, developed a smartphone application runs on android OS. Moreover, we conducted the field test of developed system at Itoki Corporation’s ITOKI Tokyo Innovation Center, SYNQA, office (Tokyo, Japan). Over 40 workers participated in this field test, and worker tracking log data were collected for 6 weeks. We analyzed the characteristics of the workers’ behavior using this log data as a prototyping.
1. INTRODUCTION
Recently, various indoor positioning methods, such as Wi-Fi, Bluetooth low energy (BLE), visible light communication, Japan’s indoor messaging system, ultra-wide band (UWB), and pedestrian dead reckoning (PDR) have been investigated. In particular, given the spread of smartphones, indoor positioning technology can now be used with smartphones instead of special-purpose indoor positioning devices. Therefore, the use of indoor positioning is expected to increase.
One application of indoor positioning technology is human behavior visualization. This application is expected as one of the key technologies for operation optimization. Previously, human behavior visualization in indoor spaces was conducted by image analysis using monitoring cameras or follow-up surveys by investigators. However, it was difficult to measure human behavior continuously and extensively using these methods. In addition, worker’s behavior visualization using ultra-wide band or special-purpose devices, and business operation optimization using this output have already been performed. In contrast, there have been few use cases in which worker’s behavior is monitored over a long period using smartphones. In this study, we acquired worker’s behavior for visualization at workplace using smartphone. All the workers in this study had smartphones for business use; therefore, we developed a smartphone application to acquire workers’ behavior as logged data during business time. Moreover, we created a visualization of average worker behavior as a prototyping.
We aim to establish a method of worker’s behavior acquisition and visualization. In this study, we verified what analysis can we conducted using accumulated log data.
* Corresponding author
2. RELATED WORK
Image analysis using monitoring cameras has often been used to measure human behavior in indoor spaces. This method measures the number of passing humans by analyzing the acquired image data, but it is difficult to track individual humans’ behavior continuously.
Another advanced workplace indoor positioning method utilizes lighting control by detecting the worker’s position (Sadakiyo, 2013). In this method, dedicated facilities are used instead of smartphones. However, they have the drawback of high initial cost, which is needed for installation of the positioning environment. Also, (Kaneko, 2014) attempted the estimation of moving behavior and face-to-face communication of office workers using laser-scanner. However, this method also uses dedicated facilities.
In contrast, because of the progress in indoor positioning technology, methods for measuring human behavior using indoor positioning technology have advanced. In particular, PDR positioning is able to track individual human behavior in indoor space. Although PDR positioning can use the gyroscope and accelerometers in a smartphone, one of the problems of this positioning method is the amount of power it consumes. When PDR positioning is used for a long time, we must use an extra battery or special-purpose PDR device (Fukuhara, 2013). In this study, we focused on the fact that workers each have smartphones for business use; therefore, we designed a worker behavior measurement method using a smartphone. Moreover, we designed a way to measure this behavior continuously for a long time. As examples of analyzing worker’s behavior in the workplace, (Moriwaki, 2007 and Sato, 2009) developed ISPRS Annals of the Photogrammetry, Remote Sensing and Spatial Information Sciences, Volume III-4, 2016
“Business Microscope”. But this device is also special purpose device, there are some tasks toward practical use.
3. THE DESIGN OF WORKER’S BEHAVIOR ANALYSIS METHOD
3.1 Architecture
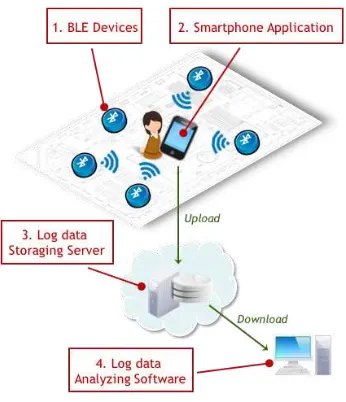
Figure 1 shows the system architecture of the method proposed in this study. This system consists of four elements, as follows.
Figure 1. System architecture
3.1.1 BLE device installation: In the proposed method, we use the radio waves from BLE devices. Hence, we installed many BLE devices in the target workplace. The BLE device used in the system is shown in Figure 2. This device runs on a lithium battery and can emit radio waves for more than a year. The installation locations are detailed in Section 4.
Figure 2. Installed BLE device
3.1.2 Smartphone application: Because each worker already has a smartphone for business use, we developed a smartphone application that runs on Android OS to determine workers’ indoor position. Details of the application are given in Section 3.2.
3.1.3 Log Data Storage Server: We developed a storage server in a cloud environment to upload and store log data from the smartphone application.
3.1.4 Log Data Analysis Software: We used two software applications to analyze worker’s behavior using the large amount of log data accumulated on the storage server:
• Tableau: used to analyze and graph worker behavior. • Mobmap (Geographic Information System (GIS)
software ): used to express the results of worker behavior analysis on a floor map.
3.2 Smartphone application design
As mentioned in 3.1.2, we developed a smartphone application. GUI screenshot of this application shows in Figure 3. We designed GUI was very simple because workers use smartphone at all times in business.
This application has three functions as follows.
3.2.1 Indoor positioning function: We developed the function for measuring indoor position using BLE radio wave. Specifically, when the RSSI value that the application detected is more than determined parameter for a few seconds, the position BLE device was installed, and the time are sent to a data base of application.
3.2.2 Measuring time setting function: As one of the countermeasures for personal information, we developed the function to set measuring time. In this study the time was determined from 9:00 to 17:45. This function enables not to measure the worker’s position other than a working hours.
3.2.3 Log data transmission function: This function send log data to storage server regularly.
Figure 3. Smartphone application screenshot
4. FIELD TEST AND PROTOTYPING
4.1 Overview of the field test
Details of the field test are listed in Table 1. The field test was conducted at Itoki Corporation’s ITOKI Tokyo Innovation Center, SYNQA, office (Tokyo, Japan). In this field test, we installed a smartphone application onto the workers’ business smartphones and accumulated log data from them.
Duration of log data
acquisition Aug. 20 to Oct. 9 , 2015
Test time 9:00 to 17:45
Number of participants
42 people who work in the SYNQA office
Installed devices BLE : approximately 70
Table 1. Overview of the field test
Hoshiden Corporation “HRM5011”
Diameter : 50mm Weight : 28g Battery : CR2477
Action States
Measured Current Location ISPRS Annals of the Photogrammetry, Remote Sensing and Spatial Information Sciences, Volume III-4, 2016
4.2 Workflow of the Field Test
The workflow of the field test was as follows.
4.2.1 Field investigation: The target workplace space was investigated and the BLE device installation locations were discussed.
4.2.2 Device installation planning: Based on the field investigation, the number and locations of the BLE devices were confirmed. Figure 4 shows a part of the installation plan. BLE devices were installed at various locations, including on desks, and in meeting rooms and break rooms.
Figure 4. BLE device installation plan
4.2.3 Device installation: The BLE devices were installed and the radio wave intensity was set.
4.2.4 Application adjustment: The received signal strength indicator value was adjusted for accurate detection at each installation location.
4.2.5 Application installation and log data acquisition: The smartphone application was installed on the participating workers’ smartphones. We acquired log data continuously using the application during the field test.
4.2.6 Worker’s behavior analysis: The accumulated log data were analyzed using the software.
4.3 The prototyping of worker’s behavior analysis
We analyzed and visualized the workers’ behavior using the accumulated log data. The log data consist of the following main values.
• Smartphone device ID • BLE radio wave detection time • Detected BLE device ID • Facility name
• Floor number
• Detected BLE device location (latitude, longitude)
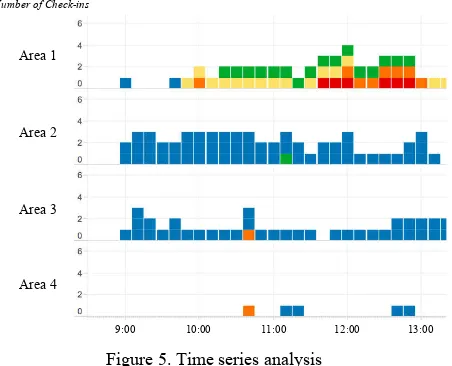
4.3.1 Time series analysis of area usage frequency: Figure 5 shows the time series data for the number of times each area was entered (in this paper, we call this the “check-in” value). Different sectors are indicated by different colors. This analysis clarifies the different uses of each area in each sector.
Figure 5. Time series analysis
4.3.2 Usage frequency of each area by the day of week: Figure 6 shows the number of check-ins by the day of week. As in Figure 5, the different colors indicate different sectors. This analysis could be used to evaluate the trends in use of each area over the long term. Moreover, this output could evaluate the difference in average use of each area by day of the week.
Figure 6. Usage frequency analysis by the day of week
4.3.3 Spider graph of worker movement: Figure 7 shows the worker movements on a floor map. All movement from each area to destination is indicated by a line. Although a spider graph is often utilized to evaluate commercial zones in marketing, we utilized the spider graph to visualize movement tendencies and range. The upper side of Figure 7 shows the movement of Sector A, and the lower side shows Sector B. This output shows that the movement in Sector B tends to occur on the right side of the floor.
9:00 10:00 11:00 12:00 13:00
Area 1
Area 2
Area 3
Area 4 Number of Check-ins
MON TUE WED THU FRI
Area A
Area B
Area C
Area D
Number of Check-ins
Figure 7. Spider graph of worker movement
4.3.4 Worker movement visualization as a movie: Figure 8 shows a screenshot of a video that displays worker movement. This visualization expresses the lines in Figure 7 as a moving object. This visualization expresses worker movement more graphically. Moreover, this visualization can express the worker’s movement direction.
Figure 8. Screenshot of worker’s movement video
5. DISCUSSION
5.1 System configuration
In this study, we utilized BLE devices and smartphone application as the method for measuring worker’s indoor position.
We recognize that this configuration has several advantages as follows.
• Extra device is not needed for workers because each smartphone for business use is used as measuring device. • BLE devices could be installed easily because this device
runs on a lithium battery and does not need the feeding. • The energy consumption is less than the case PDR
positioning uses. Therefore, this method can run for a long time.
Otherwise, there were some disadvantage comments from participated workers as follows.
• The battery consumption became faster than before. • Smartphone sometime heated because an application runs
on during working hours.
5.2 Worker’s behavior analysis
We conducted four pattern worker’s behavior analysis using software. When indoor positioning technology is used as a measuring method, a certain error is occurred by the accuracy and the stability of indoor positioning technology. The following are factors of a certain error by using BLE.
• When the worker is moving, a measured RSSI value can not be acquired stably.
• The radio wave intensity something sways.
• When something obstacles exist between BLE device and smartphone, smartphone application something receives the radio wave weakly.
Therefore, the trends in use or movement tendencies are not evaluated in short term, but long term by acquiring log data more than one week. When usage frequency by the day of week is evaluated, the duration of log data acquisition is needed for several weeks.
And also, we visualized the worker’s movement in section 4.3.3 and 4.3.4. Although the worker’s movement are expressed by line objects, but actual path is different. If the evaluation is conducted about movement path, BLE devices should be installed on the node of each path. Or, different indoor positioning technology (e.g. PDR) should be used.
6. CONCLUSION
This study aims to establish a method for analyzing worker’s behavior in the workplace using indoor positioning technology. In this paper, we presented a system for acquiring and analyzing worker movement log data, and we conducted a field test in a real office space using a proposed system. In this system, we installed
approximately 70 BLE devices over the test field and acquired worker movement log data using a smartphone application. And we analyzed and visualized worker’s behavior using these data. By using this positioning system we could acquired a sufficient quantity of log data for analysis using the smartphone application through a field test. And we could create some visual outputs for analysing worker’s behavior.
ACKNOWLEDGEMENTS
This field test was conducted in association with Itoki Corporation. We would like to thank the workers at the Itoki SYNQA Office that participated in this study.
REFERENCES
Sadakiyo, K., 2013. Development of Light Control System by Location Information. J. Archit. Plann., AIJ Vol.78 No.686, 949-ISPRS Annals of the Photogrammetry, Remote Sensing and Spatial Information Sciences, Volume III-4, 2016
Kaneko, H., 2014. Estimation of sitting-and-moving behavior and face-to-face communication of office workers using laser-scanner trajectory data. J. Environ. Eng., AIJ Vol.79 No.706, 1083-1092, Dec., 2014
Fukuhara, T., 2013. Measuring and evaluating real service operations with human-behavior sensing: a case study in a Japanese cuisine restaurant. 19th Korea-Japan Joint Workshop on. IEEE., 113-116, 2013
Moriwaki, N., 2007. Business Microscope System for Organizational Activity Visualization. IEICE Technical Report,
HCS2007-44, 31-36, 2007
Sato, N., 2009. Knowledge-creating behavior index for improving knowledge workers' productivity. Sixth International
Conference on Networked Sensing Systems (INSS), 1-4, 2009