3D MODELLING OF INTERIOR SPACES: LEARNING THE LANGUAGE OF INDOOR
ARCHITECTURE
K. Khoshelham a, and L. Díaz-Vilariño b
a Faculty of Geo-Information Science and Earth Observation, University of Twente, Netherlands -
b Applied Geotechnologies Research Group, University of Vigo, ETSE Minas, 36310 Vigo, Spain - [email protected]
Commission V
KEY WORDS: Indoor modelling, Point cloud, Shape grammar, Automation, Semantics, Building Information Model (BIM)
ABSTRACT:
3D models of indoor environments are important in many applications, but they usually exist only for newly constructed buildings. Automated approaches to modelling indoor environments from imagery and/or point clouds can make the process easier, faster and cheaper. We present an approach to 3D indoor modelling based on a shape grammar. We demonstrate that interior spaces can be modelled by iteratively placing, connecting and merging cuboid shapes. We also show that the parameters and sequence of grammar rules can be learned automatically from a point cloud. Experiments with simulated and real point clouds show promising results, and indicate the potential of the method in 3D modelling of large indoor environments.
Corresponding author
1. INTRODUCTION
Spatial data of indoor environments, where we spend a considerable amount of our time, are important for a variety of applications. For most buildings the available spatial data are either 2D floor plans or design building information models (BIM), which do not represent the current state of the building. However, many applications such as crisis management, routing and navigation, energy efficiency analysis, structural health monitoring and maintenance planning require up-to-date 3D indoor models with rich semantics.
Currently, 3D indoor modelling is mostly a manual procedure, which is time consuming and labour intensive. Several methods have been developed to automatically generate indoor models based on imagery and/or point cloud data. These methods can be divided into two main categories: surface-based and volumetric reconstruction methods. Surface-based methods recognize the structural elements of the indoor environment, i.e. walls, floors and ceilings, to generate a boundary representation (B-rep) model (Budroni and Boehm, 2010; Sanchez and Zakhor, 2012; Valero et al., 2012; Díaz-Vilariño et al., 2013; Xiong et al., 2013). While B-rep models are more suitable for visualization, they are less useful in applications that require knowledge of the interior spaces and their topological relations, e.g. routing and navigation. Volumetric approaches model the indoor environment as a combination of volumetric spaces (Jenke et al., 2009; Xiao and Furukawa, 2012; Oesau et al., 2014), which are more suitable for performing complex spatial analysis. However, methods for fitting volumetric primitives to the data are usually restricted to simple indoor architectures, and are susceptible to inaccuracy and incompleteness of the data.
The challenge in recognizing interior spaces is to understand the principles of indoor architectural design and translate them into a modelling algorithm. Indoor architecture is characterized with three elements: repetition, regularity and creativity. Regular structures like cuboid spaces repeatedly appear in indoor environments but in very many different configurations reflecting the creativity of the architect. A design principle that combines these elements and explains their working in architecture is the shape grammar (Stiny, 2008). It establishes that different designs can be made by iteratively combining simple shapes according to some rules, the same way a language is defined by words constructing sentences according to grammar rules.
In this paper we present a method for the modelling of indoor environments based on a simple shape grammar. Other types of grammar have been used for modelling interior spaces by Becker et al. (2013). In our approach, we derive our shape grammar from an architectural indoor design concept known as the Palladian grammar (Stiny and Mitchell, 1978). We also present methods for learning the grammar rules and their parameters from a point cloud.
The rest of the paper is organized as follows. Section 2 introduces the shape grammar for modelling indoor spaces. Section 3 describes the methods for learning the grammar rules from a point cloud. In Section 4 experiments with a number of simulated and real point clouds of indoor environments are described and the results are discussed. A short discussion on the representation of semantics in 3D indoor models reconstructed by shape grammar is presented in Section 5.
2. A SIMPLE SHAPE GRAMMAR FOR INDOOR MODELLING
We define a parametric shape grammar similar to the Palladian grammar which has been used to describe Palladian style indoor designs (Stiny and Mitchell, 1978). Figure 1 shows examples of Palladian architectural designs generated by a simplified shape grammar, consisting of a starting symbol (a grid of rectangular spaces - Figure 1a), and two production rules (first merging spaces by collapsing intermediate walls, and then inserting aligned windows and doors). This method can be easily extended to 3D. For 3D modelling of interior spaces, we use a unit cube as the starting symbol (as it represents a 3D subspace), and three production rules that generate non-terminal symbols (intermediate cuboid spaces) and terminal symbols (final interior spaces). The following are the rules:
- R1place_cuboid: S H·S
Applies a transformation H to the unit cube S and places the transformed cuboid. Currently, H consists of a translation vector with tx, ty, tz and three scale parameters sx, sy, sz. This would restrict the modelling to indoor environments with Manhattan-World structure. For non-Manhattan-World buildings H can be easily extended to include also a rotation around the z axis.
- R2connect_cuboids: {N1, N2} N3
Connects two neighbouring non-terminal cuboids, N1 and N2, which are not separated with a wall by making a new non-terminal cuboid N3 in between them.
- R3merge_cuboids: {N1, N2} N3 (T)
Merges two adjacent non-terminal cuboids, N1 and N2, by calculating the Boolean union of the two cuboids. The resulting solid can be a non-terminal (N3) or a terminal (T) depending on whether or not it can be merged further.
These rules produce a 3D model of the interior spaces in the form of volumetric solids. To add further details like doors and windows the rule set can be extended with additional rules.
3. LEARNING GRAMMAR RULES AND THEIR PARAMATERS
The grammar rules already facilitate interactive modelling of interior spaces. Placing a cuboid by the first rule can be easily done manually, or to generate a 3D grid of cuboids the user only needs to specify the location of the floors and the walls. To apply the other two rules the user only needs to select two cuboids.
Given a point cloud of the interior spaces, however, it is possible to learn the parameters and sequence of the rules automatically. In an indoor environment which does not deviate too much from the Manhattan-World assumptions, the distribution of the points in the point cloud provides information on the position of the main structural elements, and can be used to estimate the parameters of the grammar rules.
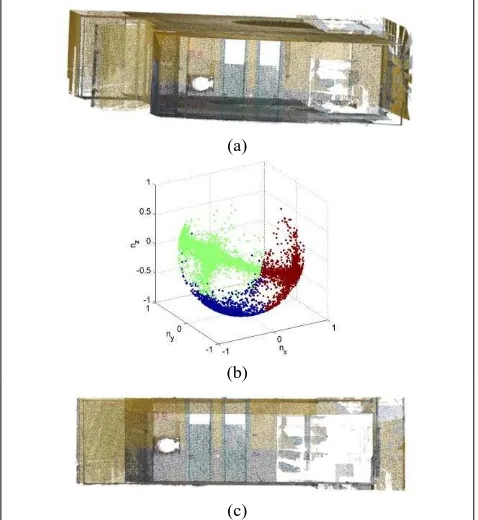
To enable reasoning based on the point distribution the point cloud should be first rotated such that the main walls are parallel to the x- and y axes and the floor and ceiling are parallel to the x-y plane. The rotation parameters can be estimated from the distribution of the normal vectors. As shown in Figure 2, the normals form three clusters corresponding to the orientation of the main walls and the floors/ceilings. We use a simple k-means clustering method to find the three cluster centres, and use these to estimate the three rotation parameters that align the point cloud.
Figure 1. By applying grammar rules to a grid of rectangular spaces (a) various Palladian indoor designs can be generated (b to h).
Once the point cloud is aligned, the distribution of the z-coordinate of the points provides information on the number of storeys of the building. The peaks in the histogram of z-coordinates correspond to the floors and ceilings in the point cloud. Each pair of adjacent peaks with a difference larger than 3 to 4 meters in z corresponds to a building storey. By automatic extraction of the histogram peaks the locations of the floors and ceilings are identified, and the point cloud can be divided into subclouds corresponding to the individual storeys of the building. Each storey is then modelled separately by applying the grammar rules.
The first rule contains transformation parameters that determine the location and size of a cuboid such that it corresponds to an actual subspace of the interior. In an aligned point cloud, the histograms of the point coordinates in x, y and z are characterized with peaks that correspond to the location and size of the subspaces. Each pair of adjacent histogram peaks that have a distance larger than the normal thickness of the walls determines the location and size of a subspace, whereas closer peaks correspond to walls and non-navigable spaces.
Figure 2. The normal vectors of an indoor point cloud (a) form three clusters corresponding to the direction of the walls and floors/ceilings (b). The cluster centres are used to estimate the rotation parameters that align the point cloud (c).
(a) (b) (c) (d)
(e) (f) (g) (h)
(a)
(b)
(c)
To place each cuboid based on the parameters automatically derived from the histograms a points-on-ceiling constraint must be satisfied. This means that the cuboid should have points on When the cuboid’s ceiling touches an actual surface in the point cloud the point-on-ceiling index will be close to one; otherwise, it will be close to zero.
When placing the cuboids, each cuboid is given a pair of grid coordinates according to the location of its corresponding peaks in the histograms of the point coordinates in x and y. From the grid coordinates neighbourhood relations between cuboids can be derived, which is used by the second rule.
The second rule connects neighbouring cuboids that are not separated by an interior wall. The location and size of the connecting cuboid is derived from the coordinates of the vertices of the two cuboids that are closest to each other. To determine whether the connecting cuboid is on empty space or on an interior wall we define a points-on-walls index:
wa ll space between them. In such a case the connecting cuboid will have one scale parameter of zero, which indicates that the rule will have no effect.
The third rule merges adjacent cuboids. This would simply require finding non-terminal cuboids that have a common face, and calculating their Boolean union. This rule is also applied iteratively until no more two adjacent cuboids are found. At the end of the iterations, all remaining cuboids are designated as terminal spaces.
4. EXPERIMENTS AND RESULTS
The grammar and the methods for learning it from a point cloud was implemented in Matlab® environment. While for spaces with a Manhattan-World structure we perform the entire reconstruction process in Matlab, for more complex interiors we export the grammar rules as a Python script to FreeCAD software (www.freecadweb.org), which is better suited for operations on solids, particularly the Boolean union operation.
Preliminary experiments were carried out using a simulated point cloud of a two-storey building and a real point cloud acquired by terrestrial laser scanning of a large interior space. For the generation of the rules a number of parameters should be predefined. Table 1 lists the settings used in the two experiments. The average point spacing and the buffer size are set respectively based on the density and noise level of the point cloud. The maximum wall thickness is based on prior knowledge of the building. The choice of histogram bin size does not have a significant effect on the performance of the method, and a value between 5 and 20 cm is usually suitable.
Table 1. Parameter settings used in the experiments.
Parameter
4.1 Results for the simulated point cloud
The simulated point cloud of an imaginary two-storey building was created with an average point spacing of 5 cm and a noise level of 5 cm. Figure 3 shows the simulated point cloud.
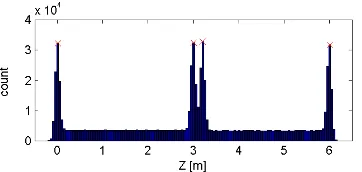
Figure 4 shows the histogram of z coordinates of the simulated point cloud, which contains four distinct peaks. To extract the peaks we simply find the bins that have a greater count than their neighbours, with the constraint that if two peaks are found less than 5 bins apart the lower peak is eliminated. More elaborate techniques such as the mean shift (Comaniciu and Meer, 2002) or fitting a spline curve to local maxima (Li et al., 2004) can also be used, but we found that this simple technique yields satisfactory results.
The distance between the first two peaks and that between the last two peaks determine the heights of the two storeys of the building. These are used as an estimate of sz for the cuboid placement in each storey. The bin between the two close peaks, which has the lowest count is used to divide the point cloud to two subclouds. The grammar rules are then applied to the subclouds corresponding to each storey separately.
Figure 5 shows the histograms of the x- and y coordinates of each storey, from which the location and size of the cuboids are derived. In essence, the peaks in these histograms define a
Figure 4. The histogram of z coordinates showing distinct peaks corresponding to the two storeys of the building.
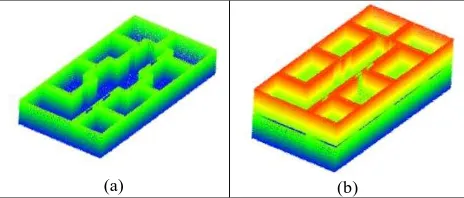
Figure 6 shows the cuboids generated by iteratively applying the cuboid placement rule parameterized based on the peaks in the histograms of x-, y- and z coordinates.
In addition to the cuboid parameters, the neighbourhood relation between the cuboids is also derived from the peaks in the histograms. This facilitates the application of the second rule. Every pair of neighbouring cuboids are connected provided that the connecting cuboid is not on a wall. Figure 7 shows the distribution of points-on-wall indices calculated for cuboids placed in empty spaces and for those placed on walls. Clearly, the indices for the two types of spaces are quite distinct, even though most empty spaces are adjacent to a wall from one or two sides. Based on Figure 7, a threshold of 0.5 was chosen to distinguish between empty spaces and walls.
Figure 8 shows the result of iteratively applying the second rule to connect the cuboids that are not separated with a wall. The final spaces produced by iteratively applying the merge rule are shown in Figure 9. Overall, the final model of the first floor was created by 42 times application of the first rule (place cuboid), 52 times application of the second rule (connect cuboids) and 102 times application of the third rule (merge cuboids). For the model of the second floor, which has a simpler design, the number of rule applications were 16, 12 and 25, respectively for the first, second and the third rule. All rules were generated, parameterized and applied fully automatically.
Figure 5. The histograms of x- and y coordinates for each floor showing distinct peaks corresponding to the location of walls and size of subspaces.
(a) (b)
Figure 6. Top view of the cuboids generated by iteratively applying the first rule to subclouds of the first floor (a) and the second floor (b).
Figure 7. Distribution of point-on-wall indices for cuboids placed in empty spaces and on the walls.
(a) (b)
Figure 8. Connecting cuboids of the first floor (a) and the second floor (b) by iteratively applying the second rule.
(a) (b)
Figure 9. Final spaces of first floor (a) and second floor (b).
4.2 Results for the real point cloud
A point cloud of an interior space with a long corridor of a building in the University of Vigo was acquired by a terrestrial laser scanner for the second experiment. Figure 10 shows a low-density version of the point cloud.
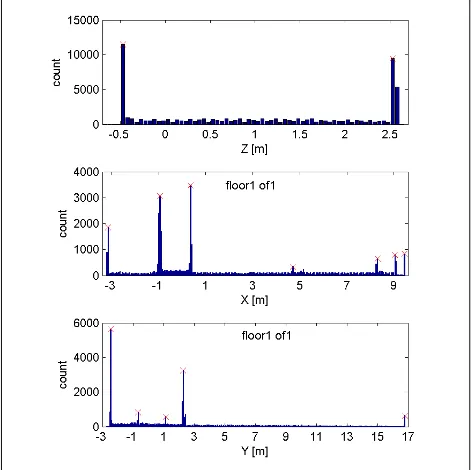
Figure 11 shows the histograms of z-, x- and y coordinates and the extracted peaks used for the placement of cuboids. In the histogram of z coordinates only two peaks were found, indicating that there is only one storey. The peaks in the histogram of x- and y coordinates were used to apply the cuboid placement rule. The result is shown in Figure 12(a). As it can be seen, two cuboids are missing in the middle of the interior space. Examining Figure 10 reveals a gap in the ceiling caused by an inner patio connecting the floors of the building. Because of this gap the points-on-ceiling constraint was not satisfied for this part of the point cloud, and so no cuboids were placed there. Those cuboids can be placed manually by providing appropriate position and scale parameters to the first rule, or by disabling the point-on-ceiling constraint temporarily. Figure 12(b) shows the result of cuboid placement with the two cuboids placed manually.
Since the interior space in this experiment did not contain any interior walls there were no empty spaces left between the cuboids. Therefore, the second rule for connecting the cuboids had no effect, and the adjacent cuboids could already be
(a) (b)
merged. Figure 13 shows the final model generated by merging adjacent cuboids through iterative application of the third rule. Overall, the final model of the interior space was created by 16 times application of the first rule (place cuboid) and 23 times application of the third rule (merge cuboids). The second rule (connect cuboids) was applied, but did not create any connecting cuboids.
Figure 10. Point cloud of an interior space obtained by terrestrial laser scanning.
Figure 11. Histograms of z-, x- and y coordinates for the real point cloud and the extracted peaks.
(a) (b)
Figure 12. Cuboid placement in the real point cloud. Two cuboids are missing (a) because there are no points on the ceiling (see also Figure 10). These were placed manually by temporarily disabling the points-on-ceiling constraint (b).
(a) (b)
Figure 13. Final model of the interior space obtained by iteratively applying the merge rule to the cuboids. The model is shown as a solid with transparent faces (a), and as converted to B-rep with the ceiling removed to provide a better view of the interior (b).
5. REPRESENTATION OF SEMANTICS
Using the shape grammar, an indoor environment is modelled as a configuration of parameterized spaces. Such a model contains semantics like height and volume of the spaces and their topological relationships. Knowledge about the configuration of interior spaces and relations between them is the basis for the representation of semantically rich 3D building models both in the world of Building Information Models (BIM) and in the world of 3D GIS. While topological relationships between elements are inherent in both cases, the geometric detail and the semantic content depend on the application area for which models are created.
In the world of 3D GIS, the CityGML standard represents building interiors as navigable and non-navigable spaces in models at level of detail 4 (LoD-4). While presently our models consist of navigable spaces, non-navigable spaces can be easily modelled by placing cuboids on walls using the points-on-walls index (See Figure 7). Also the grammar can be extended to model openings like doors and windows. In CityGML, openings that connect spaces represent adjacency between them, since the surface that represents the opening is part of the boundaries of both spaces. The adjacency relationship between spaces though openings can be used to derive an accessibility graph for indoor navigation or for determining the spread of gas or smoke.
In the world of BIM, the gbXML standard was exclusively developed in order to support all the information necessary for energy analysis applications. In terms of geometry, the structural elements of a building (i.e. walls, ceilings and floors) are represented as planar surfaces each being adjacent to two spaces. These surfaces can be simply obtained from the volumetric spaces (See Figure 13). The adjacency relations, which is fundamental for heat transfer calculation between spaces, can also be passed from the spaces to the surfaces and stored as part of their semantic content.
6. CONCLUSIONS
In this paper we presented an approach to 3D modelling of indoor environments based on a shape grammar. It was shown that indoor environments can be modelled by iteratively placing, connecting and merging cuboid shapes. We also presented methods for learning the parameters and sequence of the rules from a point cloud.
The shape grammar presented in this paper can be used to model a variety of indoor architectures. Our experiments, The International Archives of the Photogrammetry, Remote Sensing and Spatial Information Sciences, Volume XL-5, 2014
however, showed the applicability of the method to indoor environments with Manhattan-World structure only. Future work will focus on extending the grammar with additional rules and conducting further experiments to model non-Manhattan-World indoor environments. Further experiments are also needed to evaluate the methods with data that contain more clutter and occlusions.
Acknowledgments
The second author would like to give thanks to the Government of Spain for the financial support given through human resources grants (FPU AP2010-2969).
References:
Becker, S., Peter, M., Fritsch, D., Philipp, D., Baier, P., Dibak, C., 2013. Combined Grammar for the Modeling of Building Interiors. ISPRS Ann. Photogramm. Remote Sens. Spatial Inf. Sci. II-4/W1(1-6.
Budroni, A., Boehm, J., 2010. Automated 3D reconstruction of interiors from point clouds. International Journal of Architectural Computing 8(1), 55-73.
Comaniciu, D., Meer, P., 2002. Mean shift: A robust approach toward feature space analysis. IEEE Transactions on Pattern Analysis and Machine Intelligence 24(5), 603-619.
Díaz-Vilariño, L., Lagüela, S., Armesto, J., Arias, P., 2013. Semantic as-built 3d models including shades for the evaluation of solar influence on buildings. Solar Energy 92(0), 269-279.
Jenke, P., Huhle, B., Straßer, W., 2009. Statistical reconstruction of indoor scenes, Proc. WSCG.
Li, Z.L., Khoshelham, K., Ding, X., Zheng, D., 2004. Empirical mode decomposition transform for spatial analysis, in: Li, Z.L., Zhou, Q., Kainz, W. (Eds.), Advances in Spatial Analysis and Decision Making. Swets & Zeitlinger, Lisse, The Netherlands, pp. 19-29.
Oesau, S., Lafarge, F., Alliez, P., 2014. Indoor scene reconstruction using feature sensitive primitive extraction and graph-cut. ISPRS Journal of Photogrammetry and Remote Sensing 90(0), 68-82.
Sanchez, V., Zakhor, A., 2012. Planar 3D modeling of building interiors from point cloud data, 19th IEEE International Conference on Image Processing (ICIP), Orlando, FL, pp. 1777-1780.
Stiny, G., 2008. Shape: talking about seeing and doing. The MIT Press.
Stiny, G., Mitchell, W.J., 1978. The Palladian grammar. Environment and Planning B 5(1), 5-18.
Valero, E., Adán, A., Cerrada, C., 2012. Automatic Method for Building Indoor Boundary Models from Dense Point Clouds Collected by Laser Scanners. Sensors 12(12), 16099-16115. Xiao, J., Furukawa, Y., 2012. Reconstructing the world's
museums. Proceedings of the 12th European conference on Computer Vision - Volume Part I, Florence, Italy.
Xiong, X., Adan, A., Akinci, B., Huber, D., 2013. Automatic creation of semantically rich 3D building models from laser scanner data. Automation in Construction 31(0), 325-337. The International Archives of the Photogrammetry, Remote Sensing and Spatial Information Sciences, Volume XL-5, 2014