SUNKOSHI LANDSLIDE IN NEPAL AND ITS POSSIBLE IMPACT IN INDIA: A
REMOTE SENSING BASED APPRAISAL
P.K. Champati raya and S. L. Chattorajb
a Indian Institute of Remote Sensing, 4-Kalidas Road, Dehradun-248001, [email protected] b Indian Institute of Remote Sensing, 4-Kalidas Road, Dehradun-248001, [email protected]
Commission VIII, WG VIII/1
KEY WORDS: Sunkoshi, Landslide, Dammed lake, Remote Sensing, Kosi, Hydrological analysis
ABSTRACT:
A devastating landslide that killed at least 156 people occurred on the right bank of Sunkoshi river at village Jure, 70 km northeast of Kathmandu in Nepal. It not only affected hydroelectric projects in the near vicinity but also had potential to flood large tracts of downstream area in Nepal and north Bihar. Timely action by Nepal Army and Indian authorities have averted a major disaster but satellite data analysis (using IRS Resourcesat-2 LISS IV, WorldView-2, RISAT-1, Radarsat-2 etc.) reveal that the site was easily identifiable on satellite image as a potential landslide zone that has been affected by landslide related mass wasting in the past. It was reactivated and intermittently slided during 2000-2012 and finally when the whole mass came down on 2nd August 2014 pushing materials up to the opposite slope, a landslide dammed lake was formed on Sunkoshi river which extended up to a distance of 2.5-3km as observed on 5-6th August on satellite images and the volume was estimated to be around 8.26-10.5MCM, which needs to be released safely to avert any further disaster. Attempt is made to simulate the event to assess the run out and debris thickness using process based model. Satellite observation (using IRS Resourcesat-2 LISS IV, WorldView-2, RISAT-1, Radarsat-2 etc.), aided by hydrological data obtained through telemetry immensely helped to assess the landslide dimension, lake extent, volume, discharge, water level and travel time of water in Sunkoshi river. But the question remains how to manage the large amount of debris that Sunkoshi brings to its downstream areas causing river aggradations that eventually increases the flood risk. In such situations, the most immediate landslide remedial measures are four fold: monitoring of landslide, dam and reservoir using remote sensing and hydrological observations, controlled release of water, water discharge management at Kosi barrage and mechanism/preparedness for evacuation. The Sunkoshi landslide has brought to forefront the core issue of analysing mass wasting in all major river valleys outside Indian territory that can pose risk to Indian population. In this regard, it is needless to say that remotely sensed images through Indian Remote Sensing satellites and many other satellites can provide most crucial information in short time.
INTRODUCTION
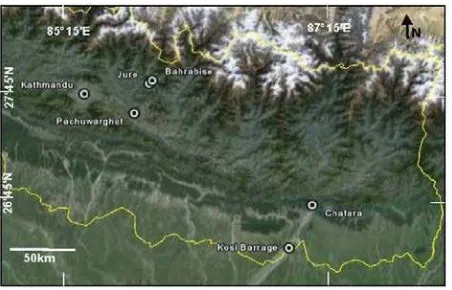
A devastating landslide occurred on the early hours of 2nd August 2014 on the right bank of the Sunkoshi river above Jure village, Sindhupalchok district, at a distance of 70 km ENE of Kathmandu, Nepal (Figure 1; SANDRP, 2014). As a result of this Sunkoshi river was blocked at the river meander and it created a large landslide dammed lake (LDL) which extended up to a distance of more than 2 km in the upstream direction and submerged the economic as well as strategic Nepal-China Arniko highway on the right bank, many settlements, 2.5 MW Sunima power project area and most importantly it caused potential threat of landslide lake outburst flood (LLOF). The river Sunkoshi and its tributaries have a history of lake formation due to landslides and subsequent breaching and flooding (Shrestha et al., 2014). The Kosi disaster of 2008 is still fresh in mind when Kosi changed its course after 200 years due to breaching of embankment and flooded large parts of North Bihar that affected 3.3 million people (Sinha, 2009a, 2009b). Therefore, there was a wide spread concern in Nepal and India and as a preventive measure tens of thousands of people were evacuated to safer locations in eight districts along
Kosi in order to avoid the repetition of 2008 Kosi disaster. In a swift action Nepal army has done a commendable job by blasting off part of the landslide blockade and facilitated release of water from the lake. In order to support the disaster management efforts, National Remote Sensing Centre (NRSC), Hyderabad quickly acquired satellite data over the region using optical (Resourcesat-2) and microwave satellite (RISAT-2) and provided information on spatial extent of the landslide and lake.
International Charter for Disasters was also activated to acquire satellite data through global satellite operators. In the present context, an attempt is made to analyse all the available satellite and ancillary data and provide inputs that would aid in disaster management.
Figure 1. Landslide location (Jure) and gauge stations (Bahrabise, Pachuwarghat and Chatara) along Sunkoshi river.
Background satellite image (Source: Google Earth)
Figure 2. Landslide location (Jure) and landslide dammed lake on Sunkoshi river. View is towards NE (upstream direction).
Terraces on the opposite slope are completely covered by landslide mass (Source:www.thedailystar.net).
2. Data used
Table 1. Different data types and their sources.
Data Source
LISS-IV (5.8.2014) and RISAT-II (4.8.2014): Analysed data and report LISS-IV (7 and
12.09.2014): Only data
NRSC, Hyderabad
Satellite data (pre-event)-R2 LISS IV
(27.02.2013): only data. World View
NRSC, Hyderabad and Google Earth
SRTM DEM (90m resolution)
Shuttle Radar Topography Mission, NASA, JPL Worldview-2, MX, PAN,
13.02.2013 International Charter Geological map and
information
Nepal Geological Survey and personal communication Disaster related
information
Reports of ICIMOD and SANDRP
Precipitation data (Global), 10km resolution
Climate Prediction Centre, NOAA, USA
Hydrological data
Department of Hydrology and Meteorology (DHM), Govt. of Nepal, and Govt. of Bihar
3. SATELLITE DATA INTERPRETATION AND ANALYSIS
Satellite data products have been found very useful for landslide mapping and its impact assessment (Mantovani, 1996; Metternicht, 2005). In the present study moderate and high resolution satellite data products were analysed. The landslide (270 46’ 00” N, 850 52’ 25” E) is located on the right bank of a meander of river Sunkoshi at Jure close to village Mankha, between two hydropower sides, 2.5 MW Sunima Hydropower site on upstream and 10.5 MW Sunkoshi Hydropower intake dam on the downstream side at a distance of 1 km (Figure 1 and 2). The major trade and strategic route, i.e., Arniko Highway between Nepal and Tibet passes through the landslide on the right bank and after two kilometres on the upstream side it crosses over to left bank at Bahrabise. It is needless to say that the road has been completely destroyed for a length of 850m-1km in the landslide section and further upstream it is submerged
in landslide lake for a length of about 2 km (Figure 3a and 3b). IRS R2 LISS-IV image acquired on 7th and 12th Sep.2014 show slight change in the dimensions of the landslide and reduction in lake volume due to release of water by controlled blasting (Figure 4a and 4b).
Figure 3a and 3b. Landslide dimensions as observed on IRS Resourcesat-2 LISS-IV satellite data acquired on 5th August
2014 (Source: NRSC)
Figure 4a. Landslide dimensions as observed on IRS Resourcesat-2 LISS-IV satellite data acquired on 07th
Figure 4b. Landslide dammed lake dimensions as observed on IRS Resourcesat-2 LISS-IV satellite data acquired on 07th
September 2014 (Source: NRSC)
The location of landslide was a very vulnerable location as it is a site of old landslide in a topographic hollow and at the outward side of the river meander where maximum toe/bank erosion is expected. It has been reactivated in the recent past as shown by landslide scar at an elevation of 1300-1350m which is above 500-550m from the river level of 800m as shown on pre-event IRS-LISS-IV data (www.nrsc.gov.in) as well as on World View satellite images (available in Google Earth for the time period 2000 to 2012, Figure 5 and 6). On 2nd August at around 2.30 AM the landslide was again reactivated and completely covered the old slide zone and the crown had extended further upward at least up to an elevation of 1500m. The landslide length is 1.3 km and width is 853m (www.nrsc.gov.in). The landslide debris volume was so huge that it could not be accommodated in the narrow valley of Sunkoshi river, although the river was widest (60-70m) in this part of the course due to meandering. The landslide debris that descended from a height of 1500m on the right bank to river valley at 790-795m and then it moved up on the left bank and covered 4 levels of terraces observed at 796m, 800m, 812m and 823m (Figure 7). Thus, the landslide debris has reached up to a height of 825m from lowest level valley elevation of 790-795m. Therefore, after recovering 33 bodies from debris, 123 people, who were missing and believed to be buried under thick debris, were declared dead and rescue operations were abandoned (www.nepalmountainnews.com).
Figure 5. Reactivation of landslide at the same location prior to 2014 event as observed in 2000 (Source: Google Earth). Dotted arrow shows the flow direction of Sunkoshi and solid arrow
shows the direction of landslide.
Figure 6. Reactivation of landslide at the same location prior to 2014 event as observed in 2012 (Source: Google Earth). Dotted arrow shows the flow direction of Sunkoshi and solid arrow
shows the direction of landslide.
Figure 7. Four levels of terraces as observed on satellite images (Source: Google Earth). All the four levels of terraces were covered by landslide debris on 2nd August up to a height of
30-35m from the river bed.
It is interesting to note that similar to 4 levels of terraces at the landslide location, 2km in the upstream direction on the left bank also 4 levels of terraces are observed at an elevation of 828-830m, 832m, 850m, and 870m. The relative relief difference between the river level and the highest terraces in both the cases is around 30-40m and both have formed on the left bank thus showing the overall hydrodynamic pressure on the right bank at both these locations and the present landslide has occurred in one such location. Movement of landslide masses from one bank to another is not very uncommon, as has been observed during Ukhimath landslide in 1998 in Garhwal Himalaya and Hatian Bala landslide in 2005 in Kashmir region and at many other places worldwide (Champati ray et al., 2009; 2012; Costa and Schuster, 1988; Dunning et al., 2007; Schneider et al., 2013; Yin et al., 2009). In all these cases rivers were blocked and dams were formed like the present case. The most spectacular and oldest of these events was the Gohna Tal landslide (Garhwal Himalaya) that occurred in 1893 and blocked river Birahi which breached first in 1894 and later in 1970 causing devastating floods in Garhwal Himalaya (Champati ray, 2013; Weidinger, 1998).
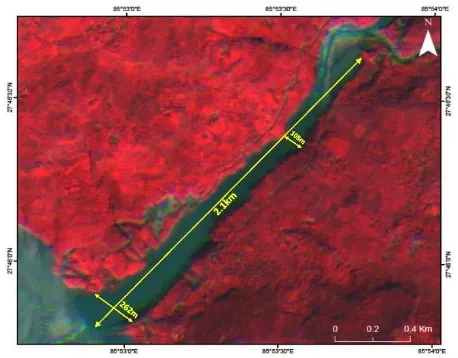
In the present case, the landslide dammed lake rapidly grew in size and on 5th August its length and width were 2.36 km and 202 m respectively as observed on IRS-LISS-IV satellite image (source: www.nrsc.gov.in). Gradually its length increased to almost 3.0 km as observed on Radarsat fine beam image acquired on 6th August 2014 and reported by International Charter on Space and Major Disasters. The landslide dam has submerged the 2.5 MW Sunima Hydropower site, Arniko Highway on the right bank and settlements. In case of sudden breach, the power project immediately on the downstream side, 10.5 MW Sunkoshi hydropower will be most affected followed by cascading effect
on all hydropower projects in the downstream of Sunkoshi river. Attempt has been made to estimate the volume of lake, based on the discharge data in the upstream area at Bahrabise. The discharge was recorded around 160m3/s, and considering the blockade was for 13 hrs, it is estimated as 7.4 million cubic meter (MCM). However, it is lower estimation as there are two more streams discharging into the lake between Bahrabise and the landslide dam. Based on the water spread as observed on satellite image on 5th and 6thAugust and maximum height of the landslide dam at 30-35m above the valley bottom, lake volume is estimated as 8.26-10.50MCM.
Geologically this area is underlain by Lesser Himalayan rocks (known as Kunchha Formation, the oldest rock in Lesser Himalaya) consisting dominantly of phyllite, schistose phyllite and quartzite (personal communication: Dr. Dinesh Pathak, Trivuban University). The area lies very close to Main Central Thrust zone and most importantly it is traversed by two sets of prominent joints oriented in NW-SE and NE-SW directions (Figure 8a and b). One such lineament in NW-SE direction passes through the landslide zone showing the overall structural weakness in strata. Overall the slope of the area is around 58-600 and the entire landslide mass can be divided into two zones with one resistant layer in between. On 2nd August 2014, failure was observed on both the portions: the upper portion shows more of rock slide whereas the lower portion shows rock and debris slide.
Figure 8a. Regional geological map showing location of landslide in the Lesser Himalayan zone but closer to MCT zone
(Source: TBG)
Figure 8b. Major lineaments (dashed lines) of the region and the most prominent lineament in NW-SE direction is through the landslide zone (solid line). Background satellite image
(Source: Google Earth).
4. HYDROLOGICAL DATA ANALYSIS
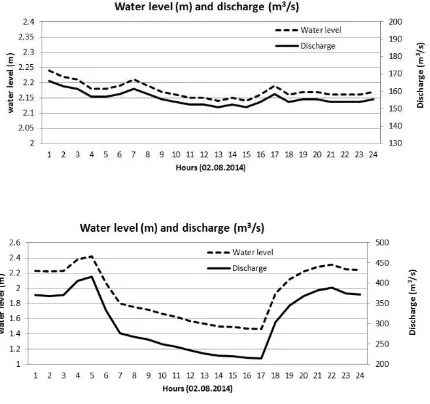
Hydrological data, particularly water level and discharge data was analysed for two important stations from both upstream and downstream side of the landslide blockade area. The discharge was approximately around 160m3/s on 2nd August 2014 at Bhote Koshi, Bahrabise on the upstream side at a distance 3.5 km. However, the actual discharge to the landslide lake would be higher due to contribution from two tributaries on the left bank between the measurement site and landslide location. Water level was around 2.2m which rises in tandem with discharge of Sunkoshi that confirms consistent data quality. Due to the landslide dam, a lake was formed and from 5 o’clock to 17 o’clock in the evening, the discharge was reduced from 416.2 to 214.2 m3/s as measured at Pachuwarghat on Sunkoshi at a distance of 35 km from the landslide. It clearly shows blockade of the Sunkoshi and balance discharge was from tributaries of Sunkoshi between landslide location to Pachuwarghat. From 17.00 hrs onwards, the discharge started increasing along with the water level and by 22.00 hrs it almost regained normal discharge of 400 m3/s (Figure 9). This increase in flow is attributed to controlled blasting of landslide dam by Nepal Army to allow passage of water from the reservoir. Although there are possibly stream discharge measurement sites close to the landslide, but the area close to the upstream side (belonging to 2.5MW Sunima hydropower project) was damaged due to lake formation and data from immediate downstream i.e. from 10.5 MW Sunkoshi hydropower project was not available. Therefore, data from Bahrabise and Pachuwarghat were analysed. On 3rd August the flow in to the lake remained at around 160 m3/s at Bahrabise and there was slight drop of discharge at Pachuwarghat at around 17.00 hrs after which it regained to 400 m3/s (Figure 10). Discharge data at Pachuwarghat was analysed for 8 days (1-8 August), peak flow was observed on 4th, 6th and 8th August at Pachuwarghat (Figure 11). The discharge data at both the upstream and downstream provides very crucial information that needs to be monitored continuously for effective disaster management.
Figure 9. Water level and discharge observations at a) Bahrabise (upstream of landslide) and at b) Panchuwarghat
(downstream of landslide) on Sunkoshi. The reduction in discharge indicated blocked Sunkoshi river at landslide dam, which was partially breached by blasting to regain the flow of the river as indicated by rise in water level and discharge (Data
Figure 10. Water level and discharge observations at a) Bahrabise (upstream of landslide) and at b). Panchuwarghat (downstream of landslide) on 3rd August 2014 showing normal
flow between two stations except for marginal reduction at around 16-17hrs at Panchuwarghat (Data source: Nepal Govt.).
Figure 11. Sunkoshi discharge at Bahrabise (upstream of landslide) and Panchuwarghat (downstream of landslide) during
1-8th August 2014 showing variation between two stations particularly three discharge peaks at Panchuwarghat that could
be related to higher flow from the landslide dammed lake. The dip in discharge is attributed to reduced flow on 2nd August due to landslide dammed lake formation (Data source: Nepal
Govt.).
5. IMPACT IN INDIA
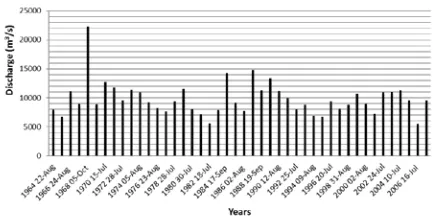
Indian border lies at a distance of 270 km from the landslide and lake area and the most important hydrological structure, Kosi barrage is clearly at a stake. In the event of sudden release of water due to breach, it can be severely affected. Therefore, all 56 gates were kept open at Kosi barrage and nine districts of north Bihar were advised to be on high alert till 4th August (Times of India, 4th August).The Kosi barrage with a capacity to handle9,50,000 cusec (26,900 m3/s) had embankment breached at 1,44,000 cusec (4100 m3/s) in 2008 (Sinha, 2009a; 2009b).Therefore, there was a concern and it is important to note that due to siltation and river aggradations, the barrage capacity has reduced since its construction in 1964 (Figure 12; Sinha, 2009a and 2009b). The peak discharge in 1968, 1971, 1980, 1984, 1991 are associated with major flood events, even these
were lower than the highest capacity of Kosi barrage as well as estimated peak flood discharge (Figure 12 and Table 2). Kosi basin has a high sediment yield rate and larger catchment area compared to its alluvial plain, which suggests large volume of sediment is deposited in the relatively small area and as a result river aggradations takes place in downstream areas close to Kosi barrage and adjoining areas (Sinha, 2009a and 2009b; Sinha and Friend, 1994).
Table 2. Return period of peak discharge at Kosi barrage (Source: Govt. of Bihar)
Return period (years)
Peak discharge by Gumbel’s method (cumec)
Peak discharge by Log Pearson method (cumec)
Barahkshetra G&D Site
Hanuman Nagar G&D Site
Barahkshetra G&D Site
Hanuman Nagar G&D Site
50 20235 17812 18519 17157
100 21555 18783 18994 18633
In order to assess the damage control efforts at Kosi barrage, the immediate upstream data available at Chatara, Nepal was analysed. The discharge of Sunkoshi was between 3000-4000 m3/s during the first week of August 2014 (Figure 13). It shows a reduction in discharge around 17.5 hrs after the reported time of landslide and dam formation (2.30 hrs on 2nd August 2014), which is equivalent to travel time of the water from landslide area to the gauge site at Chatara on Sunkoshi. Considering its distance of 43 km from Kosi barrage, it was expected that the flood water would reach Koshi barrage approximately after 20 hours in the event of breach. Therefore, if the breach time is known then very efficiently preventive measures can be taken as sufficient time would be available to evacuate. However, in the present case as a preventive measure, a large number of people were evacuated, which is a welcome move, but such scientific data can be considered in future to optimise the evacuation plan.
Figure 12. Peak discharge at Kosi Barrage, high values correspond to flood and breaching of embankments. Even at
lower value, embankments have breached indicating role of sedimentation in reducing the actual capacity of the reservoir
(Data source: NIC, Bihar Govt.)
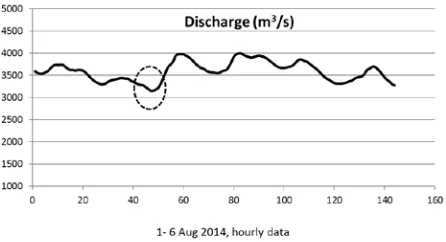
Figure 13. Sunkoshi discharge at Chatara (43 km upstream of Kosi Barrage) during 1-6th August 2014 showing the dip in discharge attributed to reduced flow due to landslide dammed
lake formation on 2nd August (Data source: Nepal Govt.). Such data provides actual travel time of flow from the dammed
landslide lake to Kosi Barrage.
As Kosi catchment has high sediment yield and the landslide dam provides readily available sediment to be transported, it is important to assess the sediment that would be deposited both in short term in the event of breach and long term in case the lake/reservoir is emptied in a controlled manner. Therefore, it is very important to make a quantitative assessment of sediment yield throughout the course of Sunkoshi and at the barrage site in India. The high sedimentation rate in and around Kosi barrage can severely affect the total reservoir capacity and even at lower discharge the highest flood level (HFL) can be exceeded. Secondly considering the 2008 event when at much lower discharge, the eastern embankment was breached, it is very important to assess the total load of sediments ever since the construction of Kosi barrage in 1963-64 and its impact on maximum storage capacity. Landslides are the main source of sediment yield in Lesser and Higher Himalaya as many researchers including Gabet et al. (2004) have reported. There is an intricate relationship between landslides, resulting flash flood, high sediment supply to river system, high sedimentation in the upstream of dam/barrage, reduction in the reservoir volume, finally breaching or overflowing of embankments/dams and flooding that can affect almost entire north Bihar
The present landslide has brought large amount of sediment to the river bed and if the slide continues in future, it will further add to the sediment load of Sunkoshi that will eventually reach Kosi barrage. Therefore, the flood risk assessment at Kosi barrage need to consider the following: monitoring of the landslide and landslide dammed lake, discharge of Sunkoshi from landslide point to Kosi barrage, sedimentation and actual capacity vs. highest flood level recorded in recent times at Kosi barrage. Therefore, Kosi flood disaster management should look into three major aspects, viz. 1) river valley monitoring using remote sensing and hydrological observations in all the three rivers (Sunkoshi, Arun Koshi and Tamur Koshi), 2) barrage management to regulate flow at Kosi barrage, and 3) effective evacuation plan based on actual scientific data. Additionally as a long term measure, valleys of all major rivers that enter India, need to be monitored for possible landslide dam and lake formation in future.
6. SUMMARY AND CONCLUSIONS
A massive landslide blocked Sunkoshi river near Mankha village in Sindhupalchowk district, Nepal which is about 70kmsfrom
Kathmandu. Around two dozens of houses were buried in the landslide; 33 bodies were recovered; and all 123 missing people were declared dead. The landslide has also buried strategic Arniko Highway at dam site in Mankha vilage. The government had mobilized security forces which blasted off a small portion of the 30-35m high landslide dam that had blocked the flow of Sunkoshi river and formed a massive lake which spread up to 3 km upstream. The 2.5 MW Sunima hydropower project (constructed in 2004-5) was inundated in the upstream and in the downstream, the intake dam of the 10.5 MW Sunkoshi hydro project was also affected and faces the risk of inundation in case the dam breaches. Apart from the losses and effect in the immediate near vicinity, the landslide and the reservoir with an estimated capacity of 8.26-10.50 MCM of water posed danger to the people living in the downstream areas of Nepal and Bihar. Particularly, the Kosi barrage at India-Nepal border was in danger and as a precaution, authorities in India evacuated hundreds of thousands of people to safer locations to avoid repetition of 2008 Kosi disaster. With the effort of Nepal Army and Indian authorities, the disaster related to landslide dam breach was averted.
Realising the potential hazard and in order to address wide spread concern, the satellite data from various sources were analysed. NRSC (ISRO) acquired data on emergency basis and provided very valuable preliminary results. Satellite data analysis revealed that the area was an old landslide zone, which was reactivated in the past (as revealed by temporal satellite data) as well as on 2nd August 2014. Unfortunately, the landslide was not monitored and no preventive measures were taken. Using remote sensing inputs, the dam height and reservoir volume could be established, which corroborated well with the ground information. The discharge data available at downstream and upstream areas were analysed to assess effect of blockade till Kosi barrage. The hazard potential at Kosi barrage was also assessed in the light of peak flood level vis-a-vis current situation. Hydrological data at Kosi and upstream of Kosi provided valuable inputs for emergency management. Overall, it has been demonstrated that remote sensing inputs along with automated gauge and telemetry data can immensely contribute to optimise the disaster response mechanism. One of the major gap area is information on local precipitation through AWS, sediment yield, discharge measurement at close interval, particularly close to landslide dam (in an emergency), temporal satellite data and very timely acquisition and global dissemination of such data for scientific as well as disaster response. Govt. of Nepal has facilitated on-line hydrological data availability and similar efforts should be made in Indian side to utilise data for disaster management.
REFERENCES
Champati ray, P.K. 2013. A tale of two lakes from Uttarakhand. Indian Landslides, Vol. 6 (2), 1-8.
Champati ray, P.K., Parvaiz, I., Bhat, F. A., Dadhwal, V. K., 2012. Earthquake induced landslide dam in Kashmir Himalaya, International Journal of Remote Sensing, 33(2), 655–660.
Costa, J. E., and Schuster, R. L., 1988. The formation and failure of natural dams. Geological Society of America Bulletin, 100(7), 1054-1068.
Dunning, S. A., Mitchell, W. A., Rosser, N. J., and Petley, D. N., 2007. The Hattian Bala rock avalanche and associated landslides triggered by the Kashmir Earthquake of 8 October 2005. Engineering Geology, 93(3), 130-144.
Gabet, E. J., Burbank D.W., Putkonen J.K., Pratt-Sitaula B. A., Ojha T., 2004. Rainfall thresholds for landsliding in the Himalayas of Nepal, Geomorphology 63 (2004), pp. 131–143
Mantovani, F., Soeters, R., and Van Westen, C. J., 1996. Remote sensing techniques for landslide studies and hazard zonation in Europe. Geomorphology, 15(3), 213-225.
Metternicht, G., Hurni, L., and Gogu, R., 2005. Remote sensing of landslides: An analysis of the potential contribution to geo-spatial systems for hazard assessment in mountainous environments. Remote sensing of Environment, 98(2), 284-303.
SANDRP, 2014. Massive landslide blocks Sunkoshi River,
Downstream Nepal-India under threat,
http://sandrp.wordpress.com.
Schneider, J. F., Gruber, F. E., and Mergili, M., 2013. Recent cases and geomorphic evidence of landslide-dammed lakes and related hazards in the mountains of Central Asia. In Landslide
Science and Practice (pp. 57-64). Springer Berlin Heidelberg.
Shrestha, A.B., Khanal, N.R, Shrestha, M., Nibanupudi, H.K., and Molden, D., 2014. Eye on the Sun Koshi Landslide: Monitoring and Infrastructure Planning Key to Minimizing Scale of Disasters, ICIMOD report on 04 Aug 2014.
Sinha, R. and Friend, P. F., 1994. River systems and their sediment flux, Indo-Gangetic plains, northern Bihar, India. Sedimentology, 41, pp.825-845.
Sinha, R., 2009a. Dynamics of a River System – the Case of the Kosi River in North Bihar, Journal of Earth Science India, Vol.2 (I), January, 2009, pp. 33- 45.
Sinha, R., 2009b. The Great avulsion of Kosi on 18th August 2008, Current Science, 97(3), pp. 429-433.
Weidinger, J.T., 1998. Case history and hazard analysis of two lake-damming landslides in the Himalayas. Jour. Asian Earth Sci., 1998, 16 (2-3), 323-331.
Yin, Y., Wang, F., & Sun, P., 2009. Landslide hazards triggered by the 2008 Wenchuan earthquake, Sichuan, China. Landslides, 6(2), 139-152.