EVALUATION OF ELEVATION, SLOPE AND STREAM NETWORK QUALITY OF
SPOT DEMS
M. El Hage a,b, E. Simonetto a, G. Faour b, L. Polidori a
a
Laboratoire de Géodésie et Géomatique (L2G), ESGT, 1 Boulevard Pythagore, 72000 Le Mans, France e-mail : (mhamad.elhage, elisabeth.simonetto, laurent.polidori)@esgt.cnam.fr
b
National Center for Remote Sensing, CNRS Lebanon, P.O. Box 11-8281, Riad El-Solh 1107 2260, Beirut, Lebanon e-mail : [email protected]
Commission II, WG II/4
KEY WORDS: SPOT, DEM/DTM, Accuracy, Geomorphology, Quality, Reference Data, IKONOS, Scale.
ABSTRACT:
Digital elevation models are considered the most useful data for dealing with geomorphology. The quality of these models is an important issue for users. This quality concerns position and shape. Vertical accuracy is the most assessed in many studies and shape quality is often neglected. However, both of them have an impact on the quality of the final results for a particular application. For instance, the elevation accuracy is required for orthorectification and the shape quality for geomorphology and hydrology. In this study, we deal with photogrammetric DEMs and show the importance of the quality assessment of both elevation and shape. For this purpose, we produce several SPOT HRV DEMs with the same dataset but with different template size, that is one of the production parameters from optical images. Then, we evaluate both elevation and shape quality. The shape quality is assessed with in situ measurements and analysis of slopes as an elementary shape and stream networks as a complex shape. We use the fractal dimension and sinuosity to evaluate the stream network shape. The results show that the elevation accuracy as well as the slope accuracy are affected by the template size. Indeed, an improvement of 1 m in the elevation accuracy and of 5 degrees in the slope accuracy has been obtained while changing this parameter. The elevation RMSE ranges from 7.6 to 8.6 m, which is smaller than the pixel size (10 m). For slope, the RMSE depends on the sampling distance. With a distance of 10 m, the minimum slope RMSE is 11.4 degrees. The stream networks extracted from these DEMs present a higher fractal dimension than the reference river. Moreover, the fractal dimension of the extracted networks has a negligible change according to the template size. Finally, the sinuosity of the stream networks is slightly affected by the change of the template size.
1. INTRODUCTION
Geomorphometry is “the science of quantitative description and analysis of the geometric-topologic characteristics of the landscape” (Rasemann et al., 2004). It consists in the study of geomorphic indices as quantitative descriptors of the terrain shapes. This science brings geoscience, mathematics and computer science to model, parameterize and analyse the land surface (Pike et al., 2008). Slope, aspect and curvature are the basic indices extracted from DEMs to describe the terrain morphology. They are used in Digital Terrain Analysis (DTA) for many purposes. For instance, in hydrology they are used to extract the stream networks and to study their impact on terrain evolution, such as erosion and deposition (MacMillan and Shary, 2008).
The question of DEM quality remains an important factor for different users. To be useful for a particular application, a DEM has to be accurate enough to give reliable results (Reuter et al., 2008). The DEM quality can be divided into two: position and shape quality (Schneider, 2001). Both can affect the results of the considered application. Thus, the orthoimage production requires a high position quality, while geomorphological and hydrological applications need accurate shapes (Hengl and Evans, 2008).
The position accuracy assessment, specifically the elevation accuracy, is the most widely used method for evaluating DEMs (Temme et al., 2008). The elevation error in a DEM is
composed of gross, systematic and random errors (Wise, 2000) and is normally distributed (Heuvelink, 1998). The assessment method consists in calculating the Root Mean Square Error (RMSE) for the elevation using Ground Control Points (GCP) and then this value is considered as the DEM accuracy (Wise, 2000). If the sample of reference points is sufficiently large, this method can be efficient in evaluating the elevation accuracy of the DEM (Li et al., 2005). However, as it neglects the spatial autocorrelation of the elevation error, the position accuracy does not reflect the geomorphic indices quality (Heuvelink, 2002). Indeed, one value is not sufficient to characterize the DEM error (Heuvelink, 2002) because the spatial distribution of the error has not been taken into consideration (Hebeler and Purves, 2009). Therefore, this accuracy is not sufficient to evaluate the quality of the DEM for geomorphological and hydrological applications.
Shape quality assessment is often neglected when assessing DEM accuracy. It aims to evaluate the quality of the shapes calculated from the DEM. Because shapes are calculated based on the nodes of the DEM, there is a direct relation between position accuracy and shape quality. Indeed, this relation depends on the spatial autocorrelation of the elevation error and most geomorphic indices are sensitive to this autocorrelation (Heuvelink, 1998). Thus, it is possible to have poor position accuracy but the shapes can be adequately modelled and vice versa. Moreover, most geomorphic indices are scale dependent, unlike the elevation that is almost scale free (El Hage et al.,
2010). Therefore, the problem with their evaluation is that they are relative and depend on the mesh size (Evans et al., 2008). Some of these indices are scale-free like the closed depression volume (Shary et al., 2002, 2005). Oksanen and Sarjakoski (2005) have deduced that for the same DEM, as the mesh size increases, the slope error decreases. This does not mean that the slope becomes more accurate, rather it reveals that this accuracy is also relative. Thus, the mesh size has to be fixed depending on the considered application (Takagi et al., 2002) as the best description of most processes or phenomena is made using its own mesh size (Shary, 2008).
Finally, to evaluate the error propagation in the elevation derivatives, an autocorrelation model of the elevation error has to be built. This model, coupled with the elevation error, constitutes the error model of the DEM. Then, using this model, the error propagation in the geomorphic indices can be evaluated whether analytically if possible, or by using the Monte-Carlo simulation (Hunter and Goodchild, 1997). Oksanen and Sarjakoski (2005) have evaluated the elevation error propagation in slope, aspect and watershed extraction. Holmes et al. (2000) have assessed this propagation in slope, curvature, flow accumulation and terrain roughness.
Here, we deal with photogrammetric SPOT HRV DEMs and show the importance of the quality assessment of both elevation and shape. We shall first describe the methodology for the assessment of position and shape. We shall then present the results, discuss them and finally conclude.
2. MATERIALS AND METHODS Situated near the Mediterranean coast, it is characterized by its topographic and geomorphologic diversity. Thus, the altitude ranges from 0 to 3,093 m having many cliffs, peaks, valleys and plains. Many rivers pass through and flow into the sea.
Different sources of validation data have been utilized (table 1). The levelling points are distributed on the entire study zone. The valley profiles were surveyed locally using a total station and the distance between the sampling points is around 5 m. The modelled terrain is bare. The length of the first profile is about 575 m and 345 m for the second, the first being rougher than the second.
Table 1. Reference data used in the study
0 100 200 300 400 500
Figure 1. First (A) and second (B) validation profiles
Finally, the river was digitized by photointerpretation on a scale of 1:3000 using two IKONOS orthorectified panchromatic images dating from 2005 with a resolution of 0.8 m.
2.2 Methodology
Several stages are applied in our methodology. First, we calculate the elevation RMSE for each DEM using the levelling points. the characterization of hydrographical networks morphology (Gaucherel et al., 2011). We also calculate the percentage of sinks along the river and the RMS of the elevation difference between filled and unfilled DEM.
We extract the stream networks from DEMs using the ArcGIS algorithm. The fractal dimension is calculated by Matlab using the divider method (2). In this method, the length of the river L(s) is calculated using many divider lengths s. Then, the fractal dimension D is deduced from the slope of the loglog plot. b is a proportionality constant.
log(L(s))=(1−D)log(s)+b (2)
The sinuosity is calculated using the Hawths tools extension as the curvilinear to linear distance ratio (Beyer, 2009).
3. RESULTS
In this section, we first present the results of elevation accuracy then slope accuracy and finally the quality of stream network shape.
3.1 Elevation accuracy
The elevation accuracy assessment of the five DEMs is presented in figure 2. The error value of all the DEMs is smaller than the pixel size (10 m). This error depends on many factors such as the terrain slope (Toutin, 2002) and the land cover of the study zone. According to this figure, the elevation RMSE is the highest with a 5×5 template size, then it decreases to a minimum with 13×13 and then it increases. The influence of the template size on the elevation RMSE is little (about 1 m) with regard to the mean value of this RMSE.
5×5 9×9 13×13 17×17 21×21
Figure 2. RMSE of the elevation according to the template size
3.2 Slope accuracy gives better results for the first than for the second. The overall RMSE is higher for the second profile than for the first. An
Figure 3. RMSE of the slope for different template sizes according to the sampling distance (first profile (A), second
profile (B))
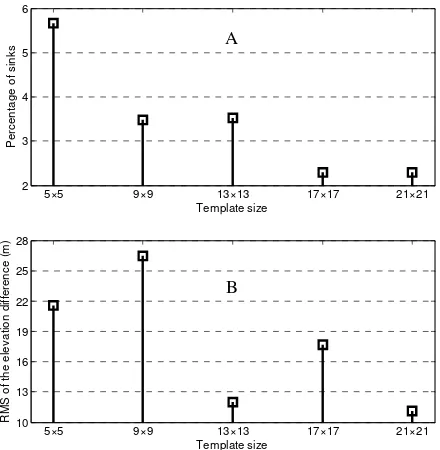
3.3 Quality of stream network
Since the surface of rivers is often smooth due to the water and the fact that it flows downwards, the presence of sinks along these rivers is an error. According to figure 4, the percentage of sinks along the reference river network decreases with the increase of the template size. The highest percentage is obtained with a 5×5 template. This is due to the numerous false matches in the DEM resulting from the use of this template. The decreasing number of these sinks is a quality criterion for the DEM. Moreover, the RMS of the elevation difference along the river between the filled and unfilled DEM is minimal with a
Figure 4. Percentage of sinks (A) and RMS of the difference of elevation between filled and unfilled DEM (B)
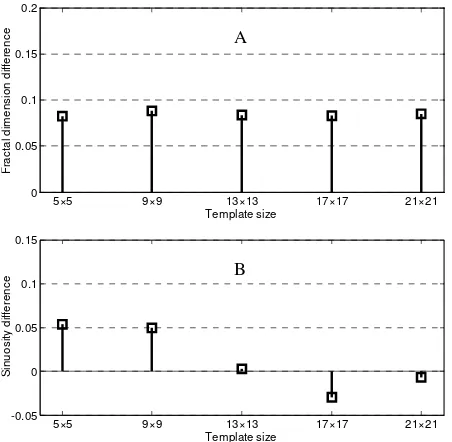
Finally, the comparison between the main river extracted from the DEM in terms of fractal dimension reveals that this dimension undergoes negligible change according to the template size (figure 5A). Compared to the reference river
digitized from the IKONOS orthoimages, the fractal dimension has a higher value. Thus, the extracted rivers present some erroneous shapes. The conversion from raster to vector during the extraction process produces rivers that are not smooth and contribute to this difference, most rivers being naturally smooth. The sinuosity also presents a negligible change and the template 13×13 gives the closest sinuosity to the reference river.
5×5 9×9 13×13 17×17 21×21
Figure 5. Difference of fractal dimension (A) and sinuosity (B) between the extracted and the reference river
4. DISCUSSION AND CONCLUSION
This study aims to assess the position and shape quality of a SPOT HRV DEM. The shape quality assessment is often neglected in geomorphological and hydrological studies but can affect the results of these applications. Thus, we first assess the elevation accuracy then the slope accuracy. Finally, we deal accuracy highly depends not only on this parameter but also on the sampling distance. Thus, the greater this distance, the less the slope RMSE. Oksanen and Sarjakoski (2005) obtained the same results. This does not mean that the slope quality is improved but rather this quality is relative and scale dependent. Furthermore, the increase of the mesh size tends to smooth the terrain (El Hage et al., 2010), so that the shapes obtained from the DEM differs. Thus, the choice of the mesh size is of a great importance for geomorphological studies. It has to be fixed according to the foreseen application (Takagi et al., 2002).
A 5×5 template gives the highest elevation RMSE, but it was not the worst template choice for the slope of the first profile. This means that the elevation RMSE does not reflect the slope quality. This is because it neglects the spatial autocorrelation of the elevation error (Heuvelink, 1998, 2002). Furthermore, the slope is the first derivative, therefore the elevation bias should cancel out. Thus, this quality has to be assessed whenever the
DEM is used in geomorphological studies. The assessment can be made either directly by calculating the slope RMSE or by using the error propagation method.
The elevation RMSE for all DEMs ranges from 7.6 m to 8.6 m. These values are smaller than the pixel size. In Cuartero et al. (2005) the RMSE of 91 SPOT HRV DEMs is 7.3 m. The values obtained in our study are comparable to this value.
The stream extraction from DEMs is frequently used. Thus, we assessed the quality of a river shape extracted from the DEM. The presence of numerous sinks along the river can change the course of the river or can even be considered as outlets if they are sufficiently deep. The lowest number of sinks with the least RMS of the difference of elevation between filled and unfilled DEM is obtained with the 21×21 template. This is due to the high smoothness obtained with this template size. By comparing the fractal dimension of the reference and the extracted river, we deduce that the extracted rivers have a higher value. This is in part due to the conversion from raster to vector that produces rough rivers. Thus, these outputs have to be smoothed to be more realistic.
As we have seen, the elevation and slope quality depends on the template size. The elevation error is reduced by 1 m and the slope error by 5 degrees for the second profile by changing this parameter. Moreover, its influence is higher on slope than on the elevation. Thus, the choice of this parameter is of great importance and it constitutes one of many other production parameters that can influence the produced DEM. A large template size tends to smooth the terrain (Lane et al., 2000). In this study, 13×13 and 17×17 templates, which are considered as large, gave the most precise slopes for the two tested profiles. This is because the two profiles were smooth and did not present many changes. Thus, the choice of this parameter is related to the smoothness of the terrain. Indeed, if the terrain is smooth the template has to be large and if the terrain is rough levelling points used for the assessment of the elevation quality were measured referring to the Lebanese geoid. The SPOT DEM elevations have the international geoid as reference so we used an average value to change the elevation reference. As the difference between the two geoids is not constant, this introduces random errors in the estimations. The RMS of this difference is about 0.4 m. However, this affects the elevation more than the slope because the geoid slope is weak. Moreover, the elevation values of the profiles are interpolated using a spline for the multi-scale comparison of slopes. This interpolation can have a smoothing effect on the results specifically on short distances. Furthermore, the extraction algorithm of the stream networks also has an impact on the results. Finally, these results derive from one single dataset, which is characterized by its acquisition parameters and could therefore change for another dataset.
The method used for the detection of sinks along the river can be utilized for the quality assessment of DEM without external data. It is considered to be what we call ‘internal validation’. The purpose of this validation is to verify if the shapes in the DEM are possible or not. Obtaining validation data for the
quality assessment of the shapes is often difficult. Therefore, in our further research we will develop the internal validation of the DEM shapes based on landform properties.
REFERENCES
References from Journals:
Gaucherel, C., Salomon, L. and Labonne, J., 2011. Variable self-similar sinuosity properties within simulated river networks. Earth Surface Processes and Landforms, 26, 1313– 1320.
Cuartero, A., Felicisimo, A. M. and Ariza, F.J., 2005. Accuracy, reliability, and depuration of SPOT HRV and Terra ASTER digital elevation models. IEEE Transactions on Geoscience and Remote Sensing, 43 (2), 404–407.
Hebeler F. and Purves R., 2009. The influence of elevation uncertainty on derivation of topographic indices. Geomorphology, 111(1–2), 4–16.
Holmes, K.W., Chadwick, O.A. and Kyriakidis, P.C., 2000. Error in a USGS 30-meter digital elevation model and its impact on terrain modeling. Journal of Hydrology, 233, 154– 173.
Hunter, G.J. and Goodchild, M.F., 1997. Modelling the uncertainty of slope and aspect estimates derived from spatial databases. Geographical Analysis, 29 (1), 35–49.
Lane, S.N., James, T.D. and Cowell, M.S., 2000. Application of digital photogrammetry to complex topography for geomorphological research. Photogrammetric Record, 16 (95), 793–821.
Oksanen, J. and Sarjakoski, T., 2005. Error propagation of DEM-based surface derivatives. Computers & Geosciences, 31, 1015–1027.
Shary, P.A., Sharaya, L.S. and Mitusov, A.V., 2002. Fundamental quantitative methods of land surface analysis. Geoderma, 107, 1–32.
Shary, P.A., Sharaya, L.S. and Mitusov, A.V., 2005. The problem of scalespecific and scale-free approaches in geomorphometry. Geografia Fisica e Dinamica Quaternaria, 28, 81–101.
Schneider, B., 2001. On the uncertainty of local form of lines and surfaces. Cartography and Geographic Information Science, 28 (4), 237–247.
Toutin, T, 2002. Impact of terrain slope and aspect on radargrammetric DEM accuracy. ISPRS Journal of Photogrammetry and Remote Sensing, 57(3), 228-240.
Wise, S.M., 2000. Assessing the quality for hydrological applications of digital elevation models derived from contours. Hydrological Processes, 14 (11–12), 1909–1929.
References from Books:
Evans, I.S., Hengl, T. and Gorsevski, P., 2008. Applications in Geomorphology. In: T. Hengl and H.I. Reuter, ed. Geomorphometry: Concepts, Software, Applications, Developments in Soil Science, vol. 33, Elsevier, 497–525.
Hengl, T. and Evans, I.S., 2008. Mathematical and digital models of the land surface. In: T. Hengl and H.I. Reuter, ed. Geomorphometry: Concepts, Software, Applications, Developments in Soil Science, vol. 33, Elsevier, 31–63.
Heuvelink, G.B.M., 1998. Error Propagation in Environmental Modelling with GIS. Taylor & Francis, London, UK.
Heuvelink G. B. M., 2002. Analysing Uncertainty Propagation in GIS: Why is it not that simple? In: G.M. Foody and P.M. Atkinson, ed. Uncertainty in Remote Sensing and GIS. John Wiley & Sons, West Sussex, England, 155–165.
Li, Z., Q. Zhu and C. Gold, 2005. Accuracy of digital terrain models. In: Digital Terrain Modeling Principles and Methodology. CRC Press, New York, 158–190.
MacMillan, R.A. and Shary, P.A., 2008. Landforms and Landform Elements in Geomorphometry. In: T. Hengl and H.I. Reuter, ed. Geomorphometry: Concepts, Software, Applications, Developments in Soil Science, vol. 33, Elsevier, 227–254.
Pike, R.J., Evans, I. and Hengl, T., 2008. Geomorphometry: A Brief Guide. In: T. Hengl and H.I. Reuter, ed. Geomorphometry: Concepts, Software, Applications, Developments in Soil Science, vol. 33, Elsevier, 3–33.
Rasemann, S., Schmidt, J., Schrott, L. and Dikau, R., 2004. Geomorphometry in mountain terrain. In: M.P. Bishop and J.F. Shroder, ed. GIS & Mountain Geomorphology. Springer, Berlin, 101–145.
Reuter, H.I., Hengl, T., Gessler, P. and Soille, P., 2008. Preparation of DEMs for Geomorphometric Analysis. In: T. Hengl and H.I. Reuter, ed. Geomorphometry: Concepts, Software, Applications, Developments in Soil Science, vol. 33, Elsevier, 87–120.
Shary, P.A., 2008. Models of topography. In: Q. Zhou, B. Lees and G.A. Tang, ed. Advances in Digital Terrain Analysis, Lecture Notes in Geoinformation and Cartography. Berlin, Springer, 29–57.
Temme, A., Heuvelink, G., Schoorl, J. and Claessens, L., 2008. Geostatistical simulation and error propagation in geomorphometry. In: T. Hengl and H.I. Reuter, ed. Geomorphometry: Concepts, Software, Applications, Developments in Soil Science, vol. 33, Elsevier, 121–140.
References from Other Literature:
El Hage, M., Simonetto, E., Faour, G. and Polidori, L., 2010. Impact of DEM reconstruction parameters on topographic indices. The International Archives of the Photogrammetry, Remote Sensing and Spatial Information Sciences, Paris, France, vol. XXXVIII, part 3B, 40–44.
Takagi, M., Asano, H. and Kikuchi, Y. 2002. Optimum Spatial Resolution of Digital Elevation Model for Topographical Analysis. The International Archives of the Photogrammetry, Remote Sensing and Spatial Information Sciences, Canada, vol XXXIV, part 4B, 442–446.
References from websites:
Beyer, H., 2009. Hawth’s Analysis Tools for ArcGIS.
http://www.spatialecology.com/htools/index.php.