Active brain area identification using EEG-NIRS
signal acquisition
M. Jawad Khan
2and Keum-Shik Hong*
,1,2 1Department of Cogno-Mechatronics Engineering, 2School of Mechanical Engineering, Pusan National University; 2 Busandaehak-ro, Geumjeong-gu, Busan 609-735, Korea
{jawad, kshong }@pusan.ac.kr * Corresponding author
Abstract— In this paper, we have investigated the electroencephalography (EEG) and near-infrared spectroscopy (NIRS) correlates to identify the stimulated brain region for brain-computer interface (BCI). The brain activity of four subjects is recorded using simultaneous acquisition of EEG and NIRS data for a finger tapping motor task. The active brain region is investigated using the brain maps from EEG electrodes data. The NIRS optodes are placed around the active brain region to obtain the hemodynamic correlates of oxyhemoglobin (HbO) and deoxy hemoglobin (HbR). Spatial average of the HbO and HbR is taken using the combination of channels to identify active regions related to motor activity. The results show that NIRS correlates can identify an active brain region more precisely that can be for BCI.
Keywords— electroencephelography; near-infrared spectroscopy; motor cortex; active brain region.
I. INTRODUCTION
Brain area identification for brain-computer interface (BCI) is a key research area in the recent decade [1-4]. In the early works, the electrodes were directly implanted into the specific brain region to acquire the brain activity [5-7]. Currently, the non-invasive brain imaging modalities of electroencephalography (EEG), functional magnetic resonance imaging (fMRI), near-infrared spectroscopy (NIRS), and magnetoencephalography (MEG) are used in the research to investigate the active brain regions of interest for BCI [7].
EEG, in this context is most widely used for BCI applications. It has the advantage of having high temporal resolution, portability and low cost [8-11]. However, EEG lacks the spatial resolution for specific brain area identification [12, 13]. The EEG contains high signal to noise ratio, making it difficult to identify the active brain region for BCI [14]. Thus, due to this problem the reliability of correct activity detection decreases with the increase in recording time in EEG signals. This also results in the detection of a false signal from the active brain regions, reducing the reliability of the BCI [15].
Near-infrared spectroscopy (NIRS) on the other hand, has a better spatial resolution than EEG [1]. It is also safe in use and the equipment is portable making it suitable for BCI [2]. It uses near-infrared light (NIR) between 600~1000 nm range to measure the hemodynamic changes in the form for oxygenated hemoglobin (HbO) and deoxygenated hemoglobin (HbR).
These changes are measured from the cortical brain regions by detecting the absorption of NIR light and are associated to brain activity [6]. Though NIRS has a better spatial resolution, it has a low temporal resolution in comparison to EEG. The previous researches have shown that the active brain region can be identified by taking spatial averages of all the channels in NIRS data [16-20]. Binary decision decoding [21] and the classification of left and right wrist imagery signals with high accuracy has been achieved using this method [22]. The spatial averaging strategy has also been reported in multi-wavelength equipment for BCI [23]. Apart from spatial averaging, Kalman filter estimation [24] and linear time varying model [25] are used to identify the region of interest in the brain. Another research using independent component analysis has also shown the possibility of targeted brain region identification by using independent components of different channels [26].
Currently, a hybrid modality is developed using EEG and NIRS that can decode and classify the brain activity simultaneously [27-29]. These researches have shown that EEG and NIRS combined can increase the number of control commands and the classification accuracy for BCI [27, 28]. This has led towards the detection of an optimal time window for BCI in NIRS signals [29].
In this paper, we have detected a specific brain region using EEG and NIRS for finger tapping task for BCI. The active brain regions are identified using EEG brain mapping and a specific region is selected based on ΔHbO and ΔHbR signals using NIRS data. The ΔHbO and ΔHbR are acquired by taking the spatial average of different channels to identify the targeted brain region. Support vector machines (SVM) is used to classify the data. The results show that the average classification accuracy increases by an average of 7.5% by using the spatial averages in specific channels in NIRS data.
II. MATERIALS AND METHODS
A. Subjects
Four subjects (age: 23-32 years; all males) participated in the experiment. All subjects were right-handed. None of the subjects have any history of neurological and physiological disorder. A written consent was taken before the start of the experiment. The experiment was conducted under the latest declaration of Hensinki.
2015 International Conference on Automation, Cognitive Science, Optics, Micro Electro-Mechanical System, and Information Technology (ICACOMIT), Bandung, Indonesia, October 29–30, 2015
Fig. 1. Experimental pradigm used for the acquisition of brain activity.
B. Experimental paradigm
The subjects were seated on a comfortable chair in front of a monitor placed at a distance of approximately 70 cm. The experimental procedure consists of finger tapping task. The total duration of the experiment is 5 minutes. The experiment started with a 20 second resting period followed by a finger tapping of 10 seconds. Each activity session was followed by a 20 second resting session. A total of 10 trials are performed for each subject. The experimental procedure used in the experiment is shown in Fig. 1.
C. Optode placement
Fourteen EEG electrodes were placed on the AF3, AF4, F3, F4, F7, F8, FC5, FC6, T7, T8, P7, P8, O1 and O2 brain location. The NIRS signals were acquired using six sources and six detectors combination, which formed a combinational pair of 17 channels. The NIRS source-detector combination was placed on the left primary motor cortex. The NIRS optodes were adjusted around the EEG electrodes for simultaneous signal acquisition. Fig. 2 shows the position of electrodes and optodes for EEG and NIRS.
D. Signal acquisition and processing
The EEG data was recorded using Emotive EEG headset (Emotive epoch, US) at a sampling rate of 128 Hz. The α- and
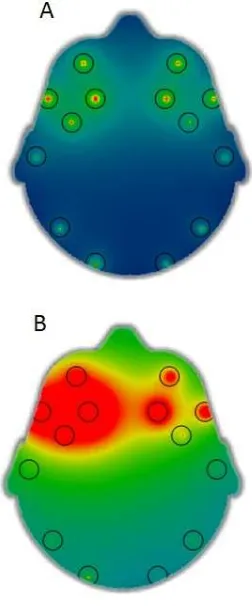
β-bands were acquired by band-pass filtering. The signals were processed in 8~30 Hz range using +1 sec to +11 sec onset stimulus. The brain activity map for β-band is shown in Fig 3.
A 760 nm and 830 nm wavelength NIRS-System (DYNOT, NIRx medical technologies, USA) was used in the experiment. The Modified Beer-Lambert law was used to obtain the chromophores of ΔHbO and ΔHbR [30-34]:
d l t A
t A
t c
t c
1
) λ , (
) λ , ( ) (λ )
(λ
) (λ )
(λ
) (
) (
2 1 1
2 HbR 2 HbO
1 HbR 1 HbO
HbR HbO
, (1)
where ΔA(t; λj) (j =1,2) is the unit-less absorbance (optical density) variation of the light emitter of wavelength λj,
αHbX(λj) is the extinction coefficient of HbX in µM -1
mm-1, d is
Fig. 2. Electrode and optode locations for EEG and NIRS
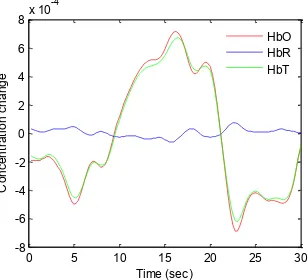
the unit-less differential path length factor (DPF), and l is the distance (in millimeters) between emitter and detector. The NIRS signals were acquired at a sampling rate of 1.81 Hz. The signals acquired were therefore low-pass filtered with a cut-off frequency of 0.5 Hz to remove the noises. In order to investigate the changes corresponding to the finger tapping task, the spatial average is taken to find the most suited brain region of activation for classification. The HbO and HbR average is given in Fig. 4.
0 5 10 15 20 25 30 -8
-6 -4 -2 0 2 4 6 8x 10
-4
Time (sec)
C
o
n
ce
n
tr
a
ti
o
n
ch
a
n
g
e
HbO HbR HbT
Fig. 4. NIRS signal after taking spatial average of channel 1,2,4 and 6 for Subject 2.
E. Classification
Normalization is performed after the spatial averaging by dividing the signals with the baseline value. The signals after normalization and filtering are then classified using linear support vector machine (SVM). SVM is chosen as a classifier due to its suitability and ease of use. Also, it has shown significant results in BCI applications [12]. This algorithm uses hyperplanes to introduce a regularization parameter that can remove the classification errors on the training set. The resulting classifier can accommodate outliers and obtain better generalization capabilities. As outliers are common in fNIRS data, this regularized version of SVM may give better results for BCI than the non-regularized version.
The linear decision boundary (separating hyperplane) for both SVM was obtained using the data from the training vector. The remaining results then verified using the testing vector. After that data is divided into “rest” or “finger
tapping” classes and classification is performed by projecting the test samples, acquired after each experimental trial, on the hyperplane.
The classification is performed using the signal mean of the values of the change in concentration of HbO and HbR. As there were ten finger tapping trials, the feature vector hence consisted of ten 2-dimensional data points for each subject.
Ten-fold cross validation, that mixes data into ten segments, one of which is used for testing and the nine are used for training, is performed to estimate the classification accuracies. The accuracies are shown in Table 1.
III. RESULTS AND DISCUSSION
The brain map in Fig. 3 is generated using t-values. The figure shows activation around AF3, AF4, F3, F4, F7 and F8
Table 1 Accuracies after classification using SVM
Subject
All channels accuracy (%)
Selected channels
Selected channels accuracy (%)
1 70 2,3,5 80
2 85 1,2,4,6 90
3 80 3,4,6,7 90
4 80 8,10 85
Mean 78.8±6.2 86.3±4.8
regions when the stimuli are given. The issue in this case is that the region of interest is not clearly defined. It cannot be deduced that a specific region get activated when the subject perform the activity. To identify a specific region in brain, we have placed the NIRS optodes around the most activated brain regions detected by EEG (see Fig. 2). Our objective is to investigate if some specific channels in NIRS gets activated when stimuli was given. The signal processing results showed that there were no specific channels that get activated when the subject taps the finger. To narrow down our approach for the channels, we took the spatial average of the channels with highest values of concentration changes in HbO for each subject. The average over the selected channels shows an increase in the classification accuracy. An average 7.5% increase in the accuracy was observed for each subject. The activity map for NIRS over the selected channels is shown in Fig. 5.
It has been observed that EEG response appears faster than NIRS. The neuronal response is detected after +1 sec of the stimulation. The hemodynamic response appears in +2 sec to +15 sec of the stimulation period (see Fig. 4). It was observed that the activated channels for NIRS were different for each subject. Also, the activity in each trial varied in each trial. Therefore, the spatial average was taken to get a consistent activity. These results are consistent with the previous literature on NIRS [34]. Also, the classification using SVM in selected channels showed higher accuracy than the average of all channels. This is due to the reason that the selected channels showed higher concentration changes, thus they contributed significantly in classification results.
Fig. 5. Selected NIRS channel activation during rest and finger tapping task.
IV. CONCLUSIONS
This study demonstrated the initial investigation of active brain area detection using EEG and NIRS. EEG was used to detect the active brain regions and NIRS was used to identify precise location of the channels for activity selection. The classification of the selected NIRS channels showed an overall increase of accuracy for a finger tapping task.
ACKNOWLEDGMENT
This work was supported by the National Research Foundation of Korea under the Ministry of Science, ICT and Future Planning, Korea (grant no. NRF-2014 -R1A2A1A10049727).
REFERENCES
[1] N. Naseer and K.-S. Hong, “fNIRS-based brain-computer interfaces: a review,” Frontiers in Human Neuroscience, vol. 9, no. 3, pp. 1-15, 2015.
[2] F. Matthews, B. A. Pearlmutter, T. E. Ward, C. Soraghan, and C. Markham, “Hemodynamics for brain computer interfaces,” IEEE Signal Processing Magazine, vol. 25, no. 1, pp. 87-94, 2008.
[3] N. Naseer and K.-S. Hong, “Decoding answers to four-choice questions using functional near-infrared spectroscopy,” Journal of Near Infrared Spectroscopy, vol. 23, no.1, pp. 23-31, 2015.
[4] N. Birbaumer, “Breaking the silence: Brain–computer interfaces (BCI) for communication and motor control,” Psychophysiology, vol. 43, no. 6, pp. 517–532, 2006.
[5] K.-S. Hong, N. Naseer, and Y.-H. Kim, “Classification of prefrontal and motor cortex signals for three-class fNIRS-BCI,” Neuroscience Letters, vol. 587, pp. 87-92, 2015.
[6] N. Naseer, K.-S. Hong, M. R. Bhutta, and M. J. Khan, “Improving classification accuracy of covert yes/no response decoding using support vector machines: an fNIRS study,” Proceedings of the IEEE International Conference on Robotics and Emerging Allied Technologies in Engineering (iCREATE), Islamabad, Pakistan, pp. 6-9, April 22-24, 2014.
[7] B. K. Min, M. J. Marzelli, and S-S. Yoo, “Neuro-Imaging based approaches in brain computer interface,” Trends in BioTechnology, vol. 28, no. 11, pp. 552-560, 2010.
[8] A. Turnip and K.-S. Hong, “Classifying mental activites from EEG -P300 signals using adaptive neural network,” International Journal of Innovative Computing, Infromation and Control, vol. 8, no. 9, pp. 6429-6443, 2012.
[9] A. Turnip, K.-S. Hong, and M.-Y. Jeong, “Real-time feature extraction of EEG-based P300 using adaptive nonlinear principal component analysis,” Biomedical Engineering Online, vol. 10, no. 83, pp. 1-20, 2011.
[10] T. Ball, M. Kern, I. Mutschler, A. Aertsen, and Schulze-Bonhage,“Signal quality of simultaneously recorded invasive and non -invasive EEG,” Neuroimage, vol. 46, no. 3, pp. 708-716, 2009.
[11] A. Bashashati, M. Fatourechi, R. K. Ward, and G. E. Birch, “A survey of signal processing algorithms in brain-computer interfaces based on electrical brain signals,” Journal of Neural Engineering, vol. 4, no. 2, pp. R32–R57, 2007.
[12] F. Lotte, M. Congedo, A. L´ecuyer, F. Lamarche, and B. Arnaldi, “A review of classification algorithms for EEG-based brain–computer interfaces,” Journal of Neural Engineering, vol. 4, no. 2, pp. R1–R13, 2007.
[13] N. J. Hill, T. N. Lal, M. Schr, T. Hinterberger, G. Widman, C. E. Elger, B. Sch, and N. Birbaumer, “Classifying event-related desynchronization in EEG, ECoG and MEG signals,” Lecture Notes on Computer Science, vol. 4174, pp. 404–413, 2006.
[14] M. J. Khan, K.-S. Hong, N. Naseer, and M. R. Bhutta, “A hybrid EEG -fNIRS BCI: motor imagery for EEG and mental arithmetic for -fNIRS,” Proceedings of the 14th IEEE International Conference on Control and Automation Systems (ICCAS), Seoul, Korea, pp. 275-278, October 2014.
[15] G. Pfurtscheller, B. Z. Allison, C. Brunner, G. Bauernfeind, T. Solis- Escalante, R. Scherer, T. O. Zander, G. Mueller-Putz, C. Neuper, and N. Birbaumer, “The hybrid BCI,” Frontiers in Neuroscience, vol. 4, no. 30, pp. 1-11, 2010.
[16] S. Luu and T. Chau, “Decoding subjective preferences from single-trial near-infrared spectroscopy signals,” Journal of Neural Engineering, vol. 6, no. 1, pp. 1-8, 2009.
[17] K.-S. Hong and H.-D. Nguyen, “State-space models of impulse hemodynamic responses over motor, somatosensory, and visual cortices,” Biomedical Optics Express, vol. 5, no. 6, pp. 1778-1798, 2014.
[18] M. R. Bhutta, K.-S. Hong, N. Naseer, and M. J. Khan, “Water correction algorithm to improve the classification accuracy: A near-infrared spectroscopy study,” Proceedings of the IEEE International Conference on Robotics and Emerging Allied Technologies in Engineering (iCREATE), Islamabad, Pakistan, pp. 91-94, April 22-24, 2014. [19] H. Santosa, M. J. Hong, and K.-S. Hong, “Lateralization of music
processing with noises in the auditory cortex: an fNIRS study,” Frontiers in Human Neuroscience, vol. 8, 418, pp. 1-9, 2014.
[20] M. J. Khan, K.-S. Hong, M. R. Bhutta, and N. Naseer, “fNIRS based dual movement control command generation using prefrontal activity,” Proceedings of the IEEE International Conference on Robotics and Emerging Allied Technologies in Engineering (iCREATE), Islamabad, Pakistan, pp. 244-248, April 2014.
[21] N. Naseer, M. J. Hong, and K.-S. Hong, “Online binary decision decoding using functional near-infrared spectroscopy for development of brain-computer interface,” Experimental Brain Research, vol. 232, no. 2, pp. 555-564, 2014.
[22] N. Naseer and K.-S. Hong, “Classification of functional near-infrared spectroscopy signals corresponding to right- and left-wrist motor imagery for development of a brain-computer interface,” Neuroscience Letters, vol. 553, pp. 84-89, 2013.
[23] M. R. Bhutta, K.-S. Hong, B.-M. Kim, M. J. Hong, Y.-H. Kim, and S.-H. Lee, “Note: Three wavelengths near-infrared spectroscopy system for compensating the light absorbance by water,” Review of Scientific Instruments, vol. 85, no. 2, 026111, 2014.
[24] X.-S. Hu, K.-S. Hong, S. S. Ge, and M.-Y. Jeong, “Kalman estimator- and general linear model-based on-line brain activation mapping by near-infrared spectroscopy,” Biomedical Engineering Online, vol. 9, no. 82, 2010.
[25] M. A. Kamran, and K.-S. Hong, “Linear parameter varying model and adaptive filtering technique for detecting neuronal activities: an fNIRS study,” Journal of Neural Engineering, vol. 10, no. 5, pp. 1-13, 2013. [26] H. Santosa, M. J. Hong, S.-P. Kim and K.-S. Hong, “Noise reduction in
functional near-infrared spectroscopy signals by independent component analysis,” Review of Scientific Instruments, vol. 84, no. 7, 073106, 2013. [27] S. Fazli, J. Mehnert, J. Steinbrink, G. Curio, A. Villringer, K.-R. Müller, and B. Blankertz, “Enhanced performance by a hybrid NIRS-EEG brain computer interface,” Neuroimage, vol. 59, no. 1, pp. 512-529, 2012. [28] M. J. Khan, M. J. Hong, and K.-S. Hong, “Decoding of four movement
directions using hybrid NIRS-EEG brain-computer interface,” Frontiers in Human Neuroscience, vol. 8, no. 244, pp. 1-10, 2014.
Transactions on Biomedical Engineering, vol. 61, no. 4, pp. 1274-1284, 2014.
[30] X.-S. Hu, K.-S. Hong, and S. S. Ge, “fNIRS-based online deception decoding”, Journal of Neural Engineering, vol. 9, no. 2, 026012 (8pp), 2012.
[31] M. R. Bhutta, M. J. Hong, Y.-H. Kim, and K.-S. Hong, “Single-trial lie detection using a combined fNIRS-polygraph system”, Frontiers in Psychology, doi. 10.3389/fpsyg.2015.00709, 2015.
[32] X.-S. Hu, K.-S. Hong, and S. S. Ge, “Recognition of stimulus-evoked neuronal optical response by identifying chaos levels of near-infrared spectroscopy time series”, Neuroscience Letters, vol. 504, no. 2, pp. 115-120, 2011.
[33] M. A. Kamran, and K.-S. Hong, “Reduction of physiological effects in fNIRS waveforms for efficient brain-state decoding,” Neuroscience Letters, vol. 580, pp. 130-136, 2014.
[34] X.-S. Hu, K.-S. Hong, and S. S. Ge, “Reduction of trial-to-trial variations in functional near-infrared spectroscopy signals by accounting for resting-state functional connectivity,” Journal of Biomedical Optics, vol. 18, no. 1, 017003, 2013.
[35] T. Carlson and J. R. Millán, “Brain-controlled wheelchairs: A robotic architecture,” IEEE Robotics and Automation Magazine, vol. 20, no. 1, pp. 65-73, 2013.
[36] H.-J. Hwang, D. H. Kim, C.-H. Han, and C.-H. Im, “A new dual frequency stimulation method to increase the number of visual stimuli for multi-class SSVEP-based brain-computer interface (BCI),” Brain Research, vol. 1515, pp. 66-77, 2013.
[37] A. Zeeshan, N. Nauman, and M. J. Khan, “Design, control and implementation of a ball on plate balancing system,” Proceedings of 9th International Bhurban Conference on Applied Sciences and Technology (IEEE IBCAST), Islamabad, Pakistan, pp. 22-26, January 2012. [38] M. J. Khan, M. R. Afzal, N. Naseer, and Z. U. Koreshi, “Control system
design for a prosthetic leg using series damping actuator,” Proceeding of IEEE International Conference on Robotics and Artificial Intelligence (ICRAI), Islamabad, Pakistan, pp. 1-6, October 2012.
[39] U. H. Shah and K.-S. Hong, “Input shaping control of a nuclear power plant’s fuel transport system,” Nonlinear Dynamics, vol. 77, no. 4, pp. 1737-1748, 2014.
[40] A. K. Pamosoaji, P. T. Cat, and K.-S. Hong, ͆Sliding-mode and
proportional-derivative-type motion control with radial basis function
neural network based estimator for wheeled vehicles,͇ International
Journal of Systems Science, vol. 45, no. 12, pp. 2515-2528, 2014. [41] M. Rehan and K.-S. Hong, ͆Modeling and automatic feedback control
of tremor: adaptive estimation of deep brain stimulation,” PLoS One, vol. 8, no. 4, e62888, 2013.
[42] A. Widyotriatmo and K.-S. Hong, “A navigation function-based control of multiple wheeled vehicles,” IEEE Transactions on Industrial Electronics, vol. 58, no. 5, pp. 1896-1906, 2011.
[43] K.-S. Hong, H. C. Sohn, and J. K. Hedrick, “Modified skyhook control of semi-active suspensions: A new model, gain scheduling, and hardware-in-the-loop tuning,” ASME Transactions, Journal of Dynamic Systems, Measurement, and Control, vol. 124, no. 1, pp. 158-167, 2002. [44] K.-S. Hong and J. Bentsman, "Direct adaptive control of parabolic
systems: Algorithm synthesis, and convergence and stability analysis," IEEE Transactions on Automatic Control, vol. 39, no. 10, pp. 2018-2033, 1994.
[45] K.-S. Hong, K. H. Choi, J. G. Kim, and S. Lee, “A PC-based open robot control system: PC-ORC,” Robotics and Computer-Integrated Manufacturing, vol. 17, no. 4, pp. 355-365, 2001.
[46] K.-J. Yang, K.-S. Hong, and F. Matsuno, “Robust adaptive boundary control of an axially moving string under a spatiotemporally varying tension,” Journal of Sound and Vibration, vol. 273, no. 4-5, pp. 1007-1029, 2004.
[47] H. Park, D. Chwa, and K.-S. Hong, "A feedback linearization control of container cranes: Varying rope length," International Journal of Control, Automation, and Systems, vol. 5, no. 4, pp. 379-387, 2007. [48] Y.-S. Kim, K.-S. Hong, and S.-K. Sul., “Anti-sway control of container
cranes: Inclinometer, observer, and state feedback,” International Journal of Control, Automation, and Systems, vol. 2, no. 4, pp. 435-449, 2004.
[49] Q. H. Ngo and K.-S. Hong, “Adaptive sliding mode control of container cranes,” IET Control Theory and Applications, vol. 6, no. 5, pp. 662-668, 2012.
[50] W. He, S. S. Ge, B. V. E. How, Y. S. Choo, and K.-S. Hong, “Robust adaptive boundary control of a flexible marine riser with vessel dynamics,” Automatica, vol. 47, no. 4, pp. 722-732, 2011.