Fast optical signals during median nerve stimulation
by using continuous-wave NIRS
Hendrik Santosa
1, Theodore J. Huppert
2,3, and Keum-Shik Hong
*,1,4 1Department of Cogno-Mechatronics Engineering, Pusan National University, Busan 609-735, Korea 2
Department of Radiology, University of Pittsburgh, 4200 Fifth Avenue, Pittsburgh, PA 15260, USA 3
Department of Bioengineering, University of Pittsburgh, 4200 Fifth Avenue, Pittsburgh, PA 15260, USA 4
School of Mechanical Engineering, Pusan National University, Busan 609-735, Korea E-mail: [email protected], [email protected], [email protected]
*Corresponding author
Abstract—the purpose of the present study was to investigate the reliability of fast optical signal (FOS) using near-infrared spectroscopy (NIRS). In this study, we presented a preliminary study in the detection of FOS from 10 subjects during electrical median nerve stimulation. We used high sampling frequency using continuous-wave NIRS to detect the FOS related to the neural activity. Furthermore, the FOS has been found with latency between 100 ms to 200 ms after stimulus.
Keywords—fast optical signal; near-infrared spectroscopy; high sampling rate; neural activity.
I. INTRODUCTION
In the past 20 years, near-infrared spectroscopy (NIRS), as non-invasive technique, has been shown to be potent tools for measuring neuronal activities evoked by the hemodynamic response in human brain [1]. Typically, at least two wavelengths are used in the near-infrared region between 650 to 1000 nm [2-4]. There are several advantages of NIRS compared with other neuroimaging techniques, for example electroencephalogram (EEG) and functional magnetic resonance imaging (fMRI). First, NIRS has a good trade-off between spatial and temporal resolutions as compared with EEG and fMRI [5]. Second, NIRS offers highly portable and inexpensive. Finally, it has the ability to detect two different signals from human brain: the hemodynamic response (slow signal) and neuronal signal response (fast signal) [6].
The first signal, hemodynamic response, consists of oxy-hemoglobin (HbO) and deoxy-oxy-hemoglobin (HbR). The changes between incident and detected lights are causing the changes HbO and HbR which is calculated using modified Beer-Lambert law [7-9] and Boltzmann’s transport equation [10] for continuous-wave-(CW) and frequency-domain-(FD) type, respectively. The typical hemodynamic response leads to an increase in HbO and a decrease in HbR caused by brain consumes more oxygen in the activated area. The hemodynamic changes measured by NIRS (i.e., HbR) have been shown to highly correlate (R = 0.71) with the blood oxygenation level dependent (BOLD) in fMRI signal in the channel space [11]. Because of this reliability, it has been measured in different areas of the human brain, such as prefrontal cortex [12-14], motor cortex [15, 16], motor imagery [17], somatosensory cortex [18], auditory cortex [19], and visual cortex [18].
The second signal is the fast changes in the optical properties of cerebral tissue, often called fast optical signal (FOS) or event-related optical signal (EROS). These changes are apparently due to the scattering properties of neuronal membranes [20, 21]. The latency of about 50-150 ms [22, 23] are much faster than the hemodynamic response about 2-5 s [24]. Thus, the FOS is directly related to neuronal activity, as in EEG [25]. Therefore, the detection of FOS is more difficult than the hemodynamic response because the time scale and the signal-to-noise ratio (SNR) is much smaller in FOS [23, 26]. In FD-NIRS, the phase signals are more sensitive and less affected by the movement and heart beat artifacts than the intensity signals [27]. Also, the SNR of the phase signals is smaller than in the intensity signal for FD-NIRS [28] Meanwhile, comparing between the wavelengths has been found that: (i) The higher sensitivity of longer wavelength light of FOS to neural activity [29]; (ii) The FOS signals from 830 nm are less absorbed by the tissue, confirming less random variety of measurements [30]. The depth of near-infrared light penetration is about half of the emitter-detector distance which is the best distance for measurement the FOS is exceeding 22.5 mm [31].
The aim of this study is to investigate the reliability of FOS evoked electrical median nerve stimulation. Beforehand, we defined a priori of ROI from statistical analysis in all subjects. Three major parts of our processing: (i) Pre-processing to get optical density, HbO, and HbR after filtering the data; (ii) Statistical analysis of all data, that is the group statistic to define the ROI; (iii) Average the FOS from both wavelengths in ROI. In result, we succeed to show the FOS in order of milliseconds.
II. MATERIALS AND METHODS
A. Subjects
Ten subjects (age: 23-57 years; 4 males and 6 females, none having a history of any neurological disorder) participated in the experiment. During the experiment, the subjects were asked to lying down on a chair. A total of 9 subjects participated for 4 runs and 1 subject participated in 2 sessions (with 4 runs for each session). A total of 48 runs was performed from all subjects. All of the subjects had provided written consent.
2015 International Conference on Automation, Cognitive Science, Optics, Micro Electro-Mechanical System, and Information Technology (ICACOMIT), Bandung, Indonesia, October 29–30, 2015
B. Stimuli
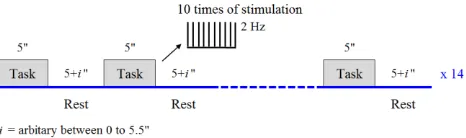
Throughout the experiment, all subjects performed the electrical median nerve stimulation on the right wrist of the hand using GRASS S88X stimulator (Natus Neurology Inc, Warwick RI USA). The voltages were adjusted for every subject above the motor threshold when the thumb is twitching in visible contraction. To provide variability, the rest period was presented in a pseudo-random order. The experiment paradigm consisted of a 5-s task period (2 Hz pulses) followed by a random (5- to 10.5-s) rest period, and was repeated 14 times as shown in Fig. 1. Accordingly, the total experiment was about 180-s for every run. The experimental paradigm was design in Eprime-2 (Psychology Software Tools; Pittsburgh PA USA) to control the GRASS device and give the stimulus marker in the CW6. It will provide information in the precise time for stimulus marker which is important in this study to investigate the FOS.
C. NIRS acquisition
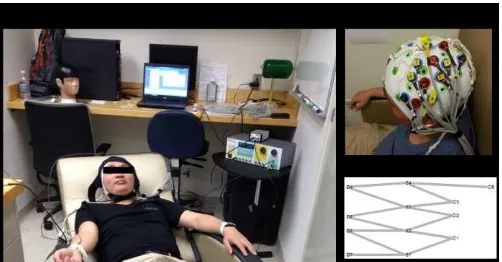
The CW-NIRS-type (CW6; TechEn, Milford MA) is used, as detailed in previous work. We used 4 sources and 8 detectors in EEG cap to avoid motion artifacts during subject movement as shown in Fig. 2. The data were acquired at a sampling rate of 20 Hz and for two wavelengths (690 nm and 830 nm). Consequently, a total of 14-channel is used to cover somatosensory and motor cortex in the left hemisphere. The distance between source and detector is variation between 21.54 to 46.32 mm due to the limitation of EEG cap, as shown in Table 1.
In CW-NIRS, the concentration changes of HbO and HbR are computed using the modified Beer-Lambert law:
,
,
,
ln
,
HbR HbR
HbO HbO
0
i i
i i i i
dl
t
c
a
t
c
a
t
U
t
U
t
(1)
where iis the channel index, is the wavelength of the laser sources,
,t is the optical density at time t, U0
,t and
tU , are the photon at the source and detector positions,
respectively,
a
HbO anda
HbR are the extinction coefficientsof HbO and HbR, respectively,
c
HbO and
c
HbR are theconcentration changes of HbO and HbR in μM, respectively, d is the differential path length factor, and l is the distance between the source and the detector.
D. Processing
[image:2.595.318.551.54.123.2]We processed the optical raw data off-line in Matlab (Mathworks, Sherborn, MA). There are several noises in NIRS measurements: instrumental noise, experimental errors, and systemic physiological artifacts [32, 33]. The processing, notably, used a pre-processing of high-pass filter with a cut-off frequency of 1 Hz in order to remove physiological noises (e.g., respiration: ~0.2-0.3 Hz; cardiac: ~1 Hz). We carefully analyze the data from every trial and every channel in all subjects. We used the statistical analysis to analyze between t- and p-value.
Fig. 1. Experimental design for electrical median nerve stimulation.
Table 1 Channel configuration of the distance between source and detector.
Channel Source Detector Distance (mm)
1 1 1 33.60
2 1 6 46.32
3 1 7 25.00
4 2 1 23.32
5 2 2 32.02
6 2 5 33.97
7 2 6 25.00
8 3 2 24.41
9 3 3 21.54
10 3 4 40.61
11 3 5 29.68
12 4 3 36.89
13 4 4 25.96
14 4 8 35.69
Detailed description of statistical analysis provided in the next section. Furthermore, we used the region of interest (ROI) where defined from significant activation in activation map average from all subjects. Finally, we average the FOS from all subjects in particular channels of ROI.
E. Statistical analysis
The estimation of the cortical activation is the most important factor in the data processing of fNIRS signals. Previous studies showed that the activation could be statistically estimated by fitting the fNIRS signals (measured data) by using regression model of predicted response. In this study, we used robust regression to estimate that coefficient available in Matlab as robustfit function.
Fig. 2. Experimental setup: (a) Photograph of experiment during electrical median nerve stimulation; (b) Photograph of the EEG-cap; (c) Schematic
drawing of the probe geometry.
III. RESULTS
[image:3.595.305.559.52.166.2]Channels covering and surrounding source 3 and detectors 2-5 which indicate significant activation were defined as a-priori ROI. Activation maps for HbO and HbR are shown in Fig. 3. As shown in the figure, color and line will presented in different color, that is, 0 < t i < tcrt, t i > tcrt, -tcrt < t i < 0, and t i < -tcrt, for red dotted-line, red solid-line, blue dotted-line, and blue solid-line. We defined the ROI because the particular area was increased and decrease for HbO and HbR, respectively, evoked by electrical median nerve stimulation. In details, the t-values were (S3-D2 = 2.67, S3-D3 = 2.39, S3-D4 = 0.64, D5 = 1.27) and (D2 = -1.56, D3 = -0.31, S3-D4 = -0.63, S3-D5 = -1.55) for HbO and HbR, respectively. As we can see that the t-values of HbO and HbR from source 3 are positive and negative, respectively, means that the hemodynamic responses agree with the hypothesis. The hypothesis for fNIRS signals are HbO and HbR are increasing and decreasing, respectively, evoked by some particular stimuli. It is noted that the tcrt depends on the degree of freedom (i.e., 200) and the level of the probability for rejecting the null hypothesis (i.e., 0.05).
The comparison of time series between task and resting are shown in Fig. 4. This figure is the average response from 26,880 data (i.e., 48 runs from 10 subjects, 14 trials, 10 times of stimulation, and 4 channels from ROI). We showed the response for two wavelengths in upper- and lower-figure for 690 nm and 830 nm. The blue solid-line represent the activation period during electrical median nerve stimulation and black dotted-line for resting state. In 830 nm data, it clearly shows no effect during the rest period (dotted), whereas during stimulation (solid) a significant decrease at about 100 ms can be seen and following back to the baseline about 200 ms. This study produced results which corroborate the findings of a great deal of the previous work in this field. Also, we can see the response of the 830 nm data shows the better response of the decreasing the intensity evoked by electrical median stimuation. These results are consistent with the previous work that show the higher sensitivity of longer wavelength light for fast optical signal to neuronal activity.
Fig. 3. Left hemisphere activation evoked by electrical median nerve stimulation for HbO and HbR.
Fig. 4. Time series of average intensity during electrical median nerve stimulation from all subjects in ROI.
IV. CONCLUSIONS
Our results demonstrate the reliability of fast optical signals during electrical median nerve stimulation in the particular channel. Compared to the hemodynamic response, fast optical signals are much faster response evoked by neural activity in about 100-200 ms. In our next study, we will try to detect the fast signals in on-line processing for a brain-computer interface system.
Acknowledgment
This work was supported by the National Research Foundation of Korea under the Ministry of Education, Science and Technology, Korea (grant no. NRF-2014-R1A2A1A10049727). We are also thankful to multimodal neuroimaging training program (MNTP) 2015 for providing opportunities in the multimodal modality workshop, particularly fNIRS modality instructed by Dr. Theodore Huppert as well as the staff and students from Dr. Huppert’s lab at University of Pittsburgh for their intensive support throughout the entire data collection.
References
[1] D.A. Boas, C.E. Elwell, M. Ferrari, and G, Taga, “Twenty years of
functional near-infrared spectroscopy: Introduction for the special
issue,” NeuroImage, vol. 85, pp. 1-5, 2014.
[2] M.R. Bhutta, K.-S. Hong, B.M. Kim, M.J. Hong, Y.H. Kim, and S.H.
[image:3.595.327.540.201.316.2]compensating the light absorbance by water,” Review of Scientific
Instruments, vol. 85, an. 026111, 2014.
[3] N. Naseer and K.-S. Hong, “fNIRS-based brain-computer interfaces: A
review,” Frontiers in Human Neuroscience, vol. 9, an. 3, 2015.
[4] N. Naseer, M.J. Hong, and K.-S. Hong, “Online binary decision decoding using functional near-infrared spectroscopy for the development of brain-computer interface,” Experimental Brain Research, vol. 232, pp. 555-561, 2014.
[5] X.-S. Hu, K.-S. Hong, and S.S. Ge, “Reduction of trial-to-trial variability in functional near-infrared spectroscopy signals by accounting for resting-state functional connectivity,” Journal of Biomedical Optics, vol. 18, an. 017003, 2013.
[6] X.-S. Hu, K.-S. Hong, and S.S. Ge, “Recognition of stimulus-evoked neuronal optical response by identifying chaos levels of near-infrared
spectroscopy time series,” Neuroscience Letters, vol. 504, pp. 115-120,
2011.
[7] M.A. Kamran and K.-S. Hong, “Linear parameter-varying model and adaptive filtering technique for detecting neuronal activities: An fNIRS
study,” Journal of Neural Engineering, vol. 10, an. 056002, 2013.
[8] X.-S. Hu, K.-S. Hong, S.S. Ge, and M.Y. Jeong, “Kalman estimator- and general linear model-based on-line brain activation mapping by
near-infrared spectroscopy,” Biomedical Engineering Online, vol. 9, an. 82,
2010.
[9] K.-S. Hong, N. Naseer, and Y.H. Kim, “Classification of prefrontal and motor cortex signals for three-class fNIRS-BCI,” Neuroscience Letters, vol. 587, pp. 87-92, 2015.
[10] S. Fantini, D. Hueber, M.A. Franceschini, E. Gratton, W. Rosenfeld,
P.G. Stubblefield, et al., “Non-invasive optical monitoring of the
newborn piglet brain using continuous-wave and frequency-domain
spectroscopy,” Physics in Medicine and Biology, vol. 44, pp.
1543-1563, 1999.
[11] T.J. Huppert, R.D. Hoge, A.M. Dale, M.A. Franceschini, and D.A. Boas,
“Quantitative spatial comparison of diffuse optical imaging with blood oxygen level-dependent and arterial spin labeling-based functional
magnetic resonance imaging,” Journal of Biomedical Optics, vol. 11, an.
064018, 2006.
[12] X.-S. Hu, K.-S. Hong, and S.S. Ge, “fNIRS-based online deception
decoding,” Journal of Neural Engineering, vol. 9, an. 026012, 2012.
[13] M.R. Bhutta, M.J. Hong, Y.H. Kim, and K.-S. Hong, “Single-trial lie detection using a combined fNIRS-polygraph system,” Frontiers in Psychology, vol. 6, 2015.
[14] T.J. Huppert, B. Schmidt, N. Beluk, J. Furman, and P. Sparto,
“Measurement of brain activation during an upright stepping reaction task using functional near-infrared spectroscopy,” Human Brain Mapping, vol. 34, pp. 2817-2828, 2013.
[15] M.A. Kamran and K.-S. Hong, “Reduction of physiological effects in fNIRS waveforms for efficient brain-state decoding,” Neuroscience Letters, vol. 580, pp. 130-136, 2014.
[16] M.J. Khan, M.J. Hong, and K.-S. Hong, “Decoding of four movement directions using hybrid NIRS-EEG brain-computer interface,” Frontiers in Human Neuroscience, vol. 8, an. 244, 2014.
[17] N. Naseer and K.-S. Hong, “Classification of functional near-infrared spectroscopy signals corresponding to the right- and left-wrist motor
imagery for development of a brain-computer interface,” Neuroscience Letters, vol. 553, pp. 84-89, 2013.
[18] K.-S. Hong and H.-D. Nguyen, “State-space models of impulse hemodynamic responses over motor, somatosensory, and visual
cortices,” Biomedical Optics Express, vol. 5, pp. 1778-1789, 2014.
[19] H. Santosa, M.J. Hong, and K.-S. Hong, “Lateralization of music
processing auditory cortex: An fNIRS study,” Frontiers in Behavioral
Neuroscience, vol. 8, an. 418, 2014.
[20] G. Gratton, P.M. Corballis, E.H. Cho, M. Fabiani, and D.C. Hood,
“Shades of gray-matter - noninvasive optical-images of human brain responses during visual-stimulation,” Psychophysiology vol. 32, pp. 505-509, 1995.
[21] G. Gratton and M. Fabiani, “The event-related optical signal: A new tool
for studying brain function,” International Journal of Psychophysiology,
vol. 2, pp. 109-121, 2001.
[22] M.A. Franceschini and D.A. Boas, “Noninvasive measurement of neuronal activity with near-infrared optical imaging,” NeuroImage, vol. 21, pp. 372-386, 2004.
[23] J. Steinbrink, M. Kohl, H. Obrig, G. Curio, F. Syre, F. Thomas, et al.,
“Somatosensory evoked fast optical intensity changes detected
non-invasively in the adult human head,” Neuroscience Letters, vol. 291, pp.
105-108, 2000.
[24] G.K. Aguirre, E. Zarahn, and M. D'Esposito, “The variability of human,
BOLD hemodynamic responses,” NeuroImage, vol. 8, pp. 360-369,
1998.
[25] A.V. Medvedev, J.M. Kainerstorfer, S.V. Borisov, A.H. Gandjbakche, and J. VanMeter, "Seeing" electroencephalogram through the skull: Imaging prefrontal cortex with fast optical signal,” Journal of Biomedical Optics, vol. 15, an. 061702, 2010.
[26] A.M. Chiarelli, A. Di Vacri, G.L. Romani, and A. Merla, “Fast optical signal in visual cortex: Improving detection by general linear convolution model,” NeuroImage, vol. 66, pp. 194-202, 2013.
[27] G. Gratton and M. Fabiani, “The event-related optical signal (EROS) in visual cortex: Replicability, consistency, localization, and resolution,” Psychophysiology, vol. 40, pp. 561-571,2003.
[28] M. Wolf, U. Wolf, J.H. Choi, R. Gupta, L.P. Safonova, L.A. Paunescu, et al., “Functional frequency-domain near-infrared spectroscopy detects fast neuronal signal in the motor cortex,” NeuroImage, vol. 17, pp. 1868-1875, 2002.
[29] J. Lee and S.J. Kim, “Spectrum measurement of fast optical signal of neural activity in brain tissue and its theoretical origin,” NeuroImage, vol. 51, pp. 713-722, 2010.
[30] G. Gratton and M. Fabiani, “Fast optical imaging of human brain
function,” Frontiers in Human Neuroscience, vol. 4, an. 52, 2010.
[31] G. Gratton, C.R. Brumback, B.A. Gordon, M.A. Pearson, K.A. Low, and M. Fabiani, “Effects of measurement method, wavelength, and source-detector distance on the fast optical signal,” NeuroImage, vol. 32, pp. 1576-1590, 2006.
[32] T.J. Huppert, S.G. Diamond, M.A. Franceschini, D.A. Boas, “HomER: A review of time-series analysis methods for near-infrared spectroscopy
of the brain,” Applied Optics, vol. 48, D280-D298, 2009.
[33] H. Santosa, M.J. Hong, S.P. Kim, and K.-S. Hong, “Noise reduction in functional near-infrared spectroscopy signals by independent component