47
In this chapter, the writer presents the data which had been collected
from the research. The important point of this chapter is to answer the problems of
the study. Based on the problems of the study, the study aimed at describing the
students‟ ability in reading and comprehending recount text at eight grade of MTS
Islamiyah Palangka Raya.
A. Data Finding
1. The description of the Eight Grade Students’ Ability in Reading and Comprehending Recount Text at MTS Islamiyah Palangka Raya
In order to see the students‟ ability in reading and comprehending recount
text, the writer assigned the students to do test that about reading and
comprehending recount text. The number of students was 25 students consisting
12 female and 13 male. The results of the students‟ reading and comprehending
recount text were taken on Tuesday, November 26, 2013 at 07:00 am class VIII C.
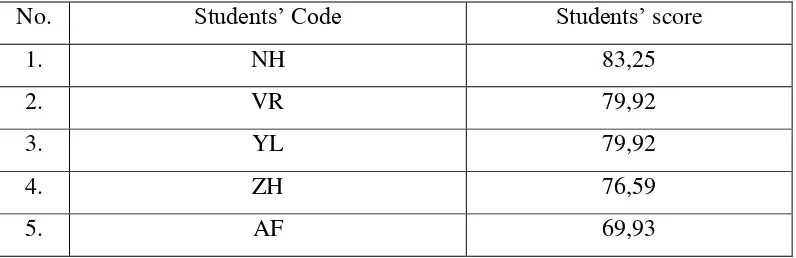
Table 4.1
The Description of Reading and Comprehending Recount Text of the Data Achieved by the Students of MTs Islamiyah Palangka Raya
No. Students‟ Code Students‟ score
1. NH 83,25
2. VR 79,92
3. YL 79,92
4. ZH 76,59
6. AR 69,93
7. AM 69,93
8. MT 69,93
9. RH 69,93
10. RF 69,93
11. SA 69,93
12. WH 69,93
13. MRN 69,93
14. PN 59,94
15. PP 59,94
16. ST 59,94
17. YNA 59,94
18. AL 59,94
19. JNA 49,95
20. MR 49,95
21. RM 49,95
22. NW 49,95
23. AH 39,96
24. NA 39,96
25. NO 39,96
Based on the data above, it can be seen that the students‟ highest score was
83, 25 and the students‟ lowest score was 39, 96. The data showed the percent of
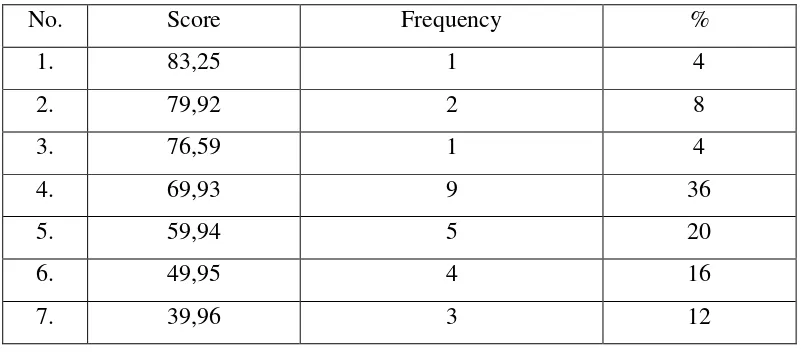
Table 4.2
Percentages of Students’ Score in Reading and Comprehending
Recount Text
No. Score Frequency %
1. 83,25 1 4
2. 79,92 2 8
3. 76,59 1 4
4. 69,93 9 36
5. 59,94 5 20
6. 49,95 4 16
7. 39,96 3 12
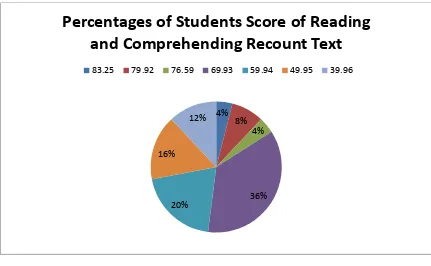
The students‟ score in reading and comprehending recount text we could
see in a chart. The data showed the percentage of students score in reading and
Figure 4.1 Percentages of Students Score of Reading and Comprehending Recount Text
The next step, the writer calculates the value of mean, median and modus
as follows:
a. Mean
Mx = N X
= 1568, 43 25 = 62, 74
b. Median
N = 2n + 1
Where median is placed in the number of (n+1) from the data
25 = 2(n) + 1
-2n = 1 – 25
4% 8%
4%
36% 20%
16% 12%
Percentages of Students Score of Reading
and Comprehending Recount Text
-2n = -24
n = -24 -2
= 12
Median is placed in the 12th from the score. So the median value was 70.
The calculation above was showed the mean value: 62, 74, median value:
69, 93 and modus value: 69, 93. The writer also calculated the data calculation of
reading and comprehending recount text score using SPSS 18.0 program. The
result statistic table is as follows:
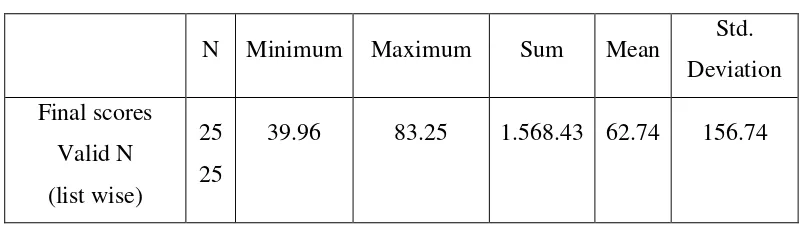
Table 4.3
The table of Mean, Standard Deviation of Reading and Comprehending Recount Text of the Data Achieved by the Students in MTs Islamiyah
Palangka Raya
N Minimum Maximum Sum Mean Std. Deviation
Final scores
Valid N (list wise)
25 25
39.96 83.25 1.568.43 62.74 156.74
The table showed the result of mean calculation was 62.74. The result of
standard deviation was 157.74.
The types of comprehension depend on the level in which the
comprehension process takes place. Regarding the process of reading
interpretive/inferential, critical, and creative comprehension.1 Based on the
students ability in the lesson by the teacher and the syllabus that focused in literal
and inferential question the result table was as follow:
refers to ….
a. The writer b. The writer‟s
friend c. The tourists d. The tourist‟s
sister
3. Where the writer met the tourist? a. In a zoo in
Bukit Tunggal b. In a zoo in
Bukit Batu c. In a zoo in
Bukit Pinang d. In a zoo in
Bukit Tinggi
Literal d. In a zoo in Bukit Tinggi
Line 3 22 students (88%)
4. Which of the statement is NOT TRUE based on the text?
a. The writer not have
conversation chat with foreigners b. The writer
visited a zoo in Bukit Tinggi c. The writer met
Literal a.The writer not have conversatio n chat with
foreigners
tourist
of her
mother‟s
favorites b. Because the
glass was one of her sister is favorites c. Because the
glass was broken
d. Because the
glass extensive 8. She played with
her doll and
straightly ……
(paragraph 5)
The word “She” refers to….
a. The writer b. The writer‟s
sister
c. The writer‟s brother
d. The writer‟s mother
Inferential b.The
writer‟s
sister
Paragraph 5 line 2
14 students (56%)
9. “It was my fault” The underlined
word means …..
a.Error b.Terror
Inferential a.Error Paragraph 6 line 2
c.Fear writer meet his/her father?
writer‟s father
Literal d.Because he/she forgot
Paragraph 2 line 3
scold the writer? a. Because he/she
woke up late b. Because he/she
skipped school c. Because he/she
didn‟t do
his/her homework d. Because he/she
forgot to bring his/her father before the class began
town
d.In a downtown
17. How old was the man finally do? a.He drove his truck away
d.He took the
a. 3 hours
Beach” (paragraph 2 line 2)
What does the
word „it‟ refers to? a. The tour b. The holiday c. The vacation
d. The adventure
26. Who lives in comfortable on the train?
writer‟s elder
feel about his/her trip?
a. The writer felt tired
b. The writer felt happy
c. The writer felt sad
d. The writer felt confuse
felt tired 2 (68%)
30. Which of the following
statements is NOT TRUE?
a. The writer‟s sister was waiting for the
writer in Gubeng station b. The writer took
a taxi to reach
her sister‟s
boarding house c. The writer
went to
Surabaya with his/her mother d. The writer felt
tired after the trip
Literal b. the writer took a taxi to reach her
sister‟s
boarding house
paragraph 3
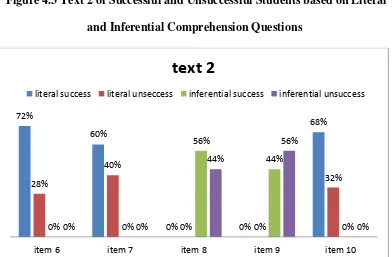
The distribution of Successful and Unsuccessful Students based on
Literal and Inferential Comprehension Questions can also be seen in the following
figures:
Figure 4.2 Text 1 of Successful and Unsuccessful Students based on Literal and Inferential Comprehension Questions
Figure 4.3 Text 2 of Successful and Unsuccessful Students based on Literal and Inferential Comprehension Questions
72%
literal success literal unsuccess Inferential success Inferential unsuccess
72%
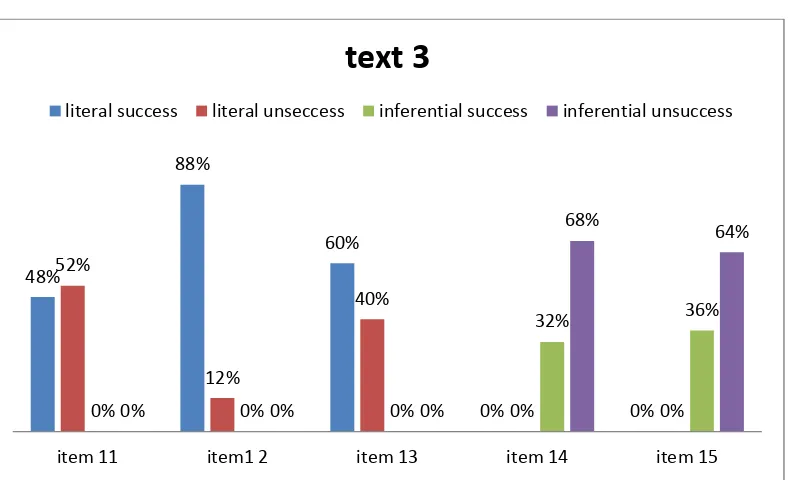
Figure 4.4 Text 3 of Successful and Unsuccessful Students based on Literal and Inferential Comprehension Questions
Figure 4.5 Text 4 of Successful and Unsuccessful Students based on Literal and Inferential Comprehension Questions
48%
88%
60%
0% 0%
52%
12%
40%
0% 0%
0% 0% 0%
32% 36%
0% 0% 0%
68%
64%
item 11 item1 2 item 13 item 14 item 15
text 3
literal success literal unseccess inferential success inferential unsuccess
76%
68%
0% 0%
84%
24%
32%
0% 0%
16%
0% 0%
52%
60%
0%
0% 0%
48%
40%
0%
item 16 item 17 item 18 item 19 item 20
text 4
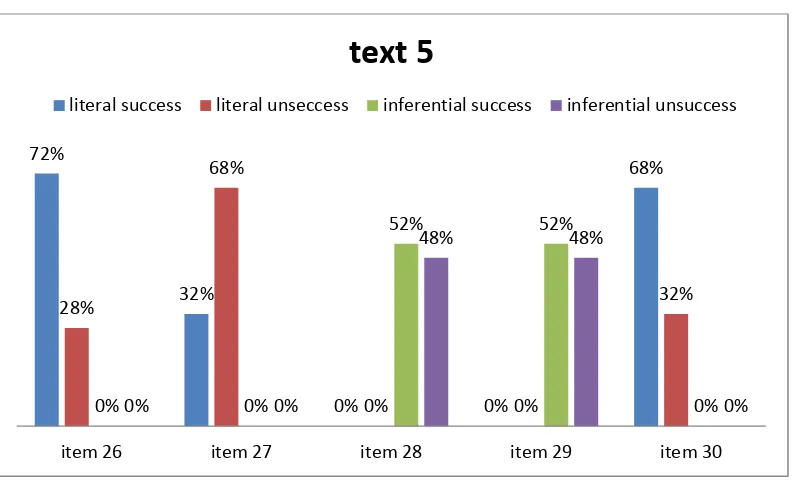
Figure 4.6 Text 5 of Successful and Unsuccessful Students based on Literal and Inferential Comprehension Questions
Figure 4.7 Text 6 of Successful and Unsuccessful Students based on Literal and Inferential Comprehension Questions
68%
64%
0% 0%
68%
32% 36%
0% 0%
32%
0% 0%
36%
80%
0%
0% 0%
64%
20%
0%
item 21 item 22 item 23 item 24 item 25
text 5
literal success literal unseccess inferential success inferential unsuccess
72%
32%
0% 0%
68%
28%
68%
0% 0%
32%
0% 0%
52% 52%
0%
0% 0%
48% 48%
0%
item 26 item 27 item 28 item 29 item 30
text 5
The figures showed the percentages of students highest score was literal
question and the percentages of students‟ lowest score was inferential question.
2. Result of Data Analysis of the Eight Grade Students’ Ability in Reading and Comprehending Recount Text at MTs Islamiyah Palangka Raya
Based on the data above, it can be seen the result of data analysis of the
students‟ ability in reading and comprehending recount text at MTs Islamiyah
Palangka Raya. The students‟ highest score was 83, 25 and the students‟ lowest
score was 39,96. To determine the range of score, the writer calculated using
formula mean, median, and modus. The first step, the writer calculated the class
interval and interval of temporary, the result of calculation of mean value of the
students reading and comprehending recount text is 62,74, median value of the
students reading and comprehending recount text is 69,93 and modus value of
reading and comprehending recount text is 69,93. Based on the standard minimum
completion criteria at MTs Islamiyah. The students could be „good‟ or not poor in
learning English especially in reading and comprehending recount text if they
were able get score > 65 it could be called good or very good, if they were able
get score < 65 it could be called poor or very poor. The writer took the score 65
as a minimum completion criteria because the existing standard minimum
completion criteria is 65 at the school. There were NH got score 83,25, VR got
score 69,93, YL got score 79,92, ZH got score 76,59, AF got score 69,93, AR got
score69,93, AM got score 69,93, MT got score 69,93, RH got score 69,93, RH
got score 69,93, RF got score 69,93, SA got score 69,93, WH got score 69,93,
59,94, YNA got score 59,94, AL got score 59,94, JNA got score 49,95 MR got
score 49,95 RM got score 49,95, NW got score 49,95, AH got score 39,96, NA
got score 39,96, and NO got score39,96. Consequently, based on the standard
minimum completion criteria there were three students who got very good scores
in reading and comprehending recount text, there were ten who got good scores in
reading and comprehending recount text, there were five students who got
medium scores in reading and comprehending recount text, and there were seven
students who got poor scores in reading and comprehending recount text. There
were one student got score 83,25 and the percentage was 4 %, two students got
score 79,92 and the percentage was 8%, one student got score 76,59 and the
percentage was 4 %, nine students got score 69,93 and the percentage was 36%,
five students got 59,94 and the percentage was 20%, four students got score 49,95
and the percentage was 16%, and last three students got score 39,96 and the
percentage was 12%, the total of percentage was 100%.
The result of data analysis showed 13 of 25 students (52%) got good
scores. While there were 5 of 25 students (20%) got medium scores and 7 of 25
students got poor scores.
B. Discussion
The result of the data analysis showed that the students‟ ability in reading
and comprehending recount text was successful. Based on the result of study there
were thirteen students got good scores, there were five students got medium
scores and the seven students got poor scores. According to Hornby
students to understand a language (Chapter 2:19). It is seen the many students got
good score than poor score.
According to Fauziati comprehension as comprehending a text, that is an
interactive process between the reader‟s background knowledge and the text
(Chapter 2:19). Based on the background knowledge and the text there were
thirteen students got good scores, there were five students got medium scores and
the seven students got poor scores. The writer provides the text that has not been
previously read to the students. Because of the reason above, there were students
got medium scores and got poor scores.
Reading and comprehending recount text is not easy but we can see if the
students had been their reading well. First, the reason was because in junior high
school they continued their learning about English especially about reading and
comprehending recount text from elementary school, so they more understood
about recount text.
Second, the English teacher has been giving the material about recount
text to the students and has been giving the explanation about it. Although the
teacher has to divide the time of learning because there were many lesson that has
to convey to the students.
Third, before the writer gave the test to the students, they have accepted
the material about reading and comprehending recount text. They also studied
about reading. The teacher asked them to reading and comprehending recount
text, so before they did my test they have been ever reading and comprehending