www.elsevier.com/locate/econedurev
Some new evidence of the character of competition among
higher education institutions
Robert F. Allen
*, Jianshou Shen
Department of Economics and Finance, Creighton University, 2500 California Plaza, Omaha, NE 68178, USA
Received 1 September 1997; accepted 15 October 1998
Abstract
This study employs a simple enrollment demand model to investigate the regional market environment of a private, church-related, comprehensive institution of higher education offering undergraduate, graduate and professional edu-cation. The focus is on price and cross-price elasticities of demand as measures of the competitive threat posed by prominent public and private educational alternatives within the region. We find a significant competitive threat coming from the private sector within the region. This competition raises the net price elasticity of demand for education at this institution to well above unity. We conclude that tuition price subsidies play a critical role in managing enrollment demand at this institution. [JEL J3, J24, J41]1999 Elsevier Science Ltd. All rights reserved.
Keywords: Competition; Demand; Elasticity; Higher education
1. Introduction
Extensive reviews of the empirical evidence of the demand for higher education by, for example, Leslie and Brinkman (1987); Becker (1990); McPherson and Shapiro (1991) show that a significant negative associ-ation exists between enrollments in higher educassoci-ation institutions and tuition price. This result is quite robust and can be found in national studies of the aggregate demand for education, in studies which treat private and public education as homogeneous aggregates and in studies which focus on specific, individual institutions.
Empirical evidence bearing on the character of compe-tition between institutions is more limited. Early studies by Hopkins (1974); McPherson (1978); Knudsen and Serville (1978) using data aggregated by type of
insti-* Corresponding author. Tel.:11-402-280-2442; fax:1 1-402-280-2172; e-mail: [email protected]
0272-7757/99/$ - see front matter1999 Elsevier Science Ltd. All rights reserved. PII: S 0 2 7 2 - 7 7 5 7 ( 9 9 ) 0 0 0 0 4 - 7
tution found little evidence of significant cross-price effects between higher education institutions.1
More recent studies conducted at the level of specific, individual institutions suggest that significant substi-tution relationships do exist among educational insti-tutions. Empirical evidence reported by Seneca and Taussig (1987) shows that institutional price differentials exert a small but empirically significant influence on enrollment probabilities at Rutgers University. Vaughan and Baxter (1988) discovered significant price compe-tition between a public four-year college (Weber State) and a state university (University of Utah). And Moore, Studenmund and Slobko (1991) report empirically sig-nificant, positive, cross-price elasticities between
dental College and the alternative colleges of financial aid recipients.
Clearly the character of competition among higher education institutions is complex and almost certainly institution specific. To obtain further insights into the nature of competitive relationships and the structure of higher education in general we need the repeated appli-cation of enrollment demand models to specific, individ-ual higher education institutions.2
This paper investigates the regional market environ-ment for a private, church-related, comprehensive insti-tution of higher education offering undergraduate, gradu-ate and professional education. Potential competitor institutions include a public, comprehensive university located within the same metropolitan area, a public, research, doctoral-granting university located within the same state, and a private, secular, comprehensive univer-sity located in a contiguous state. All are reputed to be significant higher education alternatives for students attending the private comprehensive university that is the focus of this study.3
Our empirical results corroborate several basic con-clusions cited in the empirical literature with regard to the major properties of enrollment demand. Most notably, we find a significant negative association between enrollment demand and either gross or net tui-tion prices, a positive income elasticity of demand con-firming that private education is a normal good, and an empirically significant enrollment response to the opport-unity cost of college attendance.
To these general findings we add two additional key results. First, we find the competitive threat for this priv-ate institution comes from the privpriv-ate sector, not the pub-lic sector. And second, we find that the presence of a significant competitor institution greatly magnifies the role of scholarships and grants in the enrollment decision. This is evidenced by a net price elasticity of demand of2 1.53, implying that tuition subsidies play a critical role in managing enrollment at this institution.
2. Model and data
The model employed originates from conventional demand theory. In its simplest form, the theory holds that enrollment (E) will be negatively associated with the tuition price charged students (P) and positively associa-ted with the real income of students (or their families)
2This is but one of the several useful directions for empirical research on the economics of higher education. Other sugges-tions are provided by Wetzel, O’Toole and Peterson (1998).
3The three potential competitor institutions are located within an area from which 55 percent of the undergraduate stu-dents are drawn.
(I) and the tuition price charged by competitor insti-tutions (Pc). To these basic economic influences we add
the unemployment rate (U) to control for the availability of education alternatives (Vaughan & Baxter, 1988).
The demand equation is estimated using annual data for the period 1959–1993. We employ the dummy vari-ables, D1 5 1965–1969, to control for the possible
influence of the Vietnam military build-ups (Lehr & Newton, 1978), and D251981–1983, to control for the
relatively pronounced recession in the early 1980s (Shim, 1990).
Formally our enrollment demand model is
E(t)5a1bP(t)1cI(t21)1dPc(t21) (1)
1eU(t21)1gD11kD21u
where t denotes the tth period and
P(t)5a9 1c9I(t21)1e9U(t21)1d9Pc(t (2)
21)1g9D11k9D21mC(t)1v
is the first stage of a two-stage least-squares estimation procedure.4
Total undergraduate enrollment is employed as the dependent variable. This measure allows for shifting enrollment mix and more complete institutional enrollment–price response estimates than would be obtained with alternative measures such as freshman head count or full-time equivalent undergraduate enrollment.
Price variables are proxied by annual real tuition for full-time undergraduate students. Both gross price (P) and net price (PNet) measures are employed. The latter
is calculated as the tuition price (P) minus the value of scholarships and grants per student (SCH).
Per capita real income, the unemployment rate and the tuition prices of potential competitors are lagged one per-iod on the presumption that individuals respond less than instantaneously to changes in these variables.5 Income
and the unemployment rate are for the state within which the institution is located.6
C(t) is an index of education costs measured by
aver-age annual real faculty salaries. Salaries are for all aca-demic ranks at private institutions nationwide as reported in Academe by the American Association of University Professors (various issues). Data on tuition prices and total undergraduate enrollments are obtained directly
4The supply of enrollment places is not perfectly elastic so we cannot rule out the likely correlation of P with u. Thus two-stage least-squares is an appropriate estimation method (Johnston, 1963).
5The use of lagged variables also moderates the multicollin-earity problem known to plague demand studies.
from official institutional records. Data on income and employment are from publications of the U.S. Depart-ments of Commerce and Labor, respectively.
The expected signs of the parameters are b,0 for a downward sloping demand curve, c > 0 for the increas-ing ability to finance education costs, d > 0 for substitute goods, e > 0 for the decreased availability of education alternatives, g > 0 for the draft deferment motive and
k > 0 for the impact of the recession.
Enrollment demand is estimated using a log-log relation.7 This specification has several desirable and
well-known properties. First, for any tuition level the enrollment predicted by the equation is positive. Second, the same proportional relationship between tuition and enrollment exists over the entire range of the demand curve. And third, the elasticity properties of enrollment demand are given by the estimated parameters of the demand equation.
3. Results
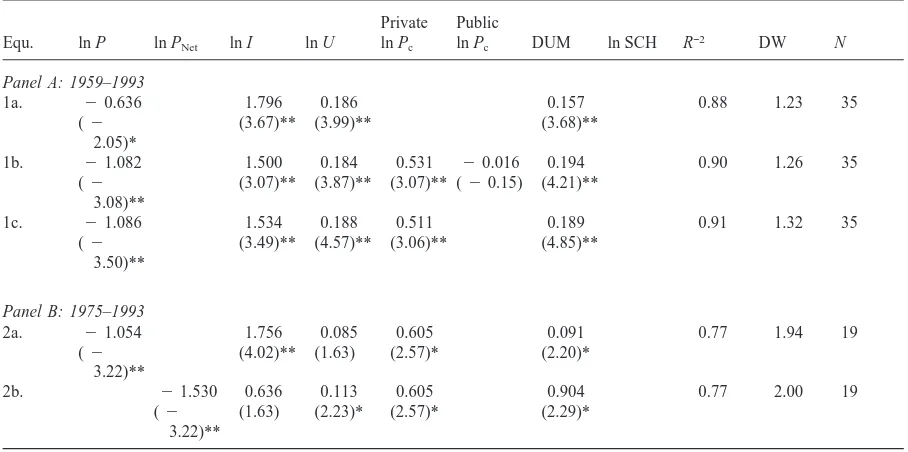
Regression results for the enrollment demand model are reported in Table 1. Coefficients of determination adjusted for degrees of freedom (R2), and the Durban–
Watson statistics (DW), are reported as tests of the func-tional form.
Basic results are reported for the period 1959–1993 in Panel A of Table 1. They are quite robust and provide additional evidence on some basic, enduring relation-ships in student demand studies. In addition, they offer some new evidence of the character of institutional com-petition for a private institution. Data on scholarships and grants were available for the period 1975–1993 only. Panel B of Table 1 shows results for this period and highlights the role of net tuition price in the enrollment demand model.
3.1. Results for period 1959–1993
The regression results reported in Panel A of Table 1 show, as expected, that enrollment demand is elastic with respect to the rate of unemployment (0.18) and the Viet-nam military expansion (0.19). The coefficients are simi-lar in magnitude to those reported by Lehr and Newton (1978) and suggest that rising unemployment reduces the opportunity cost of college and that the deferment motive can be a significant factor in college enrollments.
Empirical evidence of the character of competition in this environment is reported in equations 1b and 1c of Panel A. Equation 1b in particular shows that there is
7Other functional forms, such as a simple linear specifi-cation, were examined in preliminary work. The best results were obtained with the log-log specification.
no competitive threat from the public sector in this environment. The cross-elasticity coefficient between enrollments at this institution and the average tuition price of the public universities is of the wrong sign and insignificantly different from zero.8This result is
consist-ent with the low cross-elasticity reported by McPherson (1978) for private comprehensive institutions and by Knudsen and Serville (1978) for a cross-section of priv-ate liberal arts or teachers colleges.
The finding that there is little effective competition for students between this private institution and either of the public institutions is consistent with the large differences in tuition that exist between the private and public higher education institutions. The average difference grew from US$3435 in 1983 to US$5705 in 1993, in 1982 dollars. As McPherson (1978, pp. 187–190) noted some time ago and recent empirical work by Moore et al (1991) and Parker and Summers (1993) confirm, the ability to withstand competition from alternative institutions can depend on real qualitative differences between higher education institutions. Likely differences at work here pertain to institutional size, institutional identity and reputation, admissions selectivity, student mentoring by faculty, and the part of the family income distribution from which the student populations are drawn.
A significant substitute relationship does exist between this institution and an established, private, comprehen-sive universities in the region. The cross-elasticity coef-ficient of 0.51 (equation 1c) is statistically significant and of the right sign for a substitute good.9Further, as a
com-parison of equations 1a and 1c of Panel A shows, the presence of the competitor’s tuition price causes the absolute value of the own price elasticity to increase from 0.64 to 1.09, corroborating the substitute nature of the relationship (Walters, 1970, pp. 213–217).10
We also find a prominent role for income variation in our empirical results. The income elasticity coefficient is 1.5, confirming that private education is a normal good.
8The cross-elasticity estimates (t-ratios) between enrollments in this private institution and each of the public higher education tuition prices considered separately are20.85(20.70) for the public comprehensive university and 0.032(0.27) for the public research, doctoral granting university.
9To conserve on degrees of freedom, the variable for public institution prices is removed from further regressions.
Table 1
Regression analysis of enrollment demand for a private comprehensive university
Private Public
Equ. ln P ln PNet ln I ln U ln Pc ln Pc DUM ln SCH R−2 DW N
Panel A: 1959–1993
1a. 20.636 1.796 0.186 0.157 0.88 1.23 35
(2 (3.67)** (3.99)** (3.68)**
2.05)*
1b. 21.082 1.500 0.184 0.531 20.016 0.194 0.90 1.26 35
(2 (3.07)** (3.87)** (3.07)** (20.15) (4.21)** 3.08)**
1c. 21.086 1.534 0.188 0.511 0.189 0.91 1.32 35
(2 (3.49)** (4.57)** (3.06)** (4.85)**
3.50)**
Panel B: 1975–1993
2a. 21.054 1.756 0.085 0.605 0.091 0.77 1.94 19
(2 (4.02)** (1.63) (2.57)* (2.20)*
3.22)**
2b. 21.530 0.636 0.113 0.605 0.904 0.77 2.00 19
(2 (1.63) (2.23)* (2.57)* (2.29)*
3.22)**
()5t-statistic; **significant at 1 percent level; *significant at 5 percent level.
Note: Public ln Pcis the tuition price of the public higher education alternative. It is the average price of the two public institutions weighted by enrollments. Private ln Pcis the tuition price of the private higher education institution. DUM is the dummy variable and corresponds to D1in Panel A regression results and D2in Panel B regression results. D2was not significant in the regressions for the period 1959–1993.
Our income elasticity estimate is similar in magnitude to the 1.66 reported by Knudsen and Serville (1978) for private institutions with private competitors and some-what larger than the 1.10 reported by Hight (1975) for aggregate private enrollments. These private-sector income elasticity coefficients are considerably larger than the 0.30–0.70 elasticity coefficients reported for public-sector enrollments. Thus the near doubling of real per capita income from 1959 to 1993 favored significant enrollment growth at this, and other, private institutions. Gross tuition price is significantly negatively associa-ted with enrollments, a result that is widely reporassocia-ted in the literature. Enrollments at this institution are not, how-ever, price inelastic.11As shown in equation 1c of Panel
A, the coefficient of price elasticity is21.09. It does not differ significantly from unity, indicating that enrollment demand is unit elastic with respect to gross tuition price. A similar result is reported by Vaughan and Baxter (1988) for a state college with a public competitor.
11A price inelastic coefficient (20.64) is shown in equation 1a of Panel A of Table 1. However, as noted in the text, this estimate is biased downward due to the absence of control for substitute goods.
3.2. Results for period 1975–1993
Recent studies by Ehrenberg and Sherman (1984) Moore et al (1991), and Wetzel, O’Toole and Peterson (1998) provide evidence that enrollment decisions are sensitive to the availability of scholarships and grants as well as to tuition costs. They find no empirical evidence that enrollments are sensitive to other forms of financial aid such as loans.12
We explore the role of net, or discounted, tuition price (gross tuition price minus scholarships and grants) for this institution in Panel B of Table 1 for the period for which data on scholarships and grants are available.
For purposes of comparison with the larger sample period, regression results for the basic model employing gross tuition price are presented in equation 2a, Panel B of Table 1. These results are virtually identical to those reported in equation 1c of Panel A. They show that enrollment demand is unit elastic with respect to gross tuition price and positively influenced by income
ation, the tuition price of the competitor institution and high levels of unemployment.13
Equation 2b reports the results for the net price equ-ation.14Except for the role of income, the impact of the
non-price variables in the net price equation is similar to those obtained with gross tuition price equations. How-ever, we lose the influence of income in the net price equation. Our income elasticity coefficient is a positive 0.64, but it is not different from zero by the usual statisti-cal tests. A similar result is reported in other studies employing net price equations. Ehrenberg and Sherman (1984), for example, find a positive, but insignificant, income coefficient for Cornell and Moore et al (1991) report an insignificant, though negative, income coef-ficient in their net price equation for Occidental College. The elasticity of enrollments to net, or discounted, tui-tion price is21.53. This coefficient is statistically sig-nificantly above unity, indicating a high degree of stud-ent sensitivity to tuition costs net of scholarships and grants. This is perhaps the strongest evidence reported to date that tuition discounts do matter in the competition among institutions.
For this institution, the implication is that one can strongly adversely impact institutional income by raising the tuition price without an accompanying increase in scholarships and grants. Conversely, a vigorous develop-ment program to increase scholarship grants has the potential to positively impact student enrollments and raise institutional income significantly.
4. Conclusions
This study examines the regional market environment facing a private, comprehensive institution of higher edu-cation. Our methodology allows for the estimation of demand elasticities in a clear and unambiguous manner. Our findings are consistent with much that is generally known about the characteristics of enrollment demand in higher education. Enrollments are significantly nega-tively related to either gross or net tuition prices, private education is a normal good and there is an empirically significant enrollment response to the opportunity cost of college enrollment.
These propositions pertain to the signs of the
esti-13The pronounced recession of 1981–83 plays a significant role in the 1975–1993 regressions. However, in general, the influence of unemployment on enrollments, as captured by the ln U, does appear to have weakened during this period.
14Our specification implies that a dollar of aid is equivalent to a dollar of tuition. Sample size and high correlations among the grants variable and other regressors such as income(r5
0.91) and the tuition price of the private competitor (r50.97) prevent the identification of separate impacts for tuition and grants.
mated coefficients and merit considerable confidence. They are robust across different methodologies, different specifications of variables and different levels of data aggregation, as the empirical literature shows.
This paper offers new evidence of the character of competition among higher education institutions. We find no evidence that tuition policies at public institutions will adversely impact enrollments at this private insti-tution. Our estimated cross-price elasticity for public competitors is insignificant and of the wrong sign for substitute goods. As far as we know, there are no other published studies specific to an institution with which to compare this result. Similarly insignificant cross-price elasticities have, however, been reported by Knudsen and Serville (1978) for a national cross-section sample of moderately selective private institutions.
We do find a significant substitution relationship between this institution and another private, comprehen-sive institution within the region. The evidence is two-fold: first, there is a positive, empirically significant, cross-price elasticity coefficient; and second, the pres-ence of the competitor’s tuition prices causes the own price elasticity coefficient to increase, in absolute value, from 0.64 to 1.09. Thus, we conclude that competition among private institutions limits the revenue-generating ability of gross tuition price increases at this institution. Competition for students has led to significant tuition discounts in the form of scholarship grants at this insti-tution. The average tuition discount now approaches 40 percent of gross tuition and fees. The empirical impact of scholarship grants is reflected in our estimated net price elasticity of 2 1.53. Clearly, gross tuition price increases, unaccompanied by greater scholarship awards, significantly adversely impact enrollments at this insti-tution. This result points to significant pressures for this private institution to provide financial aid in the form of scholarship grants.
These results may not be transferable across insti-tutional types and/or geographical areas. The finding of a net price elasticity well above unity contrasts with net tuition price elasticities of21.09 reported for a private, research, doctoral-granting university in upstate New York and20.72 reported for a private liberal arts col-lege located in Southern California. The latter net tuition price elasticities do not suggest strong substitute relation-ships.15
As previously noted, institutionally based studies are few in number. There is a real need for further research focused on specific universities and colleges before we can usefully generalize about the magnitude of the
omic forces bearing on the character of competition among higher education institutions.
Acknowledgements
The authors wish to acknowledge the useful comments of an anonymous referee.
References
American Association of University Professors. The annual report on the economic status of the profession. Academe, various issues.
Becker, W.E. (1990). The demand for higher education. In: S.A. Hoenack & E.L. Collins (Eds.), The economics of American universities: Management, operations, and fiscal environ-ment (pp. 155–188). Albany, NY: State University of New York Press.
Ehrenberg, R.G., & Sherman, D.R. (1984). Optimal financial aid policies for a selective university. Journal of Human Resources, 19, 202–230.
Ghali, M., Miklius, W., & Wada, R. (1977). The demand for higher education facing an individual institution. Higher Education, 6, 130–134.
Hight, J.E. (1975). The demand for higher education in the U.S. 1927–72: the public and private institutions. Journal of Human Resources, 10, 512–520.
Hopkins, T.D. (1974). Higher education enrollment demand. Economic Inquiry, 12, 53–65.
Johnston, J. (1963). Econometric Methods. McGraw-Hill, New York.
Knudsen, O.K., & Serville, P. (1978). The demand for higher education at private institutions of moderate selectivity. American Economist, 22, 30–34.
Lehr, D.K., & Newton, J. (1978). Time series and cross-sec-tional investigations of the demand for higher education. Economic Inquiry, 16, 411–422.
Leslie, L.L., & Brinkman, P. (1987). Student price response in higher education. Journal of Higher Education, 58, 181– 204.
McPherson, M.S. (1978). The demand for higher education. In D.W. Breneman & C.E. Flinn Jr.(Eds.), Public policy and private higher education (pp. 143–196). Washington, DC: Brookings Institution.
McPherson, M.S., & Shapiro, M.O. (1991). Does student aid affect college enrollment? New evidence on a persistent controversy. American Economic Review, 81, 309–318. Moore, R.L., Studenmund, A.H., & Slobko, T. (1991). The
effect of the financial aid package on the choice of a selec-tive college. Economics of Education Review, 10, 311–321. Parker, J., & Summers, J. (1993). Tuition and enrollment yield at selective liberal arts colleges. Economics of Education Review, 12, 311–324.
Seneca, J.J., & Taussig, M.K. (1987). The effects of tuition and financial aid on the enrollment decision at a state university. Research in Higher Education, 26, 337–362.
Shim, K.R. (1990). A simple demand function for higher edu-cation. Atlantic Economics Journal, 18, 70.
Trauchar, W.F. (1969). Cross elasticities of collegiate demand. Review of Social Economy, 17, 222–232.
US Department of Commerce (various years). Survey of current business: April. Washington, DC: US Government Print-ing Office.
US Department of Labor (various years). Employment and earnings. Washington, DC: US Government Printing Office. Vaughan, M., & Baxter, S. (1988). Tuition, unemployment and the demand for education: a case study for classroom use. Journal of Economics, 19, 135–140.
Walters, A.A. (1970). An introduction to econometrics. New York: W.W. Norton.