www.elsevier.com/locate/econedurev
On the distributional impact of public education: evidence
from Greece
Panos Tsakloglou
a,*, Manos Antoninis
baAthens University of Economics and Business, 76 Patission Str., Athens 10434, Greece bSt. Anthony’s College, University of Oxford, Oxford OX2 6JF, UK
Received 1 January 1997; received in revised form 16 July 1998; accepted 1 September 1998
Abstract
Household budget survey data and public budget consolidated data for 1987/88 are combined to yield a non-esti-mation based measure of the benefit of public education outlays in Greece. As expected for a country where education services are provided free of charge and the role of private education is limited, transfers in the fields of primary and secondary education contribute strongly to a decline in inequality. The distributional impact of tertiary education sub-sidies is shown to be negligible, although indirect evidence suggests that this could well be regressive. [JEL I21, D31] 1999 Elsevier Science Ltd. All rights reserved.
Keywords: Public education and redistribution; Greece
1. Introduction
Questions related to the distributional impact of public education have been widely discussed in both developed and developing countries1. Until recently, the debate
concerning such issues in Greece was rather limited. In Greece education services are provided free of charge by the state at all levels (primary, secondary and tertiary), the role of private education is limited and so it has been widely assumed that education subsidies have a pro-gressively redistributive impact. However, a number of studies have shown that in Greece, as in many other countries, education is closely associated with inequality and that, ceteris paribus, the higher the educational level of the household head the higher the standard of living
* Corresponding author. Tel.:1301-8203195; fax:1 301-8214122; e-mail: [email protected]
1On distributional studies for developed countries see Smeeding, Saunders, Coder, Jenkins, Fritzell, Hagenaars et al. (1993) and references cited therein. With respect to developing countries see, for example, Meerman (1979); Jimenez (1986); Selden and Wasylenko (1995).
0272-7757/99/$ - see front matter1999 Elsevier Science Ltd. All rights reserved. PII: S 0 2 7 2 - 7 7 5 7 ( 9 9 ) 0 0 0 1 8 - 7
enjoyed by the household (Tsakloglou, 1992, 1993, 1997). Further, despite the free provision of education services, there is evidence of inter-generational trans-mission of educational inequalities (Papatheodorou, 1997). Therefore, the exact relationship between public education spending and income distribution needs further elucidation.
In the 1980s the Greek economy stagnated, large budget deficits were mounting and a number of stabilis-ation programs have been adopted to reverse the situ-ation. As usual in these cases, education is one of the first candidates for substantial spending cuts. Within this framework, issues related to the efficiency of the Greek education system have been raised. A consensus seems to emerge that major improvements are needed in order for the system to equip the new cohorts of the labour force with the qualifications required to achieve rapid economic growth rates. On the other hand, although no quantitative evidence is presented to support various conflicting assertions, questions have also been raised about the redistributive role of, at least, tertiary education (Psacharopoulos, 1988).
440 P. Tsakloglou, M. Antoninis / Economics of Education Review 18 (1999) 439–452
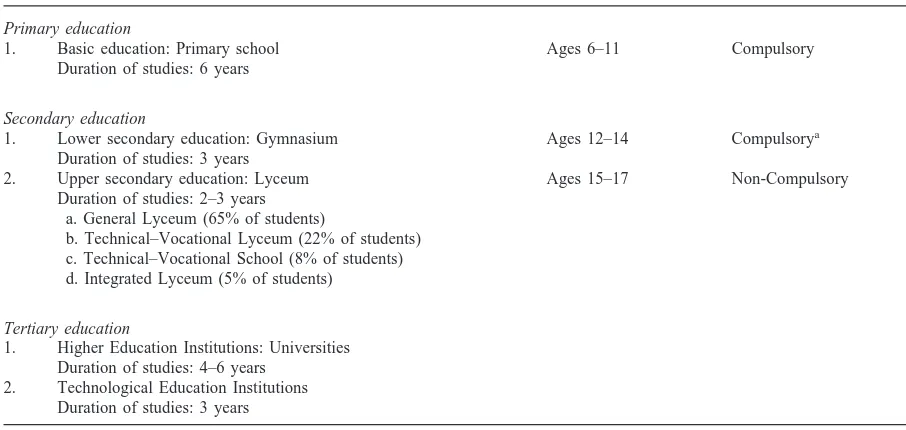
Table 1
The structure of the Greek education system
Primary education
1. Basic education: Primary school Ages 6–11 Compulsory
Duration of studies: 6 years
Secondary education
1. Lower secondary education: Gymnasium Ages 12–14 Compulsorya
Duration of studies: 3 years
2. Upper secondary education: Lyceum Ages 15–17 Non-Compulsory
Duration of studies: 2–3 years a. General Lyceum (65% of students)
b. Technical–Vocational Lyceum (22% of students) c. Technical–Vocational School (8% of students) d. Integrated Lyceum (5% of students)
Tertiary education
1. Higher Education Institutions: Universities Duration of studies: 4–6 years
2. Technological Education Institutions Duration of studies: 3 years
aDuring the period 1991–1994, the drop-out rate from lower secondary education was on average 8.9% (Paleokrassas, Vretakou & Rousseas, 1996).
of public education in Greece as well as estimates of this impact for each educational level separately, using the information of the 1987/88 Household Budget Survey. The remainder of the paper is organised as follows. The next section provides a short description of the structure of the Greek education system. Section 3 is concerned with methodological issues, while Section 4 presents the empirical results. Finally, Section 5 concludes the paper and discusses its possible policy implications.
2. Structure of the Greek education system
According to the Greek constitution, education is pro-vided free of charge at all levels. A limited number of private schools operate at the first two levels, whereby enrolment rates fluctuate around 6–7% for primary schools and 4–5% for secondary schools. At the tertiary level, in particular, degrees offered from private insti-tutions, which are treated as commercial enterprises rather than educational institutions, are not officially recognised as equivalent to those of public institutions. The structure of the Greek education system is summar-ised in Table 1.
Graduates of the General and Integrated Lyceums are eligible to take part in the general examinations to enter the Higher Education Institutions, which operate under a numerus clausus status. Graduates of all types of upper secondary schools apart from the technical–vocational schools may also enter the Technological Education Institutions, either by participating in the general
exam-inations or on the basis of their school certificate record. It is estimated that about one-third of the candidates suc-ceed in entering the 18 Universities and 12 Technologi-cal Education Institutions of Greece every year.
Private demand for higher education is strong. As a result of the households’ keen interest in the general examinations, a very large number of private, costly crammer schools assisting the candidates have sprouted, operating in parallel with the official education system but, in fact, substituting it in many respects. Moreover, the insufficient number of places in Greek higher edu-cation institutions and the underdevelopment of post-graduate studies leads a growing number of students to foreign universities, estimated at a staggering 20% of the domestic student population (compared to 1–5% for all other countries of the European Union). This high demand is recorded despite a growing rate of unemploy-ment of university graduates relative to the less well edu-cated (Kanellopoulos, 1996) and low estimated returns to university education (Psacharopoulos, 1982)2.
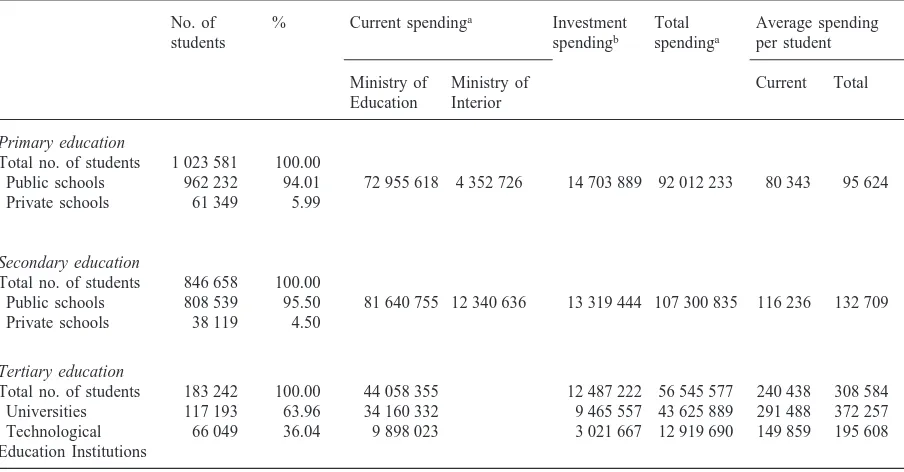
nar-Table 2
Cost structure of the Greek public education system, 1987–1988
No. of % Current spendinga Investment Total Average spending
students spendingb spendinga per student
Ministry of Ministry of Current Total
Education Interior
Primary education
Total no. of students 1 023 581 100.00
Public schools 962 232 94.01 72 955 618 4 352 726 14 703 889 92 012 233 80 343 95 624 Private schools 61 349 5.99
Secondary education
Total no. of students 846 658 100.00
Public schools 808 539 95.50 81 640 755 12 340 636 13 319 444 107 300 835 116 236 132 709 Private schools 38 119 4.50
Tertiary education
Total no. of students 183 242 100.00 44 058 355 12 487 222 56 545 577 240 438 308 584 Universities 117 193 63.96 34 160 332 9 465 557 43 625 889 291 488 372 257 Technological 66 049 36.04 9 898 023 3 021 667 12 919 690 149 859 195 608 Education Institutions
aIn thousands of current drachmas.
bAverage spending of the 10 preceding years in thousands of 1988 drachmas. Source: Ministry of Finance (1989).
Current public spending on education is managed by two ministries. The bulk (more than 90% of the total), which relates to the payment of teachers’ salaries, text-books, mess allowances and scholarships is channelled via the Ministry of Education. A small amount (less than 10% of the total) covering transport, schools’ mainte-nance and rent costs, is administered by the Ministry of Interior and the local authorities. Investment expenditure is managed through the Public Investment Budget and, as could be anticipated, exhibits a fluctuating pattern (Antoninis & Tsakloglou, 1997). For this reason, instead of current investment, in our analysis we use a moving average of the investment level of the 10 years preceding each particular year, thus implicitly assuming that capital investments in education depreciate constantly within a 10-year period.
Table 2 provides an overview of the Greek education system in 1987/88 in terms of numbers of students (both in public and private schools), total expenditure (distinguished between current and investment expenditure) stated in current 1988 thousand drachmas and average yearly cost per student attending a public school (in current 1988 drachmas) for each of the three
rowing of differentials between tertiary education graduates and the rest of the population; see, also, Lambropoulos and Psachar-opoulos (1992).
levels of the education system. The analysis of the distri-butional impact of public education spending is based on the information included in this table.
3. Data and methodology
442 P. Tsakloglou, M. Antoninis / Economics of Education Review 18 (1999) 439–452
expenditure data of the Household Budget Survey are considered as more reliable than the corresponding income data.
The concept of consumption expenditure used here includes, apart from the value of purchased goods and services, consumption of own production, consumption of income in kind and imputed rent for owner-occupied accommodation evaluated at market prices3. Several
adjustments were made to the data. A few households were removed from the sample on reliability grounds and the sample was re-weighted in order to reflect more accu-rately the entire population using Population Census weights. Further, all consumption expenditure values were expressed in constant mid-1988 prices in order to remove the impact of inflation (14.1% from the begin-ning to the end of the survey). Finally, the self-reported estimates of imputed rent for owner-occupied accommo-dation were replaced by estimates derived using hedonic regression techniques. Similarly, the value of cars pur-chased during the period of the survey was subtracted from the concept of consumption expenditure and replaced by the value of imputed car services, also esti-mated using hedonic regression techniques, for all the households which owned cars (for details, see Tsaklog-lou, 1996).
The unit of analysis in the main part of the paper is the household and the distributions used are distributions of equivalent consumption expenditure per household. The equivalence scales used are the so called “modified OECD scales” (Hagenaars, de Vos & Zaidi, 1994) which assign a weight of one to the household head, a weight of 0.5 to each of the remaining adults and a weight of 0.3 to each child (person aged up to 13) in the household. Division of the total expenditure of each household with its equivalence scale yields its equivalent consumption expenditure, which is used as an indicator of the house-hold’s welfare level.
Household Budget Surveys are probably the best sources of information for distributional studies in Greece but, nevertheless, they are far from ideal for the purposes of the present study. The following information from the survey can be used for the purposes of this paper. For each member in the sample aged 14 or more there is information on the highest level of education completed as well as on whether he/she is still a student. Therefore, it is easy to find out the level of education
3It can be argued that the concept of “consumption expendi-ture” used here is closer to the unobservable “welfare” than the concept of “monetary income” that is habitually used in distributional studies. Nevertheless, as in most distributional studies, due to lack of relevant information this concept does not include the value of goods and services provided by the state and, less controversially, the imputed value of leisure enjoyed by the economic agents.
attended by them. Although there is no explicit infor-mation on whether those who participate in the education system attend public or private schools, this information can be extracted implicitly, since the Household Budget Survey records information on expenditures for private education fees. Since we do not have any information for pre-school education, this level of the education sys-tem is left out of our analysis. For children aged up to 13 for whom we do not have information about their education status, we assume that if they are 6–11 years old they attend primary education and if they are 12–13 years old they attend secondary education. This assump-tion is not unrealistic since, according to the Labour Force Surveys, in the late 1980s only 0.6% of those aged 6–13 did not attend school at all (almost all of them non-educables) and a further 1.6% did not enrol to secondary education after completing primary education (Kanellopoulos, 1996).
Since the estimates in the Household Budget Survey are expressed in monthly figures, the cost estimates of Table 2 are adjusted accordingly. Hence, we assume that the monthly transfer from the state to each student in public primary education is 7969 drachmas, to each stud-ent in public secondary education 11 059 drachmas and to each tertiary education student 25 715 drachmas4.
Since the Household Budget Survey does not distinguish between University and Technological Education stu-dents of tertiary education, the average cost per student is estimated at the tertiary level as a whole, despite sig-nificant differences across institutions.
In line with the general approach of Aaron and McGuire (1970), in the first part of the empirical analysis of the next section, these transfers are added to the monthly consumption expenditure of the households of the students, implicitly assuming that the benefits are shared by all household members or, alternatively, that if the relevant costs were not borne by the state they would have to be borne by the household. This is not an unrealistic assumption since family links are still strong
in Greece and intra-family transfers are a common phenomenon. A problem arises in this case regarding about 30% of the tertiary education students (and a few secondary education students) in our sample, who study in cities other than the cities where their parents live and form their own households or—a few of them—live in relatives’ households5. Due to inadequate information,
our methodology implies that the welfare level (equivalent consumption expenditure) of these students is determined by the transfers they receive from their families—in an attempt to equalise the welfare level of all family members—but the benefits of public education transfers are captured entirely by the students themselves and are not shared with the rest of their families. In the second part of the empirical analysis it is assumed that these transfers benefit only the students who receive them. Hence they are added to the equivalent consump-tion expenditure of the students and comparisons are made not between households but between members of particular age groups6.
Comparisons of inequality before and after the trans-fers are made using five indices of inequality; Gini, Atkinson (for e 5 0.5 and e 5 2) and the two Theil indices. These indices satisfy the basic axioms of inequality measurement (symmetry, mean-independence, population-independence and the principle of transfers)7
5The proportion of tertiary education students who study in places other than where their families live is likely to be sub-stantially higher, but a considerable proportion of these students were interviewed in the houses of their families during vacation periods.
6It has been argued that, at least the students of the post-compulsory levels of education, apart from the benefits they receive from the state, they incur the cost of foregone labor incomes (see, for example, Selden & Wasylenko, 1995). Apart from the fact that this element of private cost is outside the scope of our investigation, it was decided to ignore such effects for two additional reasons. Firstly, the measure of resources used in our analysis (equivalent household consumption expenditure) mitigates substantially such life-cycle effects and, secondly and more importantly, the rate of unemployment among those aged 14–25 in Greece in 1988 was a staggering 29.0%, or 33.9% among those aged 14–19 (National Statistical Service of Greece, 1997, pp. 114–116), thus, rendering any cor-responding calculations almost meaningless.
7The second of these axioms, mean-independence, is pretty standard in the theory of inequality measurement but may have serious consequences for our analysis. It states that the level of inequality must remain unchanged if the incomes of all agents change by the same proportion (thus, excluding the possibility that the value of the index may change if the incomes of the agents are measured in dollars, pounds, drachmas, etc.). How-ever, in the framework of our analysis this axiom implies that inequality will remain unchanged if public transfers are pro-portional to the consumption expenditures of the households— an assumption far from uncontroversial. For this reason, in the tables of the next section we also report, apart from estimates of inequality indices, the absolute level of public transfers.
and are sensitive to different types of transfers (Cowell, 1995). The Atkinson index and the second Theil index are relatively more sensitive to transfers close to the bot-tom of the distribution, the first Theil index more sensi-tive to transfers close to the top of the distribution and the Gini index to transfers close to the middle of the distribution. Hence, the combined use of these indices satisfies a wide range of tastes regarding the responsive-ness of an index to different types of transfers.
4. Empirical results
The estimates of Table 3 present a first attempt to examine the distributional impact of public education in Greece. The first line reports estimates related to the dis-tribution of equivalent consumption expenditure when public transfers in the domain of education are not taken into account. The first five cells report the mean monthly consumption expenditure (not equivalent consumption expenditure) of the households ranked in quintiles according to their equivalent consumption expenditure from the poorest (1) to the richest (5). Estimates of the five aforementioned inequality indices for the distri-bution of equivalent consumption expenditure per house-hold are reported in the last five cells.
The estimates in the first five cells of the second line represent the monetary values of the mean monthly transfers of education services from the state to the households belonging to the corresponding quintiles in both absolute terms and (in parentheses) as a percentage of the mean consumption expenditure reported in the first line of the table. The estimates in the last five cells of the second line of Table 3 are the estimates of the inequality indices when the value of public transfers is taken into account and (in parentheses) the percentage change from the corresponding indices reported in the first line of the table.
444
P.
Tsakloglou,
M.
Antoninis
/Economics
of
Education
Review
18
(1999)
439–452
Table 3
Distributional impact of public education in-kind transfers: Greece 1988—all households (n56381)
Atkinson Atkinson
Bottom 2nd 3rd 4th Top Gini 1st Theil 2nd Theil
Distribution index index
quintile quintile quintile quintile quintile index index index (e50.5) (e52)
Initial distribution
53 429 93 887 133 118 179 060 275 815 0.3237 0.0843 0.3088 0.1747 0.1783 (mean consumption expenditure)
Final distribution
4711 6368 7739 7170 5797 0.3159 0.0797 0.3019 0.1688 0.1706 (mean transfer2% of mean
(8.82) (6.78) (5.81) (4.00) (2.10) (22.42) (25.46) (22.23) (23.38) (24.32) consumption expenditure)
Initial distribution plus primary
education transfers 1716 1871 2344 2095 1766 0.3212 0.0830 0.3049 0.1718 0.1755 (mean transfer2% of mean (3.21) (1.99) (1.76) (1.17) (0.64) (20.79) (21.53) (21.26) (21.66) (21.57) consumption expenditure)
Initial distribution plus secondary
education transfers 2231 3129 3522 3197 1977 0.3198 0.0825 0.3054 0.1706 0.1746 (mean transfer2% of mean (4.18) (3.33) (2.65) (1.79) (0.72) (21.22) (22.15) (21.10) (22.35) (22.08) consumption expenditure)
Initial distribution plus tertiary
between 2.23% and 5.46%8
. Hence, it can be claimed that the Greek public education system reduces inequality, at least from a static point of view9.
Furthermore, it is interesting to examine, ceteris
par-ibus, the distributional impact of public transfers at each
level of the education system (primary, secondary and tertiary). This is done in the last three lines of Table 3. The estimates of the table show that the state support to the households belonging to the four bottom quintiles is channelled primarily through secondary and, to a lesser extent, primary education whereas the households of the top quintile receive larger transfers through tertiary edu-cation. In absolute terms the transfers directed to the middle quintiles through primary and secondary public education are higher than the corresponding transfers to the bottom and top quintiles, whereas the higher the quintile the larger the mean tertiary education in-kind state transfer. In terms of aggregate inequality, the in-kind public transfers in the cases of primary and second-ary education have a clearly equalising effect. However, for the tertiary education transfers some indices suggest a small decline in inequality, while others record an increase in post-transfer inequality. It is interesting to note that the households of the top quintile which benefit most from tertiary education are those belonging to the ninth decile. Actually, members of households of the tenth (top) decile are under-represented in tertiary edu-cation. This is a pattern consistently found in all the sub-sequent tables and may be an indication that a consider-able proportion of the offspring of very rich households study in foreign universities.
Following the literature, the unit of analysis in the main part of the paper is the household. However, it can be argued that in distributional studies it may be prefer-able to use distributions of persons rather than
house-8In order to put the distributional impact of these transfers in an appropriate context, this impact can be compared with the distributional impact of non-pension cash public transfers in Greece, using the data of the same Household Budget Survey. Admittedly, the Greek social protection system is primarily a pensions system and cash transfers play a far less important role in Greece than in most developed countries. They account for just around 1% of aggregate disposable income but, unlike in-kind transfers of education services, they are supposed to serve explicitly redistributive goals. As a result of these trans-fers, inequality in the distribution of equivalent income per household in Greece declines between 0.92% and 4.18% according to the indices used in Table 3. In other words, the progressive distributional impact of public education in Greece is more significant than the distributional impact of all the pub-lic transfer payments in cash taken together, excluding pen-sions!
9This is an unambiguous claim since the Lorenz curves of the post-transfer distribution dominates the Lorenz curve of the pre-transfer distribution. For further details, see Antoninis and Tsakloglou (1997).
holds (Sen, 1992). For this reason, we also examined the distributional impact of in-kind transfers of education services using the distribution of equivalent consumption expenditure per capita (instead of the distribution of equivalent consumption expenditure per household). The results were almost identical to those reported in Tables 3–5. An example using the counterpart of Table 3 for the distribution of equivalent consumption expenditure per capita is reported in Appendix A. In qualitative terms, the results reported there are virtually indis-tinguishable from those of Table 3. In quantitative terms they suggest that the positive impact of the transfers in the fields of primary and secondary education may be even stronger than that reported in Table 3. The impact of transfers in the field of tertiary education remains ambiguous.
Even though the results reported in Table 3 are very interesting, they may be a little misleading, as the sample used for the examination of the distributional impact of public education includes several households that are very unlikely to benefit directly from public education (elderly households, childless couples, etc.). For this rea-son, we decided to repeat the exercise of Table 3 using two alternative approaches.
sys-446
P.
Tsakloglou,
M.
Antoninis
/Economics
of
Education
Review
18
(1999)
439–452
Table 4
Distributional impact of public education in-kind transfers: Greece 1988—only households with heads aged 25–60 (n54197)
Atkinson Atkinson
Bottom 2nd 3rd 4th Top Gini 1st Theil 2nd Theil
Distribution index index
quintile quintile quintile quintile quintile index index index (e50.5) (e52)
Initial distribution
74 773 119 172 155 677 202 696 297 147 0.3036 0.0744 0.2729 0.1548 0.1554 (mean consumption expenditure)
Final distribution
8668 9193 9072 8098 5948 0.2904 0.0671 0.2528 0.1452 0.1413 (mean transfer2% of mean
(11.59) (7.71) (5.83) (4.00) (2.00) (24.34) (29.81) (27.37) (26.20) (29.07) consumption expenditure)
Initial distribution plus primary
education transfers 3171 3070 3041 2739 2109 0.2991 0.0722 0.2640 0.1503 0.1503 (mean transfer2% of mean (4.24) (2.58) (1.95) (1.35) (0.71) (21.47) (22.96) (23.26) (22.91) (23.28) consumption expenditure)
Initial distribution plus secondary
education transfers 4507 5103 4167 4011 2269 0.2969 0.0713 0.2629 0.1483 0.1486 (mean transfer2% of mean (6.03) (4.28) (2.68) (1.98) (0.76) (22.19) (24.17) (23.66) (24.20) (24.38) consumption expenditure)
Initial distribution plus tertiary
447
P.
Tsakloglou,
M.
Antoninis
/Economics
of
Education
Review
18
(1999)
439–452
Distributional impact of public education in-kind transfers: Greece 1988—only households with members aged 6–24 (n53185)
Atkinson Atkinson
Bottom 2nd 3rd 4th Top Gini 1st Theil 2nd Theil
Distribution index index
quintile quintile quintile quintile quintile index index index (e50.5) (e52)
Initial distribution
84 596 125 644 163 084 205 964 313 507 0.2897 0.0673 0.2471 0.1393 0.1397 (mean consumption expenditure)
Final distribution
12 973 13 200 13 313 12 344 11 121 0.2716 0.0573 0.2188 0.1273 0.1210 (mean transfer2% of mean
(15.33) (10.51) (8.16) (5.99) (3.55) (26.25) (214.86) (211.45) (28.61) (213.39) consumption expenditure)
Initial distribution plus primary
education transfers 4413 4149 3957 3667 3429 0.2841 0.0645 0.2347 0.1338 0.1333 (mean transfer2% of mean (5.20) (3.30) (2.43) (1.78) (1.09) (21.93) (24.16) (25.02) (23.95) (24.58) consumption expenditure)
Initial distribution plus secondary
education transfers 6289 6388 6069 5512 3907 0.2810 0.0634 0.2342 0.1312 0.1312 (mean transfer2% of mean (7.43) (5.08) (3.72) (2.68) (1.25) (23.00) (25.79) (25.22) (25.81) (26.08) consumption expenditure)
Initial distribution plus tertiary
448 P. Tsakloglou, M. Antoninis / Economics of Education Review 18 (1999) 439–452
tem10
. The second factor has to do with the fact that private education has a very high income elasticity of demand (Kanellopoulos & Psacharopoulos, 1997) and almost all the private education students who do not benefit from the corresponding public transfers are mem-bers of households belonging to the top two quintiles.
The second approach isolates the households with members who could participate in the education system; that is, in this case the sample consists of all households with members aged 6–24 (3185 households)11
. In this case almost all the current beneficiaries of public edu-cation are included in the sample, but the overwhelming majority of the non-beneficiaries is left out of the picture. The results are reported in Table 5 and in quantitative terms the estimates are even stronger than those of Table 4. The value of the in-kind transfers to the households in the sample is equivalent to 7.05% of the value of their consumption expenditure. In absolute terms the mean value of the in-kind transfer of education services per household does not vary substantially across quintiles. However, due to the fact that the mean consumption expenditures of the quintiles differ considerably, these in-kind transfers as a proportion of the consumption expenditure vary enormously across quintiles (15.33%, 10.51%, 8.16%, 5.99% and 3.55% for the bottom, second, third, fourth and top quintile, respectively). In general, the lower the quintile the higher the value of the mean primary and secondary education transfer-in-kind per household, while the opposite is true in the case of tertiary education. Careful examination of the data reveals that this differential impact is the result of three factors, two of which were discussed earlier (firstly, poorer households have more children and, secondly, private education is more prevalent in the top quintiles). The third factor is that members of households belonging to higher quintiles are disproportionally over-represented in tertiary education12. Table 5 suggests that inequality
declines considerably when public in-kind education
10The average number of children aged 6–14 per household is 0.61 in the bottom quintile of Table 4, 0.62 in the second, 0.59 in the third, 0.57 in the fourth and 0.42 in the top quintile. 11The age limit of 24 was selected for two reasons. Firstly, since students are admitted to tertiary education after participat-ing in competitive examinations operatparticipat-ing on a numerus clausus basis, a considerable proportion of them start their tertiary edu-cation studies not in the age of 18 but in the age of 19 or 20. Secondly, since there are virtually no time limits for the period of studies in tertiary education institutions in Greece, the majority of students do not complete their studies during the normal period (3–6 years, depending on the type of institution). Indeed, our data show a sharp drop in the tertiary education participation rate only after the age of 24.
12The proportion of tertiary education students in the popu-lation of the bottom quintile is 2.03% and rises to 2.58%, 3.21%, 3.24% and 4.20% as we move to the top quintile.
transfers are taken into account. Aggregate inequality among the households in the sample declines between 6.25% and 14.86% after the impact of these transfers is accounted for.
The final part of our empirical analysis adopts an alter-native approach. Instead of assuming that the benefits of public education are shared by all household members, it is assumed that these benefits are captured exclusively by the students themselves. The distributions used are distributions of persons rather than households and com-parisons of the levels of inequality before and after the transfers are made for members of particular age groups. These groups are defined in such a way as to include the potential beneficiaries of each level of the education system (6–11, 12–17 and 18–24 for primary, secondary and tertiary education, respectively). More specifically, it is assumed that the pre-transfer welfare level of each member of these groups is determined by his/her level of equivalent consumption expenditure while the post-transfer welfare level is determined by his/her equivalent consumption expenditure plus the value of the public transfer in the corresponding education level, if he or she is participating.
449
P.
Tsakloglou,
M.
Antoninis
/Economics
of
Education
Review
18
(1999)
439–452
Distributional impact of public education in-kind transfers: Greece 1988—distributions of persons in particular age brackets
Atkinson Atkinson
Bottom 2nd 3rd 4th Top Gini 1st Theil 2nd Theil
Distribution index index
quintile quintile quintile quintile quintile index index index (e50.5) (e52)
Initial distribution of persons aged 6–11
31 638 52 701 69 281 91 493 151 702 0.3001 0.0734 0.2742 0.1523 0.1538 (mean equivalent consumption
expenditure)
Initial distribution of persons aged 6–11 plus primary education
7969 7944 7866 7556 6863 0.2767 0.0596 0.2149 0.1245 0.1217 transfers (n51635)
(25.19) (15.07) (11.35) (8.26) (4.52) (27.80) (218.80) (221.63) (218.25) (220.87) (mean transfer2% of mean equiv.
consumption exp.)
Initial distribution of persons aged 12–17
32 265 51 346 66 187 85 586 142 261 0.2884 0.0673 0.2410 0.1408 0.1384 (mean equivalent consumption
expenditure)
Initial distribution of persons aged 12–17 plus secondary education
9971 10 579 10 361 10 056 9552 0.2536 0.0522 0.1858 0.1093 0.1054 transfers (n51744)
(30.90) (20.60) (15.65) (11.75) (6.71) (212.07) (222.44) (222.90) (222.37) (223.84) (mean transfer2% of mean equiv.
consumption exp.)
Initial distribution of persons aged 18–24
35 273 54 572 70 448 92 835 145 102 0.2757 0.0601 0.2259 0.1226 0.1253 (mean equivalent consumption
expenditure)
Initial distribution of persons aged 18–24 plus tertiary education
4520 4637 6412 5984 7227 0.2739 0.0595 0.2281 0.1203 0.1251 transfers (n51908)
(12.81) (8.50) (9.10) (6.45) (4.98) (20.65) (21.00) (10.97) (21.88) (20.16) (mean transfer2% of mean equiv.
450 P. Tsakloglou, M. Antoninis / Economics of Education Review 18 (1999) 439–452
while the rest of the indices used in our analysis record a modest decline in inequality13.
5. Conclusions
As Tinbergen (1975) points out, the distributional impact of improved human capital on the level and the structure of employment and wages is only likely to materialise fully in the long run. Similarly, the full distri-butional impact of in-kind public transfers of education services is also likely to materialise in the long-run. For this reason, ideally it would be desirable to study the distributional impact of the public education system in a dynamic framework using life-time income profiles of the population members. Since this kind of data is not available, several alternatives were tried, exploiting cross-sectional information, in order to provide as com-plete a “partial” picture as possible. The results show convincingly that, even leaving aside possible economic and non-economic externalities of public education, in-kind public transfers of education services in Greece lead to a decline in aggregate inequality. This equalising effect is, almost exclusively, the result of transfers in the fields of primary and secondary education, whereas transfers in the field of tertiary education were found to have a negligible distributional impact.
The findings concerning the distributional impact of public primary and secondary education are very robust and we are very confident about them. For a number of reasons, we are less confident about the accuracy of the estimates concerning the distributional impact of public spending in tertiary education. As noted in Section 3, due to lack of relevant information in the 1987/88 Household Budget Survey data, in our analysis we assigned the same value of in-kind transfer to each tertiary education student. However, this is far from true. As the data of Table 2 show, public spending per university student is almost twice as high as public spending per technologi-cal education institution student. Combining data of the National Statistical Service of Greece on the region of origin and the occupational group of the fathers of stu-dents of universities and technological education insti-tutions during the academic year 1987/88 with the data
13The reference group used for the estimation of the distri-butional impact of tertiary education in Table 6 (persons aged 18–24) includes 93.5% of all tertiary education students. If we repeat this exercise restricting our reference group to the age bracket 19–22 (70.3% of all tertiary education students belong to this group) the results change slightly and the inequality indi-ces used in our analysis—Gini, the two Atkinson indiindi-ces and the two Theil indices—decline by 1.85%, 2.84%, 0.40%, 4.02% and 1.92%, respectively.
of the 1987/88 Household Budget Survey, it was esti-mated that the mean equivalent consumption expenditure of the households of university students was 8.1% higher than the mean equivalent consumption expenditure of the households of technological education institution stu-dents. It is likely that this difference alone would have been sufficient to change the direction of the results regarding the distributional impact of public transfers in tertiary education, had we had the appropriate data in the 1987/88 Household Budget Survey. Furthermore, costs per student vary widely across the faculties of tertiary education institutions and there is sufficient indirect evi-dence that the offspring of the most well-off segments of the population are over-represented in the faculties with the highest cost per student, such as medicine and engineering (Chrysakis, 1991)14.
Are there any policy implications arising from the results of the paper? With respect to primary and lower secondary education, our results show that the free pro-vision of in-kind education services by the state leads to a substantial decline in aggregate inequality. Therefore, reforms in these levels of education should better aim to improve the efficiency rather than the distributional impact of the system. Regarding tertiary education, our results show that there is room for improving the distri-butional impact of state transfers. This improvement could be the result of several alternative, but not neces-sarily incompatible, policy reforms such as the impo-sition of a graduate tax, the provision of grants to stu-dents from poor families, a constitutional reform that would allow the operation of private tertiary education institutions and, especially, the promotion of policies aimed to increase the participation of members of poor households in tertiary education15.
Acknowledgements
Useful comments and suggestions were received from Dimitris Chalkiotis, Theodore Lianos, Hara Magoula, Manos Matsaganis, George Psacharopoulos, the
Associ-14It should be noted that a number of studies using alterna-tive methodologies, data sets, reference periods and population coverage reach the conclusion that public in-kind transfers in the field of tertiary education do not promote equity in Greece (Papageorgiou, 1977; Psacharopoulos, 1988; Patrinos, 1992, 1995). Furthermore, Patrinos shows that in Greece, as in many developing countries, a positive relationship exists between a father’s education and returns to schooling, which implies that, ceteris paribus, returns to tertiary education are higher to off-spring of better-off households.
ate Editor Hessel Oosterbeek, an anonymous referee and seminar participants at the University of Cyprus and the Athens University of Economics and Business. The research of P. Tsakloglou was partly financed from ACE grant No 94-0617-R. The usual disclaimers apply.
Atkinson Atkinson
Bottom 2nd 3rd 4th Top Gini 1st Theil 2nd Theil
Distribution index (e index (e
quintile quintile quintile quintile quintile index index index
50.5) 52)
Initial distribution
(mean consumption 30 101 49 886 66 988 89 313 14 8400 0.3062 0.0755 0.2793 0.1558 0.1586 expenditure)
Final distribution
(mean transfer2% of 2983 3722 4088 3942 3393 0.2944 0.0687 0.2637 0.1480 0.1463 mean consumption (9.91) (7.46) (6.10) (4.41) (2.29) (23.85) (29.01) (25.59) (25.10) (27.76) expenditure)
Initial distribution plus primary education
transfers 1164 1227 1352 1307 1142 0.3020 0.0734 0.2715 0.1515 0.1539
(mean transfer2% of (3.87) (2.46) (2.02) (1.46) (0.77) (21.37) (22.78) (22.79) (22.76) (22.96) mean consumption
expenditure)
Initial distribution plus secondary education
transfers 1399 1859 1885 1744 1228 0.3003 0.0728 0.2723 0.1500 0.1531
(mean transfer2% of (4.65) (3.72) (2.81) (1.95) (0.83) (21.93) (23.58) (22.51) (23.72) (23.47) mean consumption
expenditure)
Initial distribution plus tertiary education
transfers 420 636 852 892 1022 0.3060 0.0754 0.2796 0.1554 0.1587
(mean transfer2% of (1.40) (1.27) (1.27) (1.00) (0.69) (20.07) (20.13) (10.11) (20.26) (10.06) mean consumption
expenditure)
References
Aaron, H.J., & McGuire, M. (1970). Public goods and income distribution. Econometrica, 38, 907–920.
Antoninis, M., & Tsakloglou, P. (1997). On the distributional impact of public education: evidence from Greece. Athens University of Economics and Business, Department of Inter-national and European Economic Studies, Discussion Paper No 97-01.
Chrysakis, M. (1991). Uneven access to tertiary education: the impact of educational changes. In N. Petralias, The
Univer-sity in Greece today. Athens: Sakis Karayiorgas Foundation
(in Greek).
Cowell, F.A. (1995). Measuring inequality, (2nd ed.). London: Prentice Hall/Harvester Wheatsheaf.
Hagenaars, A.J.M., de Vos, K., & Zaidi, M.A. (1994). Poverty
statistics in the late 1980s: Research based on micro-data.
Luxembourg: Eurostat.
Jimenez, E. (1986). The public subsidization of education and health in developing countries: A review of equity and efficiency. World Bank Research Observer, 1, 111–129. Kanellopoulos, C.N. (1996). Recent developments in Greek
Appendix A
Distributional impact of public education in-kind transfers: Greece 1988—distribution of persons (n 5 19 293)
education. International Journal of Educational
Develop-ment, 16, 65–77.
Kanellopoulos, C.N., & Psacharopoulos, G. (1997). Private edu-cation expenditure in a “free eduedu-cation” country: the case of Greece. International Journal of Educational
Develop-ment, 17, 73–81.
Lambropoulos, H., & Psacharopoulos, G. (1992). Educational expansion and earnings differentials in Greece. Comparative
Education Review, 36, 52–70.
Meerman, J. (1979). Public expenditure in Malaysia: who
bene-fits and why. New York: Oxford University Press.
Ministry of Finance (1989). Report of public revenues and
expenditures for the financial year 1988. Athens: General
Accounting Office of the State, Ministry of Finance (in Greek).
National Statistical Service of Greece (1997). Statistical
Year-book of Greece 1996. Athens: NSSG.
Paleokrassas, S., Vretakou, V., & Rousseas, P. (1996). Pupils interrupting their studies in gymnasium and the need for their vocational training. Athens: Pedagogical Institute– Organisation for Vocational Education and Training (in Greek).
452 P. Tsakloglou, M. Antoninis / Economics of Education Review 18 (1999) 439–452
Papatheodorou, C. (1997). Family background and poverty in Greece: the role of father’s occupation and education. Dis-cussion Paper No. 133, Welfare State Programme, STICERD, LSE.
Patrinos, H.A. (1992). Higher education finance and economic inequality in Greece. Comparative Education Review, 36, 298–308.
Patrinos, H.A. (1995). Socioeconomic background, schooling, experience, ability and monetary rewards in Greece.
Eco-nomics of Education Review, 14, 85–91.
Psacharopoulos, G. (1982). Earnings and education in Greece: 1960–1977. European Economic Review, 17, 333–347. Psacharopoulos, G. (1988). Efficiency and equity in Greek
higher education. Minerva, 26, 119–137.
Selden, T.M., & Wasylenko, M.J. (1995). Measuring the distri-butional effects of public education in Peru. In D. van de Walle, & K. Nead, Public spending and the poor: Theory
and evidence. Baltimore: Johns Hopkins University Press.
Sen, A.K. (1992). Inequality reexamined. Oxford: Clarendon Press.
Smeeding, T.M., Saunders, P., Coder, J., Jenkins, S., Fritzell, J., Hagenaars, A.J.M., Hauser, R., & Wolfson, M. (1993). Poverty, inequality and living standard impacts across seven nations: the effects of non-cash subsidies for health,
edu-cation and housing. Review of Income and Wealth, 39, 229–256.
Tinbergen, J. (1975). Income distribution: analysis and policies. Amsterdam: North Holland.
Tsakalotos, E. (1998). Privatisation and university education: What is at stake? Greek Review of Political Science, 11, 27– 53 (in Greek).
Tsakloglou, P. (1992). Multivariate decomposition of inequality: Greece 1974, 1982. Greek Economic Review, 14, 89–102.
Tsakloglou, P. (1993). Aspects of inequality in Greece: Measurement, decomposition and inter-temporal change: 1974, 1982. Journal of Development Economics, 40, 53–74. Tsakloglou, P. (1996). Analyzing and comparing the impact of alternative concepts of resources in distributional studies: Evidence from Greece. Athens University of Economics and Business, Department of International and European Econ-omic Studies Discussion Paper No. 96-02.
Tsakloglou, P. (1997). Changes in inequality in Greece in the 1970s and the 1980s. In P. Gottschalk, B. Gustafsson, & E. Palmer, Changing patterns in the distribution of economic
welfare. An international perspective. Cambridge: