1. INTRODUCTION
Spatial epidemiology aims to examine and interpret human diseases with regard to their geographic distribution (Lawson, 2006). As many infectious and degenerative conditions occur similarly in both humans and animals, the introduction of a spatial perspective in veterinary epidemiology is considered to provide a better understanding of shared risk factors related to speciic environmental settings (Scotch et al., 2009). Of particular interest is the role of companion animals, which are considered sentinels or comparative models for estimating human exposures to environmental pollutants (Reif, 2011). An important beneit from studying companion animals is that they closely share their habitat with humans and thus indicate possible risks at the community level that could also be relevant for humans (Reif, 2011). This intimate co-existence represents a major motivation in comparative epidemiology. However, as is the case with human disease data, veterinary data are usually only available at spatially aggregated levels, which impede quantitative studies in general.
Not only disease incidence data but also demographic data are commonly summarized within arbitrary regions, such as administrative units, because of privacy concerns (Beale et al., 2008). As a consequence, spatial epidemiological analyses using such enumerated data are subject to the Modiiable Areal Unit Problem (MAUP) as the geographical manifestation of ecological fallacy (Openshaw, 1984). Hence,
statistical relationships between variables, as determined from aggregated data, may differ from relationships derived at different levels of aggregation (e.g., administrative units at iner resolutions) or at the level of individual households. In order to improve small area estimates of veterinary disease outcomes we propose a binary dasymetric reinement (Eicher and Brewer, 2001) of companion dog tumor incidence data. The dasymetric reinement aims to improve the quality of spatial data aggregated within arbitrary spatial units that assume constant values across these units by deconstructing them to discontinuous entities better approximating the spatial distribution of dogs within human populated land (Johnson and Tucker, 2013; Mennis and Hultgren, 2006). This reinement is expected to improve the spatial data quality and the estimation of statistical relationships between tumor outcomes and environmental risk factors, if these relate to localized ancillary covariates.
In this study, municipality-aggregated dog tumor incidence counts in Switzerland for the year 2008 are modeled based on demographic and confounding variables (Grüntzig et al., 2015). The analysis is irst carried out using the unreined administrative units and then for dasymetrically reined units using the residential land as limiting ancillary variable (Mennis and Hultgren, 2006). The assessment of the models’ diagnostics and residuals provides an effective way to evaluate the model performance in different regions of the study area and to investigate the changes in spatial autocorrelation and spatial
A NOVEL APPROACH TO VETERINARY SPATIAL EPIDEMIOLOGY: DASYMETRIC
REFINEMENT OF THE SWISS DOG TUMOR REGISTRY DATA
G. Boo a, c, *, S. I. Fabrikant a, *, S. Leyk b
a Department of Geography, University of Zurich, Switzerland - (gianluca.boo, sara.fabrikant)@geo.uzh.ch b Department of Geography, University of Colorado at Boulder, Boulder, CO, USA
c Collegium Helveticum, University of Zurich and Swiss Federal Institute of Technology, Zurich, Switzerland
Commission II, WG II/4
KEY WORDS: Companion Animal Tumor Registries, Veterinary Spatial Epidemiology, Generalized Linear Models, Dasymetric Reinement, Small Area Estimation, Fitness for Use of Spatial Data
ABSTRACT:
In spatial epidemiology, disease incidence and demographic data are commonly summarized within larger regions such as administrative units because of privacy concerns. As a consequence, analyses using these aggregated data are subject to the Modiiable Areal Unit Problem (MAUP) as the geographical manifestation of ecological fallacy. In this study, we create small area disease estimates through dasymetric reinement, and investigate the effects on predictive epidemiological models. We perform a binary dasymetric reinement of municipality-aggregated dog tumor incidence counts in Switzerland for the year 2008 using residential land as a limiting ancillary variable. This reinement is expected to improve the quality of spatial data originally aggregated within arbitrary administrative units by deconstructing them into discontinuous subregions that better relect the underlying population distribution. To shed light on effects of this reinement, we compare a predictive statistical model that uses unreined administrative units with one that uses dasymetrically reined spatial units. Model diagnostics and spatial distributions of model residuals are assessed to evaluate the model performances in different regions. In particular, we explore changes in the spatial autocorrelation of the model residuals due to spatial reinement of the enumeration units in a selected mountainous region, where the rugged topography induces great shifts of the analytical units i.e., residential land. Such spatial data quality reinement results in a more realistic estimation of the population distribution within administrative units, and thus, in a more accurate modeling of dog tumor incidence patterns. Our results emphasize the beneits of implementing a dasymetric modeling framework in veterinary spatial epidemiology.
patterns of the residuals (Anselin, 1995; Leyk et al., 2012) due to the spatial reinement of administrative enumeration units. Such changes have immediate consequences for the interpretation of the models and emphasize the beneits of implementing a dasymetric framework in veterinary spatial epidemiology.
2. STUDY AREA AND DATA
The analysis is performed for the whole of Switzerland, which includes a variety of topographic settings. Sixty percent of the Swiss territory is located within the Alpine Mountain Region, ten percent in the Jura Mountains and the remaining thirty percent in the Swiss Plateau. As a consequence of these conditions, the population tends to be heterogeneously distributed over space, with more than two thirds of the country’s inhabitants living in urban areas located in the Swiss Plateau (Vega Orozco et al., 2015). This demographic pattern is also visible at a local scale, where settlements usually follow the river valley structure and are concentrated at lower elevations in close proximity to communication routes (Vega Orozco et al., 2015).
We employed the 2008 municipality boundaries from the VECTOR200 landscape model of the Swiss Federal Ofice of Topography (SFOT, 2015) for our study purposes. Residential land is determined based on the buildings and dwellings survey conducted by the Swiss Federal Statistical Ofice in 2010 (SFSO, 2015). The data are represented as hectometric polygon features, where hectare cells are allocated to municipalities based on the location of their centroids. Our case study uses 3,611 tumor incidence records stored in the Swiss Dog Tumor Registry for the year 2008 (Grüntzig et al., 2015). These records are available as aggregated data at the municipality level. To relect the characteristics and distribution of the entire dog population, we use comprehensive dog count data for 2008 also at the municipality level as provided by the Animal Identity Service AG (ANIS, 2015). Our statistical model is it using dog population density based on the area of residential lands within each municipality. Additionally, we calculate the sex ratio and age class structure of the dog population.
We include potential confounding variables such as the estimated degree of urbanization and the economic well-being of municipalities. Urban lifestyles and higher inancial means are associated with better monitoring of the companion animal health status, and thus accurate reports of dog diseases to veterinarians (Grüntzig et al., 2015). The degree of urbanization of a municipality is estimated based on the human population distribution for 2008 and the attribute indicating the urban character in 2000, both provided by the Swiss Federal Statistical Ofice (SFSO, 2015). The economic well-being of a municipality is estimated according to federal income tax data collected by the Swiss Federal Tax Administration (SFTA, 2015) in 2008. Hence, our statistical model is based on the computation of human population density, and the average income tax at the municipality level. Environmental explanatory variables, which can be related to speciic tumors (Reif, 2011; Schmidt, 2009), are not included in this pilot study, as they add further complexity and require careful preprocessing.
3. METHODS
A frequentist approach to statistical inference is often employed for exploratory spatial epidemiology studies (Beale et al., 2008; Lawson, 2006). This approach aims to identify and
test possible explanatory, predictive or confounding variables (Chen et al., 1999; Zeileis et al., 2008). In this framework, the variables used for statistical modeling are considered fully explanatory components, regardless of possible random effects (Lawson, 2006). The incorporation of tests for global and local spatial autocorrelation and non-stationarity in the data and model residuals (Anselin, 1995; Leyk et al., 2012; Moran, 1950) represents another important component in this approach. The present study draws on this framework, and consists of the three steps described below.
3.1 Statistical modeling of counts data
Generalized Linear Models (GLMs) are common statistical methods for inference in spatial epidemiological studies to examine model deviance reduction and predictive power (Beale et al., 2008; Lawson, 2006). The incidence counts of disease outcomes are usually modeled through a Poisson GLM, in which the result is log-transformed (Zeileis et al., 2008). The statistical model is tested for overdispersion (i.e., the variance is signiicantly higher than the population mean) as well as for possible excess of zero counts (Vuong, 1989; Zeileis et al., 2008). Additionally, we test the variables for statistical signiicance and calculate the McFadden pseudo R-Squared (McFadden, 1974) to measure the model’s goodness of it using the statistical software R (The R Foundation, 2015).
3.2 Dasymetric reinement of enumeration units
The binary dasymetric reinement of the municipality units to residential land within these units aims to examine the beneits of increasing the spatial resolution of the analytic unit for modeling and interpreting disease patterns (Mennis and Hultgren, 2006). In doing so, we assume that the spatial distribution of dog and human populations are analogous, as people and companion animals share the same living environment at the community level (Reif, 2011). In this study, we do not expect to observe differences in the statistical model through dasymetric reinement because all explanatory variables are enumerated at the municipality level as well and do not experience any effects through reinement. However, here we focus on the investigation of possible changes in the spatial structure of the model residuals as an important indicator of MAUP and the associated model performance in different regions.
3.3 Spatial autocorrelation of the models residuals
4. RESULTS AND DISCUSSION 4.1 Poisson GLM of tumor incidence counts
Dog population density, human population density, urban character, and average income tax per capita are statistically signiicant variables in modeling dog tumor incidence counts (p<.001) with a Poisson GLM. The inluence of sex ratio and speciic age classes appears to be insigniicant (p<.1). Among the signiicant variables, the ones estimating the degree of urbanization and economic well-being are positively associated
with increasing tumor incidences. Conversely, increasing dog density seems to have a negative impact on the tumor incidence counts at the municipality level.
The overall performance of the Poisson GLM is measured with the McFadden pseudo R-Squared (McFadden, 1974) indicating a value of 0.39, which suggests some improvement over the null model i.e., the model that does not include explanatory variables. One reason could be the presence of overdispersion. In fact, testing for equidispersion (Cameron and Trivedi, 1990) reveals signiicant overdispersion (p<.001). The Vuong (1989) test, which assesses the Poisson GLM against its zero-inlated extension, additionally reveals that the zero-inlated model is signiicantly (p<.001) superior to its standard counterpart. This
conirms that there is an excess of zero counts restraining the application of a Poisson GLM.
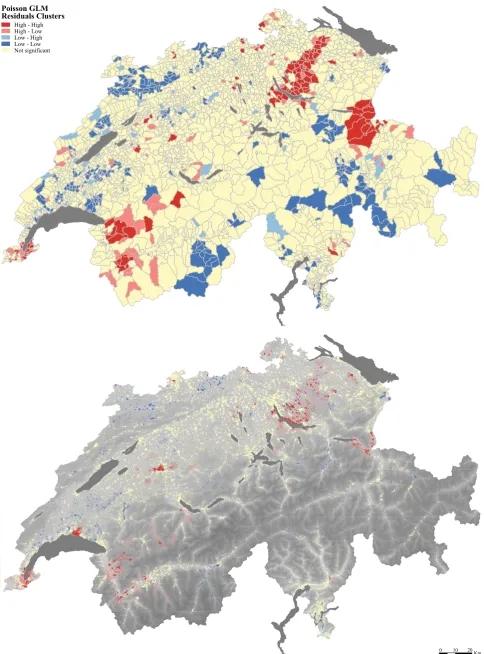
4.2 Model residuals and spatial autocorrelation parameters To investigate the Poisson GLM performance across space and identify possibly missing spatial variables in modeling incidence counts, we map the model residuals, i.e., the difference between the observed and the modeled tumor incidence counts (Beale et al., 2008). We produce two spatial representations of the Poisson GLM residuals to assess under- and overpredictions,
one for unreined municipality units (Figure 1, left) and one for the dasymetrically reined units (Figure 1, right). Although the depicted values are identical in the two representations, a visual comparison suggests that a spatial reinement may improve the interpretation of local-scale patterns. This is especially true in the mountainous regions, where the spatial reinement results in more realistic estimation of population distributions and local contexts (i.e., places where population resides and thus where most likely incidences occur).
A non-random distribution of the residuals within the study area and the presence of spatial autocorrelation could indicate the absence of important explanatory factors or misspeciication of included variables (Beale et al., 2008). We are interested in assessing how the spatial relations between neighboring units and their respective residual values change through spatial reinement. To account for this issue, we use a Nearest Neighbors weighting method, which is often retained when units have unequal sizes (GeoDa, 2015). We use different numbers of nearest neighbors, to understand the sensitivity of the autocorrelation to this parameter. We produce two models, based on reined and unreined units, to produce the most distinct spatial patterns and reveal the displacement of centroids as a consequence of reinement. Figure 2 shows that the highest percentage of high-high and low-low residual clusters in the spatially reined model is produced for a weight parameter of seven nearest neighbors. With this parameter, which is used below for computing spatial autocorrelation, 156 units (out of 2,771 municipalities) represent centers of either high-high or low-low clusters in the reined model only.
4.3 Spatial autocorrelation of unreined and reined units
To compare these two models, we test for global spatial autocorrelation and spatial patterns of the models’ residuals
Poisson GLM Figure 1. Dog tumor incidence count model residuals represented through municipality-level unreined units (left) and
dasymetrically reined units (right) (data: SFOT, 2015)
0
Clusters According to the Spatial Unit -Unrefined and Refined
-Refined
Poisson GLM Residuals Clusters
High - High High - Low Low - High Low - Low Not significant
0 10 20Km Figure 3. Dog tumor incidence count model residuals clusters for unreined municipality units (top) and dasymetrically
in GeoDa with a distance weights parameter of seven nearest neighbors. The Moran’s I statistic shows a slight positive global spatial autocorrelation of the residuals for both the unreined (I=.15; p<.05) and the reined (I=.14; p<.05) models. However, due to the heterogeneity in the study area, this outcome needs to be assessed at a local scale through LISA, evaluating the Moran’s I for each spatial unit according to the statistical signiicance of its relation to the observations in the neighborhood (Anselin, 1995). We tested both models for signiicant (p<.05) high-high and low-low local residual clusters to identify places where there is a poor model it which manifests itself in under and overpredictions. Again, the result indicates differences between the unreined (Figure 3, top) and the reined model (Figure 3, bottom). The differences are visually less striking for clusters located in the Swiss Plateau but become apparent in the mountainous regions.
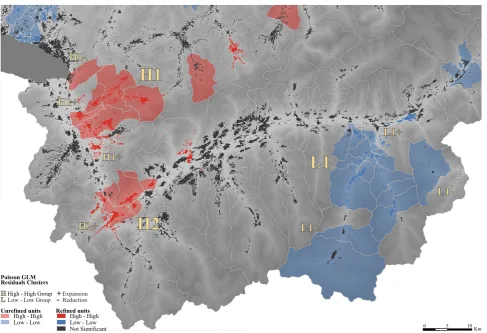
In Figure 4, we directly compare the LISA outcomes for high- high and low-low residual clusters for a selected region located in the southwest of the Alpine Mountain Region. This region presents two high-high residual clusters located in the western part (H1 and H2), and a larger low-low residual cluster located in the eastern part of the study area (L1). The binary dasymetric reinement results in larger high-high residual clusters because the neighborhood relations between reined units have changed due to the shifting of the corresponding centroid points (+). In contrast, the dasymetric reinement results in a smaller low- low residual cluster, since the reinement to residential land causes increased distances between displaced centroids, due to topographic conditions that separate valleys (-). A similar result can be observed in a municipality in the northwest, irst classiied as a high-high cluster center in the unreined model,
but not signiicant after reinement (-). Another municipality in the low-low residual cluster is annexed due to the residential land proximity to the other cluster centers (+). The reined model does not show any distinct change in the lower main valley, where the scattered distribution of residential land includes locations which are not physically adjacent to the main clusters.
4.4 Discussion
These preliminary results suggest that dog tumor incidence counts provided as summary statistics enumerated within administrative units should be modeled with care when using demographic factors as explanatory variables (Grüntzig et al., 2015). In contrast, accounting for common confounding factors such as the urbanization and the economic well-being of municipalities as additional explanatory variables has drastically improved the model’s goodness of it. Limitations exist due to the assumption of a Poisson distribution in itting the GLM. Still, we preferred the Poisson GLM to conduct our preliminary assessment of MAUP-related effects and spatial autocorrelation in the residual spatial distributions, due to its simple structure, and because it still provides valuable irst insights into the key statistical relationships. Some limitations exist due to missing or misspeciied environmental explanatory variables. As mentioned, those have not yet been included in the model, to keep preliminary tests simple.
Despite the above limitations, the mapping of the model residuals using both the unreined and reined units provide valuable insights to better understand how the residuals’ spatial distribution changes as a consequence of binary dasymetric
0 5 10Km
H1
H2
L1
H1+
H2+
L1-
H1-
L1-L1+
H1+
Poisson GLM Residuals Clusters
Unrefined units Refined units
High - High Low - Low
High - High Low - Low Not Significant
HHigh - High Group
L Low - Low Group
+Expansion - Reduction
reinement. It is important to note that theses models have been it without the incorporation of any spatial explanatory variables that would also change their value due to reinement. It can be hypothesized that the effects of such “localized” explanatory variables would also change with spatial reinement. In this study, extents and numbers of signiicant high-high and low-low residual clusters show remarkable differences between reined and unreined spatial distributions. These differences are most striking in the mountainous regions, where the rugged topography can cause great shifts in the locations of residential land (i.e., the corresponding centroids). The change in residual distributions indicates that spatial context and proximity between populated places is important to further improve the performance and predictive power of the model and provides important indications for regional optimization and advanced interpretations.
As has been demonstrated this simple binary reinement results in veterinary spatial data of improved quality, providing a solid basis for future research that will focus on more complex models and conduct more careful interpretation of model coeficients and residuals. For example, clusters of model overestimation in adjacent valleys could mean that within this region the same factor is missing, and thus local estimators could be improved (Anselin 1995). It could also mean that in comparison to other regions there could be differences in statistical relationships between the outcome and the explanatory variables, possibly resulting in spatial non-stationarity of these relationships. Such effects would remain hidden when using unreined spatial units to model disease incidence.
5. CONCLUSIONS AND OUTLOOK
We presented the potential beneits of implementing a simple binary dasymetric framework in veterinary spatial epidemiology. This preliminary study assessed the spatial autocorrelation and spatial patterns of residuals from models of dog tumor incidence counts, while assessing MAUP-related effects. Modeling was irst carried out using the unreined municipality units and then, for dasymetrically reined spatial units, using residential land as a limiting ancillary variable. The dasymetric reinement resulted in improved data quality (i.e., spatial resolution). The original spatial data that were aggregated within arbitrary spatial units have the disadvantage of constant attribute values across the whole unit, which is an unrealistic assumption for human population. These data were deconstructed into discontinuous entities better approximating the spatial distribution of dogs within human populated land. This pilot study thus provides an enduring basis for a more detailed interpretation of model residuals. The results of this geographically inspired research advocate the use of a binary dasymetric framework in spatial epidemiological research on companion animal diseases more generally, and dog tumors in particular.
Future research aims at further development of the approach proposed in this preliminary study, following three paths. First, we intend to further improve the dasymetric reinement of the dog tumor incidence counts for smaller areas. Demographic attributes at sub-municipality level within residential lands (i.e. statistics on dwelling occupation) will be used as related ancillary variables that are associated with tumor rates at ine resolution. Second, we will further improve the statistical framework of dog tumor incidence counts, through the use of a Negative-Binomial GLM with a zero-inlated extension in order to account for overdispersion and excess of zero counts.
Finally, we intend to apply this spatial-statistical concept in the investigation of speciic types of dog tumors and include ancillary covariates with spatial effects. Of particular interest would be the study of sources of localized environmental pollution including distance variables, which could be also relevant for humans.
ACKNOWLEDGMENTS
This research is partially funded by the Collegium Helveticum, a joint initiative of the University of Zurich, Switzerland and the Swiss Federal Institute of Technology of Zurich, through the grant accorded to its fellows Andreas Pospischil and Kay W. Axhausen.
REFERENCES
ANIS, 2015. Animal Identity Service AG – The National Database for Marked Pets. http://www.anis.ch. Last accessed on 31.05.2015.
Anselin, L., 1995. Local Indicators of Spatial Association – LISA. Geographical Analysis, 27, pp. 93-115.
Beale, L., Abellan, J.J., Hodgson, S., Jarup, L., 2008. Methodologic Issues and Approaches to Spatial Epidemiology.
Environmental Health Perspectives, 116, pp. 1105-1110.
Burnham, K.P., Anderson, D.R., 2002. Model selection and multimodel inference: a practical information-theoretic
approach. Springer, New York.
Cameron, A.C., Trivedi, P.K., 1990. Regression-based tests for overdispersion in the Poisson model. Journal of Econometrics, 46, pp. 347-364.
Chen, C., Chock, D.P., Winkler, S.L., 1999. A simulation study of confounding in generalized linear models for air pollution epidemiology. Environmental Health Perspectives, 107, pp.
217-222.
Eicher, C.L., Brewer, C.A., 2001. Dasymetric mapping and areal interpolation: implementation and evaluation. Cartography
and Geographic Information Science, 28, pp. 125-138.
GeoDa, 2015. GeoDa Center: Spatial methods and tools. https:// geodacenter.asu.edu. Last accessed on 31.05.2015.
Grüntzig, K., Graf, R., Hässig, M., Welle, M., Meier, D., Lott, G., Erni, D., Schenker, N.S., Guscetti, F., Boo, G., Axhausen, K.W., Fabrikant, S.I., Folkers, G., Pospischil, A., 2015. The Swiss Canine Cancer Registry: A Retrospective Study on the Occurrence of Tumours in Dogs in Switzerland from 1955 to 2008. Journal of Comparative Pathology, 152, pp. 161-171.
Johnson, K., Tucker, J., 2013. The data type of spatial objects.
Formal Aspects of Computing, 25, pp. 189-218.
Lawson, A., 2006. Statistical methods in spatial epidemiology.
Wiley, Chichester, England.
Leyk, S., Norlund, P.U., Nuckols, J.R., 2012. Robust assessment of spatial non-stationarity in model associations related to pediatric mortality due to diarrheal disease in Brazil. Spatial
McFadden, D., 1974, Conditional legit analysis of qualitative choice behaviour. In: Frontiers in econometrics, Academic Press, New York, pp. 105-142.
Mennis, J., Hultgren, T., 2006. Intelligent dasymetric mapping and its application to areal interpolation. Cartography and
Geographic Information Science, 33, pp. 179-194.
Moran, P.A.P., 1950. Notes on Continuous Stochastic Phenomena. Biometrika, 37, pp. 17-23.
Openshaw, S., 1984. The modiiable areal unit problem.
CATMOG 38. GeoBooks, Norwich, England.
Reif, J.S., 2011. Animal sentinels for environmental and public health. Public Health Reports, 126, pp. 50-57.
Schmidt, P.L., 2009. Companion Animals as Sentinels for Public Health. Veterinary Clinics of North America: Small
Animal Practice, 39, pp. 241-250.
Scotch, M., Odoin, L., Rabinowitz, P., 2009. Linkages between animal and human health sentinel data. BMC Veterinary
Research, 5(15).
SFOT, 2015. Swiss Federal Ofice of Topography. http://www. swisstopo.admin.ch. Last accessed on 31.05.2015.
SFSO, 2015. Swiss Federal Statistical Ofice. http://www.bfs. admin.ch. Last accessed on 31.05.2015.
SFTA, 2015. Swiss Federal Tax Administration. http://www. estv.admin.ch. Last accessed on 31.05.2015.
Taylor, L.H., Latham, S.M., Woolhouse, M.E., 2001. Risk factors for human disease emergence. Philosophical Transactions of
the Royal Society B: Biological Sciences, 356, pp. 983-989.
The R Foundation, 2015. The R Project for Statistical Computing. http://www.r-project.org. Last accessed on 31.05.2015.
Vega Orozco, C.D., Golay, J., Kanevski, M., 2015. Multifractal portrayal of the Swiss population. Cybergeo : European
Journal of Geography. http://cybergeo.revues.org/26829. Last
accessed on 31.05.2015.
Vuong, Q.H., 1989. Likelihood ratio tests for model selection and non-nested hypotheses. Econometrica, 57, pp. 307-333.
Zeileis, A., Kleiber, C., Jackman, S., 2008. Regression Models for Count Data in R. Journal of Statistical Software, 27(8), pp.