KEY WORDS:Gaussian Process regression, activity modeling, anomaly detection
ABSTRACT:
Complex activity modeling and identification of anomaly is one of the most interesting and desired capabilities for automated video behavior analysis. A number of different approaches have been proposed in the past to tackle this problem. There are two main challenges for activity modeling and anomaly detection: 1) most existing approaches require sufficient data and supervision for learning; 2) the most interesting abnormal activities arise rarely and are ambiguous among typical activities, i.e. hard to be precisely defined. In this paper, we propose a novel approach to model complex activities and detect anomalies by using non-parametric Gaussian Process (GP) models in a crowded and complicated traffic scene. In comparison with parametric models such as HMM, GP models are non-parametric and have their advantages. Our GP models exploit implicit spatial-temporal dependence among local activity patterns. The learned GP regression models give a probabilistic prediction of regional activities at next time interval based on observations at present. An anomaly will be detected by comparing the actual observations with the prediction at real time. We verify the effectiveness and robustness of the proposed model on the QMUL Junction Dataset. Furthermore, we provide a publicly available manually labeled ground truth of this data set.
1 INTRODUCTION
Activity modeling and automatic anomaly detection in videos have become active fields in computer vision and machine learn-ing because of the wide deployments of the surveillance cameras. These tasks remain difficult challenges in crowded and compli-cated scenes because of frequent occlusions among objects over time and space, different types of activities occurring simulta-neously, noise caused by low video quality and the ambiguous definition of anomaly.
Modeling activities and connecting them to each other is one of the most important problems because moving agents normally have neither explicit spatial nor temporal dependencies. Tradi-tionally, many researchers have concentrated on analyzing mo-tion trajectories to model activities and interacmo-tions (Wang et al., 2011; Sun and Nevatia, 2013; Talha and Junejo, 2014; Wang et al., 2014). By means of tracking, the co-occurring activities are separated from each other. However, tracking-based approach-es are very sensitive to tracking errors. If detection, tracking or recognition fails only in some frames, the future results could be completely wrong. They are only appropriate in a simple scene with a only few objects and clear behaviors. Hence, tracking does not work well in complex scenes of crowded motion, as indicated above.
To tackle the problems of missed detection and broken tracks, many recent studies have focused on directly using low-level vi-sual features (Kuettel et al., 2010; Saleemi et al., 2010; Hospedales et al., 2011). These studies develop more sophisticated statistical models to cluster typical activities: a generative statistic mod-el firstly learns statistical information of typical activities. An abnormal activity is detected if it has low likelihood under a cri-terion. Typical approaches include Dynamic Bayesian Networks (DBNs) (Swears et al., 2014; Vo and Bobick, 2014) such as Hid-den Markov Models (HMM) (Banerjee and Nevatia, 2014). The probabilistic topic models (PTMs) (Kinoshita et al., 2014) such as Latent Dirichlet Allocation (LDA) (Hospedales et al., 2011)
or Hierarchical Dirichlet Process (HDP) (Kuettel et al., 2010) are powerful methods to learn activities in surveillance videos. However, inference in topic models is computationally consum-ing. Moreover, they are unsupervised that means the limitation of accuracy and precluding classification of activities.
Feature-based (descriptor) approaches are useful to model and recognize activities. They in general use an appropriate classifier to classify the learned activities and detect anomalies. The typical classifier includes GP classifier and SVM (Chathuramali and Ro-drigo, 2012; Althloothi et al., 2014; Hasan and Roy-Chowdhury, 2014) are widely adopted because of their advantage in terms of high classification accuracy and relative simpler learning process. However, they are supervised models and a training data set with manually assigned labels is necessary in advance. Moreover, they have high requirement in the applicability and the preciseness of features to ensure their performance. The most widely used fea-tures include HOG feafea-tures, optic flow based feafea-tures, etc. How-ever, in a complicated and crowded scene the low-level features are more reliable.
In this paper, we propose a novel approach to model activities and detect anomalies using non-parametric Gaussian Process (G-P) regression models (Rasmussen and Williams, 2006). We mod-el activities based on semantic region. The spacial dependencies among activities are connected using GP regression models and the temporal dependencies are modeled by using a one-step ahead prediction strategy. The understanding of these relationships is crucial for detecting subtle anomalies. After training, our model makes a predictive distribution of regional activities on each se-mantic region and compares with the actual observation. If the intensity of an observation is larger enough than the predictive distribution, which means that the relationship learned from the training data between different activity patterns is broken, some abnormal activities are occurring in the observed region.
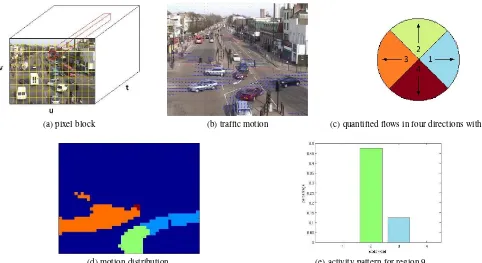
ac-(a) pixel block (b) traffic motion (c) quantified flows in four directions with colors
(d) motion distribution (e) activity pattern for region 9
Figure 1: Representation of motion.
tivity patterns using Gaussian Automatic Relevance Determina-tion (ARD) kernel funcDetermina-tion and model activities. Activities are predicted by learned GP regression models and anomalies are de-tected by comparing actual observations with prediction at real time. We furthermore provide a publicly available ground truth of the popular Traffic Junction Dataset (Hospedales et al., 2009). This ground truth has been manually labeled.
The remainder of this paper is organized as follows. In Section 2, we reflect related work in this application. In Section 3, we firstly review GP models, and then present how to model activities and detect anomalies with GP regression models in details. In Sec-tion 4, experimental results are presented and discussed. Finally, we conclude this paper in Section 5.
2 RELATED WORK
GP models have been widely used to tackle vision problems such as motion flow analysis (Kim et al., 2011), human motion analy-sis(Wang et al., 2008), tracking (Urtasun et al., 2006) and action recognition (Gong and Xiang, 2003). However, the visual data used in these cases are collected in controlled or good environ-ments. They are relatively cleaner and simpler than the practical surveillance videos, which are much noisier. Most existing ap-proaches use GP models to model activities and detect anomalies based on trajectory analysis (Kim et al., 2011) or feature-based methods. Although they have been proved to be effective meth-ods for this task, their drawbacks caused by tracking are also ob-viously as discussed in Section 1.
To our best knowledge, only the work (Loy et al., 2009a) has attempted to use GP models for complex activity modeling and anomaly detection in a crowded traffic scene. It has proved that GP models outperform HMM on both sensitivity to anomaly and robustness to noise. However, their proposed model has draw-backs on activity representation and activity modeling with GP. (1) Two different motion features are assumed independent to
each other. In practice there are implicit spacial-temporal de-pendencies between them. (2) Activity patterns of a region are represented only by the sum of the motion vectors in this region. For instance, a slight abnormal motion hardly affects the result of composition of motion vectors if there are relative strong motions in this region. This anomaly is covered by the motion stream and therefore ignored.
We adopt quantified directions to represent local motions instead of directly using optic flow. A regional activity is modeled using the distribution of quantified motions. The relationships between different activities in different regions are learned by GP regres-sion model using the Automatic Relevance Determination (ARD) kernel (Chu and Ghahramani, 2005).
3 ACTIVITY MODELING AND ANOMALY DETECTION
3.1 Gaussian Process Regression
A regression modely = f(x) +ǫis considered, where ǫ ∼
N(0, σ2)is an independent Gaussian white noise. Gaussian pro-cessf(x)is specified by its mean functionm(x) = E[f(x)], in this study we assume the mean value as zero, and covariance functionK(x,x′) = E[(f(x)−m(x))(f(x′)−m(x′))] = E[f(x)f(x′)]. Then the observation vectory = {y
1, . . . , yn}
distributes as a zero-mean multivariate Gaussian distribution and its covariance matrix isK∗ = K+σ2
I, whereKdenotes a
n−by−ncovariance matrix between all pairs of training points andKij =K(xi,xj). For a test pointx∗, the posterior density p(y∗|x∗,x,y)is a uni-variate normal distribution with the mean
and variance as follow (Rasmussen and Williams, 2006):
m(y∗) =
k(x∗)TK∗−1y (1)
var(y∗) = K(x∗,x∗)−k(x∗)T K∗−1
k(x∗) (2)
wherek(x∗) = [K(x∗,x
1), . . . , K(x∗,xn)]T is a covariance
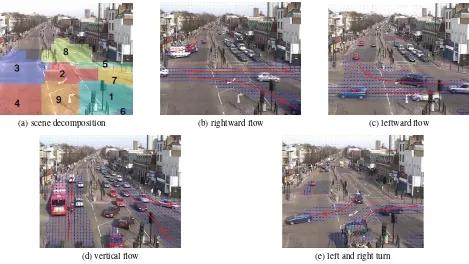
(a) scene decomposition (b) rightward flow (c) leftward flow
(d) vertical flow (e) left and right turn
Figure 2: (b)-(e) four main different traffic flows, they are sorted according to the traffic light cycle, (a) result of the semantic scene decomposition.
covariance of the test pointx∗isK(x∗,x∗).
A covariance matrix is given by the covariance function, which is also known as the kernel function. It is a crucial ingredient in GP models because it encodes our assumption on continuity and smoothness of the GP functionf(x). There are many popular functions (Rasmussen and Williams, 2006), such as linear, ratio-nal quadratic and neural network. In this paper, we choose ARD kernel function since it automatically determines the strength of relevance among different activities. We adopt the Conjugate Gradient method (Nocedal and Wright., 2006) to optimize the hyperparameters by maximizing the marginal log-likelihood.
3.2 Activity Representation
We divide the whole video into a sequence of 50-frame (2 sec-onds) clips and quantize the position by dividing the image space into8∗8blocks (see Figure 1(a)). We extract optical flow in each pair of consecutive frames using (Liu, 2009) over time with a threshold to reduce noise as shown in Figure 1(b). We accumu-late the optical flow in each clip over its frames. The optical flow vectors of pixel blocks are the mean of the accumulated flow of its memberships. A local pixel block activity pattern is represented as a dual time series signal:u={ut:t∈τ},v={vt:t∈τ},
utandvt are horizontal and vertical flow components at clipt respectively, andτis the total number of clips used for training.
(Loy et al., 2009b) present an approach to automatically decom-pose a complex scene into multiple semantic regions according to the spatial-temporal distribution of activity patterns. By means of this approach local activity patterns are modeled in each re-gion without tracking or analyzing motion trajectories. With the extracted motion features, we use a method similar to (Loy et al., 2009b) to group blocks into semantic regions with the help of a spectral clustering algorithm (Zelnik-Manor and Perona, 2004) and we remove any region which has more than90% of zero-activity blocks (background) (see Figure 2(a)).
In (Loy et al., 2009a), an activity in a region is represented by a moving vector(U, V), which areU = ΣubandV = Σvb re-spectively, where(ub, vb)is the flow vector of a pixel block in this region. However, this method does not separate different ac-tivities in a region. Furthermore, the sum of all motion vectors in a region may cause a zero result. In this case, there are actual objects moving in this region, but the motion featureU orV e-quals 0 or is close to 0. It will be considered as nothing happens here. On the other hand, an abnormal activity with small moving velocity is ignored when the normal motions in this region are strong. For instance, a jay-walker crosses a strong vehicle flow, but(U, V)cannot reflect this anomaly.
Our model represents activity patterns explicitly. The block optic flow vectors are quantified using a codebook with words,ω = (x, y, u, v), where(x, y)represents the position and(u, v)is the displacement, quantified into 4 directions (see Figure 1(c)). In such crowded scene, we rather care about objects moving direc-tion than their velocity. We obtain a spacial distribudirec-tion of these 4 motion features (see Figure 1(d)). The regional activity pat-terns are represented as the percentage of these 4 motion features
[d1
iis the percentage of direction1ini−th region andd1 example of the corresponding histogram for a regional activity pattern is shown in Figure 1(d). In this way, any existing motion is separated and detected.
3.3 Activity Modelling with Gaussian Process
Four GP regression models are constructed for each region to model features of 4 directions separately. Therefore we have4N
GP models forNdecomposed regions. However, we firstly need to construct a reasonable input and output pair(yi,xi), wherexi is the input feature vector,yiis the corresponding output value of a GP regression model andiis the index of data point.
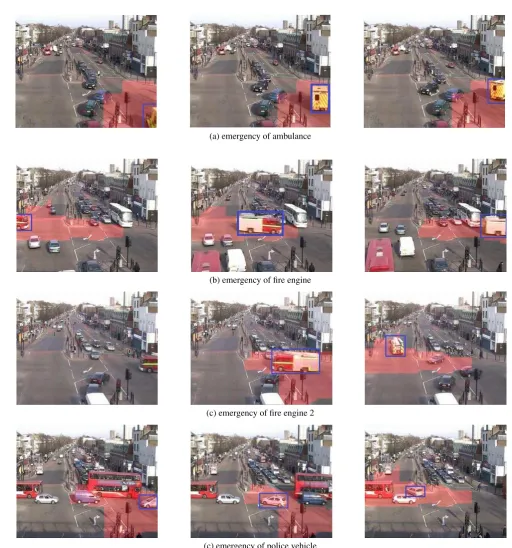
(a) emergency of ambulance
(b) emergency of fire engine
(c) emergency of fire engine 2
(c) emergency of police vehicle
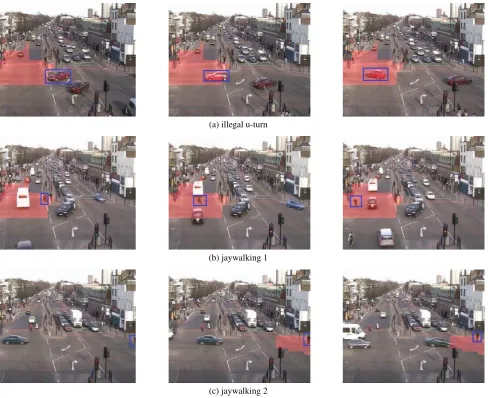
(a) illegal u-turn
(b) jaywalking 1
(c) jaywalking 2
Figure 4: Examples of detected anomaly using our GP models (abnormal regions are denoted in red whilst the corresponding abnormal object is highlighted with a box).
assume that the two motion features are mutually independent. Each of them is only affected by the same feature from other re-gions. For instance,yi,t =Ui,tis a output value of the model, whereUi,tis observed at time intervaltfrom theith regionri. xi,t={Uj,t−1|j6=i&i, j∈N}is the corresponding input
fea-ture vector, where{Uj,t−1|j 6=i, j ∈N}are observed at time
intervalt−1from all other regions. The models for featureV are in the same way:yi,t=Vi,tandxi,t={Vj,t−1|j6=i, j∈N}.
But actuallyUandV spacially and temporally relate to each oth-er.
Our proposed method exploits the implicit spacial-temporal de-pendencies among different motion features of all regions in a novel way. For each motion feature{dmi |m ∈ [1,2,3,4]}, we select one of them, which can most affectdmi , from all other regions to construct the input feature vector: xi = {dm
j |j 6=
i&i, j ∈ N}. They are determined by ARD kernel function as follow: dmi,tis an output value of a GP model, which is ob-served at time intervaltfromith region. The input feature vec-tor fordm
i,tconsists of four motion features observed at previous time intervalt−1fromjth region[d1
j,t−1, d 2
j,t−1, d 3
j,t−1, d 4
j,t−1]
(j 6= i). Thereforedm
i,tis one-step ahead predicted by this G-P regression model from observed activity patterns in jth re-gion at previous interval. The feature with the lowest length-scale in ARD kernel is selected because of its highest influence
on dm
i,t. All these selected features observed at intervalt−1 from all other regions construct the global input feature vector xmi,t = {dmj,t−1|j 6= i and i, j ∈ N, m ∈ [1,2,3,4]}and dm
i,tis its corresponding output value of the GP regression model. Each GP regression model thus predicts one motion feature of the regional activity patterns at next interval using most relevant mo-tion feature of other activity patterns observed at present in other regions.
3.4 Anomaly Detection
The output value of GP regression model has the highest possibil-ity, when it equals the mean of the Gaussian distribution given by Eq. (1). And the output value has95%of certainty to fall into area (m−1.96σ2
,m+ 1.96σ2
). If the observed value (non-negative) of activity patterns at intervaltis larger thanm+ 1.96σ2
(a) undetected jaywalking 1 (b) undetected jaywalking 2 (c) undetected bicycle in improper region
(d) undetected u-turn 1 (e) undetected u-turn 2
Figure 5: Examples of undetected anomaly using our GP models (the key abnormal object is highlighted with a box).
4 EXPERIMENTS
We conduct the experiments on the popular QMUL Junction Dataset (Hospedales et al., 2009), which contains a video of a crowded, traffic junction in London (360∗288,25fps,89999frames). We used the first 10000 frames (200 clips) of the video for scene de-composition and training the GP regression models and the rest (1599 clips) for testing. The main challenges in this scene are: 1) low quality surveillance video and different kinds of noise, 2) irregular and violent varying of traffic volume over time, in particular at the entrances and exits, 3) large numbers of motion-agents and complex interactions among them, 4) some kind of ambiguous activities.
This traffic scene is controlled by traffic lights and dominated by four traffic flows (see Figure 2(b)-(e), they are sorted according to the traffic light cycle). Figure 2(a) shows the result of scene de-composition into 9 semantic regions. The dede-composition agrees with the distribution of the main four traffic flows and human un-derstanding. For example, regions 2 and 9 in the middle of the scene are the areas for vehicles from top and bottom, respective-ly, to wait for an interruption of vertical flow and make a left or right turn (as shown in Figure 2(e)). Region 5 covers the pedes-trian crossing and so is the region 6 in the right bottom of the scene. Region 8 is only for vehicles which are driving downward or waiting for the traffic light for vertical flow. Regions 1 and 7 are entrance for leftward flow and exit for rightward flow, while regions 3 and 4 are exit for leftward flow and entrance for right-ward flow (as shown in Figure 2(b) and (c), respectively). Region 4 is the entrance for vertical flow (as shown in Figure 2(e)). Inter-actions in these four regions are complex because during different phases of the traffic cycle they contain different interactions. But the activities within the same region are similar to each other and distinguish themselves from the others in other regions.
We adopt ARD kernel function to automatically learn the strength of correlation among activities in different regions and select the most relevant one, which have the lowest length-scale. For in-stance, the hyper-parameter of the GP model for featured2
3
(up-ward moving in region 3) shows that the length-scale of the four activity features in region 7 are[3.7863,0.8610,0.03950,2703.4], respectively. Featured37has the lowest length-scale, interpreting
that the leftward moving in region 7 has the highest influence on the upward moving in region 3. This understanding agrees with our human understanding of the traffic activity patterns in this scene because, if a vehicle drives towards left in region 7, it will cross region 2 and then turn to the upper region in region 3, as illustrated in Figure 2(d). The featured32 (leftward
mov-ing in region 2) has the length-scale of activity in region 7 as
[8.8726,1.7201,0.0259,24.6840], respectively. Featured3 7
af-fectsd3
2 mostly, because the right-to-left vehicle flow in region
2 is always from region 7. It further proves that our method to construct the spacial-temporal relationship is appropriate and ef-fective.
Jaywalking, illegal U-turn and emergency vehicles driving in an improper lane are the main anomalies in this scene. We have manually labeled all anomalies that appear in the whole video as ground truth and they will be made publicly available. Figure 3 shows some examples of typical anomalies caused by emergency vehicles. The ambulance in Figure 3(a) is driving in a definitely wrong direction in the lane for a normal case. It is the easiest kind of anomaly to detect. In Figure 3(b) and (c), the fire engine interrupts the current traffic state (vertical flow, and left and right turn, respectively). It increases the percentage of corresponding motion features in the regions which it passes by. Hence, these regions are detected that, there is an anomaly arising. The police vehicle is driving conversely as shown in Figure 3(c) and easy to be detected because the leftward motions are impossible in cur-rent traffic state. In the experiments, all of the anomalies caused by ambulances, fire engines and police vehicles were successfully detected by our GP models.
The typical abnormal activities- illegal U-turn and jaywalking in this scene are shown in Figure 4. When a vehicle wants to make a U-turn from region 2, it needs to firstly drive horizontally in-to region 3. This activity leads in-to a larger percentage of motion featured3
turn because of their advantage in separation and analysis of an individual activity among the others. However, our model is more flexible because GP models does not require prior knowledge in advance.
Abnormal activities of Jaywalking are successfully detected as shown in Figure 4(b) and (c). The principle for this detection is also because of the percentage of the corresponding motion features higher than expectation of our GP models. However, Jaywalking is undetected in two cases: 1) the vehicle flow sus-pends and pedestrians cross the road during this time margin (Fig-ure 5(a)). 2) the jay-walker is walking along the vehicle flow (like Figure 5(b)). Its motion does not obviously increase the percent-age of any motion features because it has the same motions as the vehicle flow and its motion submerges in the flow; The sec-ond case can be avoided by means of object detection because pedestrians will be detected moving in an improper area or lane. The undetected anomaly of bicycle riding in a improper region (like Figure 5(c)) also can be detected with the help of object detection. The understanding of the second case is a challenge. Because suspending vehicle flow may be viewed as the end of current traffic flow. Thus, people crossing the road without vehi-cle is viewed as a normal activity. Furthermore, the bad training samples for this case are the other main reason. The pedestrians in this video sample do not obey the traffic rule so strictly. They usually cross the road in such case, even the traffic light is red for pedestrians. Therefore, the dynamic models such as HMM could work better for this case.
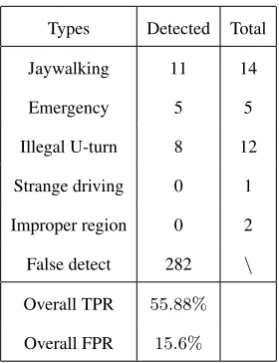
A human interpreted summary of the categories of abnormal events is given in Tab. 1. Notice that, each entire abnormal event is counted as one event, no matter how many clips it spans. The false detection means that, a clip is detected as an abnormal clip, but there is not any abnormal event of interest. The overall false positive rates is defined as:
F P R=Number of falsely detected clips
Number of test clips .
From the table we know, about56%of all the abnormal events of interest were correctly detected, while 282 of all the test clips were falsely detected as abnormal. (Loy et al., 2009b) obtained a higher true positive rate76.43% because our ground truth is different from theirs. For instance, they have only 8 cases of jaywalking while we have 14. Maybe the jaywalking in region 6 (Figure 2(a)) are not taken into account in their ground truth. Therefore, the comparison of experimental results with others methods maybe not objective because of subjective understand-ing about abnormal events, unless a uniform ground truth is pub-lic provided. By implementing the method in (Loy et al., 2009b) we found that, our method performed better in detecting subtle abnormal events such as the jaywalking in region 6, because the week motion vectors of the pedestrian were not cancelled by the strong motion vectors of the vehicle flow in our method.
Improper region 0 2
False detect 282 \
Overall TPR 55.88%
Overall FPR 15.6%
Table 1: Summary of discovered abnormal events. Overall true positive (TPR) and false positive rates (FPR) are also given.
5 CONCLUSION AND FUTURE WORK
In this paper, we have proposed a novel method using GP re-gression models to model activities and detect anomalies beyond detection and tracking in a complex scene of crowded motion. In particular, our GP regression models are constructed to learn spacial-temporal relationship among regional activity patterns and predict its next-step distribution. Anomalies are detected by com-paring prediction with actual observation. In the experiment we have demonstrated that, our method works reliably to detect anoma-lies.
However, we also see some limitations of our current model. Firstly, our detection is a semantic region based method. The spacial relationship is rough among activities. It depends on the results of decomposition of semantic regions. The abnormal ac-tivities cannot be exactly localized. Secondly, our model can on-ly detect anomalies in the semantic regions. It does not support high-level semantic queries on activities and interactions. For example, what are the typical activities and interactions in this scene. Finally, because of no detection, our model cannot detec-t abnormal acdetec-tividetec-ties according detec-to detec-the cadetec-tegories of agendetec-ts. For example, if a people riding a bicycle along the path of vehicles, his motions cannot be distinguished from those of vehicles and this activity will not be detected as an anomaly. Furthermore, the motion speed is not taken into account. The over-speed activities will not be detected either. In the future work, other features such as appearance and speed, are worth considering in these scenarios for better performance.
ACKNOWLEDGEMENTS
The work is partially funded by DFG (German Research Founda-tion) YA 351/2-1. The authors gratefully acknowledge the sup-port.
References
Althloothi, S., Mahoor, M. H., Zhang, X. and Voyles, R. M., 2014. Human activity recognition using multi-features and multiple kernel learning. Pattern Recognition 47(5), pp. 1800– 1812.
ity modeling and recognition in streaming videos. In: CVPR, pp. 796–803.
Hospedales, T., Gong, S. and Xiang, T., 2009. A markov clus-tering topic model for mining behaviour in video. In: ICCV, pp. 1165–1172.
Hospedales, T. M., Li, J., Gong, S. and Xiang, T., 2011. Identify-ing rare and subtle behaviors: A weakly supervised joint topic model. IEEE Trans. PAMI 33(12), pp. 2451–2464.
Kim, K., Lee, D. and Essa, I., 2011. Gaussian process regression flow for analysis of motion trajectories. In: ICCV, pp. 1164– 1171.
Kinoshita, A., Takasu, A. and Adachi, J., 2014. Traffic incident detection using probabilistic topic model. In: EDBT/ICDT Workshops, pp. 323–330.
Kuettel, D., Breitenstein, M. D., Van Gool, L. and Ferrari, V., 2010. What’s going on? discovering spatio-temporal depen-dencies in dynamic scenes. In: CVPR, pp. 1951–1958.
Liu, C., 2009. Beyond pixels: exploring new representations and applications for motion analysis. PhD thesis, Citeseer.
Loy, C., Xiang, T. and Gong, S., 2009a. Modelling multi-object activity by gaussian processes. In: BMVC, pp. 1988–1995.
Loy, C., Xiang, T. and Gong, S., 2009b. Multi-camera activity correlation analysis. In: CVPR, pp. 1988–1995.
Nocedal, J. and Wright., S., 2006. Numerical operation. Springer pp. 101–134.
Rasmussen, C. and Williams, C., 2006. Gaussian Processes for Machine Learning (Adaptive Computation and Machine Learning). The MIT Press, Boston.
Saleemi, I., Hartung, L. and Shah, M., 2010. Scene understand-ing by statistical modelunderstand-ing of motion patterns. In: CVPR, p-p. 2069–2076.
Sun, C. and Nevatia, R., 2013. Active: Activity concept transi-tions in video event classification. In: ICCV, pp. 913–920.
Swears, E., Hoogs, A., Ji, Q. and Boyer, K., 2014. Complex activity recognition using granger constrained dbn (gcdbn) in sports and surveillance video. In: CVPR, pp. 788–795.
Talha, A. M. and Junejo, I. N., 2014. Dynamic scene under-standing using temporal association rules. Image and Vision Computing 32(12), pp. 1102–1116.
Urtasun, R., Fleet, D. and Fua, P., 2006. 3d people tracking with gaussian process dynamical models. In: CVPR, pp. 238–245.
Vo, N. N. and Bobick, A. F., 2014. From stochastic grammar to bayes network: Probabilistic parsing of complex activity. In: CVPR, pp. 2641–2648.