T H E J O U R N A L O F H U M A N R E S O U R C E S • 47 • 3
Using Brazil’s Racial Continuum to
Examine the Short-Term Effects of
Affirmative Action in Higher
Education
Andrew M. Francis
Maria Tannuri-Pianto
A B S T R A C T
In 2004, the University of Brasilia established racial quotas. We find that quotas raised the proportion of black students, and that displacing cants were from lower socioeconomic status families than displaced appli-cants. The evidence suggests that racial quotas did not reduce the preuniv-ersity effort of applicants or students. Additionally, there may have been modest racial disparities in college academic performance among students in selective departments, though the policy did not impact these. The find-ings also suggest that racial quotas induced some individuals to misrepre-sent their racial identity but inspired other individuals, especially the darkest-skinned, to consider themselves black.
I. Introduction
Brazil is a paradox insofar as it is known both for its racial diversity and also for its racial inequality. Undoubtedly, this is the consequence of being the country that had received the greatest number of slaves during the Trans-Atlantic Slave Trade (Eltis 2001). Today, about half of the population is branco, or light-skinned, 44.2 percent pardo, or brown-skinned, and 6.9 percent preto, or dark-skinned (IBGE 2010).1Growing recognition of persistent racial disparities in
edu-1. The termsbranco(light-skinned),pardo(brown-skinned), andpreto(dark-skinned) are answer choices to the standard race question utilized by the Brazilian Statistical Agency. This question also appears on surveys conducted by the authors and university. Although the terms are colors, their social meaning encompasses more than skin tone.
Andrew M. Francis is an assistant professor of economics at Emory University. Maria Tannuri-Pianto is a professor of economics at the University of Brasilia. The authors are extremely grateful to the Emory URC for funding, to CESPE/UnB for providing data and assistance, and to anonymous referees for won-derfully helpful comments. The data used in this article can be obtained beginning January 2013 through December 2016 from Andrew M. Francis, Emory University, Department of Economics, 1602 Fishburne Drive, Atlanta, GA 30322-2240, andrew.francis@emory.edu.
[Submitted August 2010; accepted August 2011]
Francis and Tannuri-Pianto 755
cation, income, and other outcomes is beginning to spur efforts to reevaluate and reformulate public policies in Brazil (Telles 2004).
In this paper, we examine the experience of the University of Brasilia (UnB), which established racial quotas in July 2004, making it the first federal university in the country and the only university in the region to do so. At UnB, 20 percent of available admissions slots are reserved for students who self-identify asnegro, or black.2Those who are selected for admission under the quota system are required to attend an interview with a university panel to verify that they are “black enough” to qualify.3That the policy change was so simple while the racial environment so complex makes Brazil an ideal place to examine important academic and policy questions about affirmative action.
The objectives of the paper are to estimate the effect of the policy on the racial and socioeconomic profile of UnB students, preuniversity effort of applicants and students, racial gaps in college academic performance, and black identity of appli-cants and students. To this end, the authors conducted a survey of UnB students who matriculated between 2003 and 2005, a period including two admissions cycles before quotas and three after. Also, the authors were provided with admissions re-cords and a survey of applicants who took the university entrance exam during the period. All in all, we obtained data on more than 2,000 students and 24,000 appli-cants making this one of the largest studies on affirmative action in higher education. Moreover, it is one of the first to use individual-level data to examine the introduc-tion of an affirmative acintroduc-tion program, the first to identify separate effects by skin tone, and one of the few to study the construction of racial identity.
In summary, we find that racial quotas raised the proportion of black and dark-skinned students at UnB, and that displacing applicants were, by many measures, from families with significantly lower socioeconomic status than displaced appli-cants. While in theory affirmative action might increase or decrease effort, the evi-dence indicates that racial quotas did not reduce the preuniversity effort of either applicants or students. Additionally, the evidence is inconsistent with the contention that the intended beneficiaries of affirmative action are worse off because they are placed in colleges with academic standards they are unable to meet. Factors inde-pendent of the policy, including racial differences arising prior to college attendance, appear to be driving any racial disparities in college academic performance. The findings also suggest that racial quotas induced some individuals to misrepresent their racial identity but inspired other individuals, especially the darkest-skinned, to genuinely consider themselves black. These results are consistent with the incentives created by the policy. Indeed, the incentive to apply under the quota system was substantial given the competitiveness of admissions, and programs for quota students reinforced and fostered investments in black identity.
2. The termnegrois a descriptor of black/Afro-Brazilian identity. This question appears on surveys con-ducted by the authors and university. There is considerable debate in Brazil about the meaning ofnegro. To some,negrois equivalent topreto. To others, all who self-identify aspardoorpretoarenegro. In this study, we do not place any restrictions on the relationship betweennegroandbranco/pardo/preto, since respondents are asked separate questions. According to our data, mostpretosand somepardosconsider themselvesnegro, while mostbrancosand somepardosdo not.
756 The Journal of Human Resources
The remainder of the paper is organized as follows. Section II reviews related literature. Section III provides background information on racial inequality in Brazil and racial quotas at UnB. Section IV describes the data and empirical strategy. Section V presents the results, and Section VI concludes.
II. Previous Literature
The findings in this paper build on three distinct but interrelated areas of research: affirmative action, race, and identity.
First, this paper contributes to the literature on affirmative action. Economists have long been interested in race-targeted policies (Coate and Loury 1993; Donohue and Heckman 1991; Fryer and Loury 2005a, 2005b; Holzer and Neumark 2000; Leonard 1984a, 1984b, 1984c; Smith and Welch 1984). Most research focuses on the United States, but some focuses on India, Brazil, and other developing countries. A number of studies investigate the effect of eliminating affirmative action in higher education. Theory papers propose efficiency justifications for retaining or discarding racial pref-erences in college admissions (Abdulkadiroglu 2005; Chan and Eyster 2003; De Fraja 2005; Epple, Romano, and Sieg 2008; Fryer, Loury, and Yuret 2008). Empirical papers, many of which use individual-level data to examine Texas and California, largely suggest that dismantling or replacing affirmative action would lower the enrollment of minority students in college (Bucks 2004; Card and Krueger 2005; Conrad and Sharpe 1996; Dickson 2006; Kain, O’Brien, and Jargowsky 2005; Long 2004a, 2004b; Tienda, Alon, and Niu 2008). Similarly, this paper is concerned with the effect of affirmative action on the enrollment of historically underrepresented racial groups, although it is studying the introduction, not elimination, of the policy. Empirical studies also examine the academic performance of minorities and sub-sequent gains to minorities in the labor market (Arcidiacono 2005; Loury and Gar-man 1993; Rothstein and Yoon 2008). They generally find that the labor market gains of minorities tend to outweigh the potential costs of “mismatch,” the possibility that the intended beneficiaries of affirmative action may be worse off because they are matched with excessively difficult colleges and jobs. Based on tabulations of UnB admissions and academic records, Cardoso (2008) investigates differences in attrition and college grades between quota and nonquota students. She finds that quota students exhibited lower attrition rates than nonquota students, and they had comparable grades except in selective departments of study. This paper builds on prior work by using measures of self-reported and non-self-reported race/skin tone and by employing a difference-in-difference framework to estimate the effect of quotas on racial gaps in college academic performance.
Francis and Tannuri-Pianto 757
paper does not examine labor market outcomes, it adapts the methodology developed in Bertrand, Hanna, and Mullainathan (2010) to identify and compare displacing and displaced applicants, as India and Brazil have roughly analogous university admis-sions and quota systems.
Theoretical research explores the relationship between preferences in admissions and preuniversity investments (Fryer and Loury 2005a; Fryer, Loury, and Yuret 2008; Holzer and Neumark 2000). Changes in admissions standards might relocate some individuals who otherwise would have had little chance of selection to the margin of selection, thereby inspiring effort. Alternatively, changes in admissions standards might relocate some individuals who otherwise would have been at the margin of selection to an intramarginal position, thus reducing effort. Essentially, these studies maintain that affirmative action has a theoretically ambiguous effect on effort. This is largely an open question empirically. Ferman and Assunc¸a˜o (2005) use data from Brazil to study the issue. They find that black secondary school students who resided in states with a university with racial quotas had lower scores on a proficiency exam, which they argue indicates that racial quotas lowered effort. Nevertheless, Ferman and Assunc¸a˜o (2005) are unable to identify which students applied to college and which did not. The estimates are rather large given that the average black secondary school student would have had only a small chance of admission. Moreover, self-reported racial identity may be correlated with the adop-tion of quotas making the results challenging to interpret. This paper aims to build on this work by focusing on applicants and students, employing multiple measures of effort, and using both self-reported and non-self-reported race/skin tone.
Second, this paper contributes to the literature on race and skin shade. A number of papers demonstrate the significance of skin tone—beyond the influence of race— in education, employment, and family (Bodenhorn 2006; Goldsmith, Hamilton, and Darity 2006, 2007; Hersch 2006; Rangel 2007). For example, using survey data from the United States, Goldsmith, Hamilton, and Darity (2007) find evidence con-sistent with the notion that the interracial and intraracial wage gap increases as the skin tone of the black worker darkens. Analogously, Hersch (2006) finds evidence that black Americans with lighter skin tone tend to have higher educational attain-ment than those with darker skin tone. Allowing the possibility that the policy might impact applicants and students of different skin tone in different ways, this paper estimates separate effects by self-reported race/skin tone (branco, pardo, preto) and by skin tone quintile derived from photo ratings.
758 The Journal of Human Resources
Table 1
Definition of Portuguese Racial Terms
Self-reported race (“What is your race/color?”)
Branco Light-skinned Note that although the three terms are colors, their social meaning encompasses more than skin tone.
Pardo Brown-skinned Preto Dark-skinned
Self-reported black identity (“Do you consider yourselfnegro?”) Negro Black/Afro-Brazilian
identity
Mostpretosand somepardosconsider themselvesnegro, while mostbrancosand somepardosdo not.
Note: The first question appears on surveys conducted by the authors, university, and Brazilian Statistical Agency (IBGE). It is Brazil’s standard race question. The second appears on surveys conducted by the authors and university. Recall that quotas at UnB are fornegros.
the United States largely demonstrate a preference for self-identifying as white and an aversion to self-identifying as black. They emphasize that racial self-identification involves choice and suggest that future research on race and social outcomes treat race as an endogenous variable. Theories of identity are complex and challenging to test. This paper is one of the few to study the construction of racial identity in the context of a relatively simple policy change. Isolating one dimension of the dynamic forces that shape identity, this paper offers evidence that racial identity may respond to the incentives created by an affirmative action policy.
III. Background and Policy
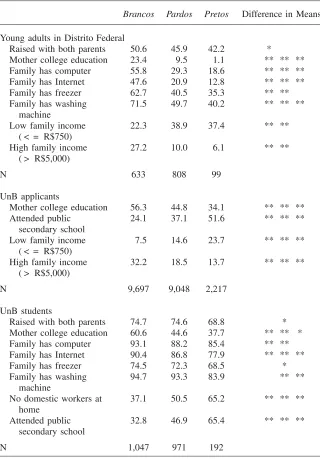
Forever tarnished is Brazil’s image as a perfect racial democracy. Many scholars have documented significant racial disparities in a number of out-comes (Francis and Tannuri-Pianto 2012; Lovell and Wood 1998; Telles 2004; Theo-doro et al. 2008; Wood and Lovell 1992). For clarity, Table 1 defines the Portuguese racial terms that we use throughout the paper. Table 2 illustrates the correlations between race and socioeconomic status. In the top panel, statistics for young adults (15–24-year-olds) living in Distrito Federal are based on a national survey of Bra-zilians (PNAD 2004). In the middle and bottom panels, statistics for UnB applicants and students are based on data obtained by the authors. Echoing a point that many other papers make, the table shows that pretos tend to have lower socioeconomic status thanpardos, andpardostend to have lower socioeconomic status than bran-cos.
Francis and Tannuri-Pianto 759
Table 2
Race and Socioeconomic Status (in percentages)
Brancos Pardos Pretos Difference in Means
Young adults in Distrito Federal
Raised with both parents 50.6 45.9 42.2 *
Mother college education 23.4 9.5 1.1 ** ** **
Family has computer 55.8 29.3 18.6 ** ** **
Family has Internet 47.6 20.9 12.8 ** ** **
Family has freezer 62.7 40.5 35.3 ** **
Family has washing
Mother college education 56.3 44.8 34.1 ** ** **
Attended public
Raised with both parents 74.7 74.6 68.8 *
Mother college education 60.6 44.6 37.7 ** ** *
Family has computer 93.1 88.2 85.4 ** **
Family has Internet 90.4 86.8 77.9 ** ** **
Family has freezer 74.5 72.3 68.5 *
Family has washing
Sources: PNAD (top panel), QSC (middle), PSEU (bottom).
760 The Journal of Human Resources
admitted through the “vestibular” system. Applicants typically apply to only two or three universities. To apply to UnB, which has biannual admissions, applicants select one academic department and take a UnB-specific entrance exam called the vestib-ular. The overall score on the vestibular is the primary basis for admission, and the minimum score for selection varies by department. Applicants are either admitted or rejected by their chosen department. About three-fourths of those admitted ma-triculate. Those who are rejected often retake the vestibular, some selecting the same department and others selecting a less competitive one.
UnB implemented racial quotas in July 2004 making it the first federal university in the country and the first university in the region to have a race-targeted admissions policy. The administration adopted the policy without public vote or debate and announced it on June 6, 2003. The principal objectives of the policy are to reduce racial inequality, address historical injustices, raise diversity on campus, and enhance awareness of blacks in society. To participate, upon registration for the vestibular, applicants must elect to apply under the quota system and self-identify asnegro. 20 percent of each department’s allotted vestibular admissions slots are reserved for students who self-identify asnegroand choose admission through racial quotas. To prevent abuse of the policy, all candidates selected for admission under the quota system are interviewed by a university panel. UnB provides to quota students an array of programs that support their academic and social development, including tutoring services, public seminars on the value of blacks in society, and a campus meeting space to study and interact.
Table 3 provides a snapshot of admissions standards in 2004. For individuals who applied under the nonquota system, the nonquota admissions score (NQ) was the minimum score necessary for selection. For those who applied under the quota system, the quota admissions score (Q) was the minimum score necessary for se-lection. Minimum scores were entirely determined by the number of admissions slots allocated to the department (20 percent of which were reserved for quota applicants) and the vestibular scores of those applying to the department under the nonquota and quota systems.4 In the table,NQandQare displayed as percentile scores. As is apparent, variability in admissions standards across departments was enormous. Extremely selective courses of study were medicine, law, and engineering, whereas less selective courses were geography, library science, and fine arts. For most de-partments, the nonquota admissions score was greater than the quota admissions score, indicating that standards were lower for some quota students. Most applicants had scores belowQand were not admitted. Those admitted included nonquota ap-plicants with scores above NQ, quota apap-plicants with scores aboveNQ, and quota applicants with scores betweenQandNQ. If the quota system had not existed, some of the nonquota applicants with scores betweenQandNQwould have been admit-ted, while some of the quota applicants with scores betweenQandNQwould not have been.
Francis and Tannuri-Pianto 761
IV. Data and Empirical Strategy
A. Student Sample (PSEU)
The authors conducted a survey of UnB students who were admitted through the vestibular system and matriculated between 2003 and 2005, a period including two admissions cycles before quotas (2-2003 and 1-2004) and three after quotas (2-2004, 1-2005, and 2-2005). We refer to this survey by its Portuguese acronym PSEU. Interviews, done online and face-to-face with an interviewer, covered a variety of topics: family background, preuniversity education, university admissions, university education, employment, expectations, and self-identified race. Photos of those stu-dents who participated in face-to-face interviews and admissions/academic records of all students were also obtained by the authors.
Data collection was as follows. UnB provided the authors a database with the names and contact information of students in the population of interest. Interviews were completed between May 2007 and August 2008 beginning with the oldest cohort (2-2003) and ending with the youngest (2-2005). An initial invitation to participate in the face-to-face interview was done by email and a secondary invitation done by phone. We attempted to contact all students in the population of interest by email, but due to resource constraints, we were only able to attempt to contact a random subset of students by phone. Face-to-face interviews took place in the UnB Department of Economics. With consent, a photo was taken of the respondent’s student identification card, which had a standard photo taken upon matriculation. An invitation to participate in the online interview was sent by email to those who had not yet responded to our initial invitation. To minimize the salience of race and affirmative action in the recruitment process, the title of the survey was general (“University Education Survey”), and neither race nor affirmative action was raised in any contacts with potential respondents. 2,286 students in the population of in-terest completed the PSEU, which amounts to a participation rate of almost 40 percent. 799 face-to-face interviews were conducted, and 748 of these had viable photos. Some photos were taken but were too blurry to be useful, and others were not taken because the camera was temporarily out of batteries. About 9 percent of the email addresses provided by the university were invalid (misspelled or deacti-vated), and about 25 percent of the phone numbers were incorrect.
762
The
Journal
of
Human
Resources
Table 3
Admissions by Department
# Nonquota applicants # Quota applicants Nonquota
admissions
Quota
admissions Above Between Below Above Between Below Department score (NQ) score (Q) NQ NQ & Q Q NQ NQ & Q Q
Medicine 99.8 99.5 29 31 1,876 4 3 212
Law 98.0 94.6 40 80 1,566 5 5 412
Robotic engineering 97.1 79.1 24 85 249 1 5 25 International relations 95.4 91.7 32 33 711 3 5 47 Electrical engineering 94.7 85.0 39 42 190 4 4 26 Engineering of information 93.2 56.8 25 68 150 0 7 14
Computer science 92.2 83.1 25 41 472 4 2 63
Biology 91.5 45.0 27 148 277 1 6 41
Social communication 91.1 73.3 55 164 893 2 11 134
Dentistry 90.3 61.9 19 55 246 2 2 27
Mechanical engineering 89.7 73.9 35 47 206 3 5 25
Political science 87.9 82.5 35 25 281 5 3 59
Economics 87.8 76.4 37 40 217 0 8 36
Pharmaceutical science 87.8 78.9 27 30 287 0 6 32
Architecture 85.1 54.8 26 82 154 0 6 13
Nutrition science 84.7 42.3 23 103 335 1 4 50
Industrial design 84.4 61.2 16 51 78 0 4 8
Psychology 83.9 68.7 30 53 496 2 5 83
Francis
and
T
annuri-Pianto
763
Civil engineering 81.5 11.9 41 151 91 0 4 8
Veterinary medicine 81.4 57.1 25 63 362 2 4 32
History 79.7 56.2 24 47 247 0 6 72
Business 77.4 65.6 45 40 402 6 4 61
Nursing 74.8 74.8 22 0 456 6 0 142
Language translation 72.5 28.3 24 99 116 1 4 24
Agronomy 71.7 38.9 36 80 321 0 8 57
Statistics 70.9 62.4 20 10 134 1 4 16
Social sciences 68.8 58.2 52 31 292 6 6 83
Forest engineering 68.3 53.3 34 28 250 0 8 48
Chemistry 68.1 10.5 33 83 72 3 3 16
Portuguese 65.8 56.9 22 5 146 3 3 40
Physical education 64.6 46.9 33 35 644 3 5 180
Mathematics 62.6 11.6 33 73 72 2 5 24
Geography 62.4 61.3 28 0 245 4 2 79
Accounting 61.9 59.9 34 5 276 7 2 60
Philosophy 59.8 35.1 21 16 69 1 3 25
Geology 52.1 49.2 27 4 126 4 1 19
Social work 48.2 47.5 24 0 246 5 1 68
Library science 40.9 28.3 34 15 249 5 3 90
Fine arts 40.3 26.5 24 12 103 5 1 13
Teaching 38.4 34.3 63 14 490 14 1 161
Performing arts 12.9 12.9 15 0 24 1 0 6
764 The Journal of Human Resources
case, it may be helpful to mitigate potential bias through weighting. To do so, we run a probit regression of sample participation on the set of characteristics in Ap-pendix Table 1 and construct sample weights equivalent to the inverse of the pre-dicted probability of participation.
B. Applicant Sample (QSC)
UnB provided the authors with a survey of applicants who took the vestibular exam between 2004 and 2005, a period including one admissions cycle before quotas (1-2004) and three after quotas (2-2004, 1-2005, and 2-2005). We refer to this survey by its Portuguese acronym QSC. Applicants submitted the 18-question QSC upon registration for the vestibular, that is, prior to taking the exam. It asked about self-identified race, socioeconomic status, and vestibular preparation. 1-2004 was the first admissions cycle that included questions on racial identity. However, note that the QSC was not the formal document with which applicants identified themselves as negro to apply under racial quotas. 24,252 applicants in the population of interest completed the QSC, which amounts to a participation rate of about 50 percent. An important caveat is that response rates were falling during the period from roughly 84 percent in 2-2003 to 36 percent in 2-2005. Appendix Table 1 suggests that there are many significant differences between the QSC and population. Given these sub-stantial biases, it is vital to use sample weights.
C. Empirical Strategy
In what follows, we estimate the effect of racial quotas on preuniversity effort, college academic performance, and black identity. To do so, we employ a difference-in-difference model interpreting the policy as a treatment on individuals with brown or dark skin tone. The following equation is estimated:
pardo post−quotas pardo preto post−quotas preto
Y=τ *(I *R ) +τ *(I *R )
(1)
r r t t
+
∑
δ *R +∑
β*T +γ•X+ε,r t
where Y is an outcome of interest, I is an indicator for application/matriculation postquotas, Ris an indicator for self-reported race/skin tone (pardo, preto, Asian, Indigenous), Tis an indicator for semester of application/matriculation, andXis a vector of controls for socioeconomic status, gender, and subject of study. Thus, the effect of racial quotas on pardos isτpardo, and the effect of racial quotas onpretos is τpreto.
Making use of photos taken in the face-to-face interviews, we asked a panel of Brazilian reviewers to rate the skin tone of the subject in each photo from one (light) to seven (dark). Scores were standardized by reviewer, standardized scores were averaged by photo, and average standardized scores were sorted into quintiles. In the tables and text, “lightest quintile” indicates the lowest 20 percent of average standardized scores, “second quintile” indicates the next 20 percent, and so on. Appendix Table A1 provides the distribution of self-reported race by skin tone quin-tile. The following equation is estimated:
q post−quotas q q q t t
Y=
∑
τ *(I *Q ) +∑
δ *Q +∑
β*T +γ•X+ε, (2)Francis and Tannuri-Pianto 765
where Y is an outcome of interest, I is an indicator for application/matriculation postquotas,Qis an indicator for skin tone quintile,Tis an indicator for semester of application/matriculation, and X is a vector of controls for socioeconomic status, gender, and subject of study. Thus, the effect of racial quotas on skin tone quintile qis τq.
V. Results and Discussion
A. Effects on the Student Profile
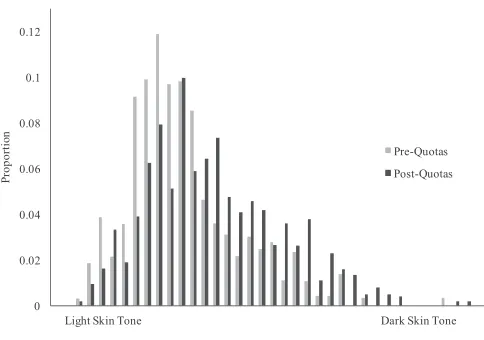
The principal objective of the policy was to raise the proportion of black and so-cioeconomically disadvantaged students at UnB. Based on the PSEU, Table 4 com-pares the racial composition of students before and after quotas. The percentage of students who self-identified asnegro, or black, increased from 15.3 percent prequotas to 20.6 percent postquotas. While the percentage of students who self-reported as preto (dark-skinned) increased from 5.6 percent to 9.0 percent, the percentage who self-reported as pardo (brown-skinned),branco (light-skinned), Asian, and indige-nous remained roughly constant. Although Table 4 suggests that racial quotas raised the proportion of negros, using self-reported race might be problematic. Figure 1 depicts histograms of average standardized skin tone based on ratings of student photos by a panel of Brazilian reviewers. Light skin tone is toward the left and dark skin tone toward the right. From pre to postquotas, the distribution of skin tone shifts to the right, which illustrates that students matriculating in the postquota period had darker skin tone than students matriculating in the prequota period.
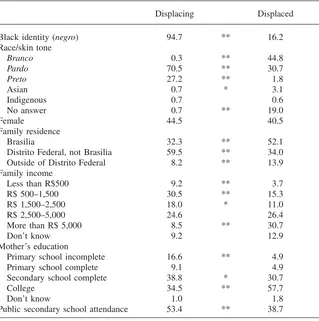
However, the question remains whether racial quotas also raised the proportion of socioeconomically disadvantaged students. Using the QSC, Table 5 compares applicants who were admitted but would not have been if the quota system had not existed (displacing) with those who were not admitted but would have been if the quota system had not existed (displaced). To identify the two groups, it was assumed that the counterfactual removal of the quota system would not have affected who applied or performance on the vestibular, and that the number of applicants admitted, by semester and department, would have remained identical.5About 95 percent of the displacing identified as negro compared to 16 percent of the displaced.6 71 percent and 27 percent of the displacing werepardoandpreto, respectively, while about 31 percent and 2 percent of the displaced were. Furthermore, we find that
5. For each of the three admissions cycles following the implementation of quotas, all applicants were ranked by department and vestibular score; applicants admitted counterfactually (if the quota system had not existed) were those with the top nscores in each department, wherenrepresents the number of departmental admissions slots; those applicants admitted counterfactually but not actually were designated as displaced, and those admitted actually but not counterfactually were designated as displacing. In this way, 352 displaced and 352 displacing applicants were identified based on comprehensive admissions records.
766 The Journal of Human Resources
Table 4
Race Before and After Quotas (in percentages)
Prequotas Postquotas
Black identity
Negro 15.3 ** 20.6
Race/skin tone
Branco 47.8 44.8
Pardo 43.3 42.8
Preto 5.6 ** 9.0
Asian 1.9 1.5
Indigenous 1.4 1.9
N 789 1,497
Source: PSEU.
Note: A double asterisk indicates significant difference in proportions at the 5 percent level, and a single asterisk indicates significance at the 10 percent level. Sample weights are used.
Figure 1
Distribution of Skin Tone Source: PSEU.
Francis and Tannuri-Pianto 767
Table 5
Comparing Displacing and Displaced Applicants (in percentages)
Displacing Displaced
Black identity (negro) 94.7 ** 16.2 Race/skin tone
Branco 0.3 ** 44.8
Pardo 70.5 ** 30.7
Preto 27.2 ** 1.8
Asian 0.7 * 3.1
Indigenous 0.7 0.6
No answer 0.7 ** 19.0
Female 44.5 40.5
Family residence
Brasilia 32.3 ** 52.1
Distrito Federal, not Brasilia 59.5 ** 34.0 Outside of Distrito Federal 8.2 ** 13.9 Family income
Less than R$500 9.2 ** 3.7 R$ 500–1,500 30.5 ** 15.3 R$ 1,500–2,500 18.0 * 11.0
R$ 2,500–5,000 24.6 26.4
More than R$ 5,000 8.5 ** 30.7
Don’t know 9.2 12.9
Mother’s education
Primary school incomplete 16.6 ** 4.9 Primary school complete 9.1 4.9 Secondary school complete 38.8 * 30.7
College 34.5 ** 57.7
Don’t know 1.0 1.8
Public secondary school attendance 53.4 ** 38.7
Source: QSC.
Note: A double asterisk indicates significant difference in proportions at the 5 percent level, and a single asterisk indicates significance at the 10 percent level. From 2-2004 to 2-2005, the displacing were those applicants who were admitted but would not have been if the quota system had not existed, while the displaced were those who were not admitted but would have been if the quota system had not existed. We identified 352 displacing and 352 displaced applicants. For most variables in the table, sample size is 466, since not all applicants completed the QSC; gender and family residence have no missing values.
768 The Journal of Human Resources
families living in Brasilia (PDAD 2004). Differences in self-reported family income and public secondary school attendance paint the same picture.7,8
B. Effects on Preuniversity Effort
Examining both applicants and students, we estimate the effect of racial quotas on effort in university admissions. A race-based affirmative action program may theo-retically have two kinds of effects on effort (Fryer and Loury 2005a; Fryer, Loury, and Yuret 2008; Holzer and Neumark 2000). On one hand, affirmative action may increase the marginal return to actions that raise the likelihood of college admission. Changes in admissions standards might relocate some individuals who otherwise would have had little chance of selection to the margin of selection, thereby inspiring effort. On the other hand, affirmative action may decrease the marginal return to actions that raise the likelihood of admission. Changes in admissions standards might relocate some individuals who otherwise would have been at the margin of selection to an intramarginal position, thus reducing effort. Hence, although racial quotas have an unambiguous effect on the conditional chances of admission, they have an am-biguous effect on returns to effort. Applying this logic to Brazil, it is important to remember that the margin of selection is actually multi-dimensional, as there exists a hierarchy of departments with vastly different minimum scores for selection. To the extent that the objective is to gain admission to the most selective department possible, few applicants are intramarginal.
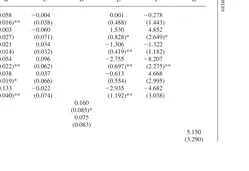
To begin, we consider two measures of effort: the number of times that an ap-plicant took the UnB vestibular and whether an apap-plicant/student took acursinho, a 6–12-month course offered by a private company to prepare for the UnB vestibular. While both variables are actions informative about returns to effort, they are imper-fect, and it is not obvious what ideal measures one could obtain in practice. Table 6 displays the regressions. As Columns A and B indicate, for each of the measures of effort, the coefficient onpardoapplicant in the postquota period is positive and significant, whereas the coefficient onpretoapplicant in the postquota period is not significant. This may suggest that racial quotas increased the number of times that a self-reported pardo applicant took the vestibular by about 0.24 and increased the likelihood that a pardo applicant took a cursinho by about 5.8 percentage points. Alternatively, this may suggest that racial quotas tended to attractpardoapplicants who were more likely to take the vestibular multiple times and more likely to take a cursinho. Comparing the profile of UnB applicants pre- and postquotas may help to investigate the issue of selection into the applicant pool. Appendix Table 2, which the reader can find on the author’s website, indicates that postquotas the applicant pool became morepardo, slightly less female, and slightly more socioeconomically advantaged. For this reason, we control for these factors in the regressions. Note
7. Building from this exercise, Francis and Tannuri-Pianto (2012) compare and contrast racial quotas with hypothetical alternative policies.
Francis and Tannuri-Pianto 769
that these factors do not appear to explain the results, that is, the pool is less female and more socioeconomically advantaged, but female and public secondary school are positively associated with cursinho. Nevertheless, it is still possible that we are not adequately accounting for changes in the applicant pool.
We also estimate the effect of quotas on the likelihood that students took a cur-sinho to prepare for the UnB vestibular. In Column C, neither the coefficient on pardo student in the postquota period nor that on preto student in the postquota period is significant, so even if there may be an effect on pardo applicants, there may not be an effect onpardo students. However, in Column D, the coefficient on the lightest quintile in the postquota period is positive and significant, which may mean that students with the lightest skin tone were more likely to take acursinho following the introduction of racial quotas.
Given that the margin of selection is multidimensional, it remains to establish whether the adoption of quotas in admissions inspired applicants/students with rela-tively dark skin tone to apply to more selective departments. Evidence on choice of department would yield insight regarding returns to effort. Based on complete ad-missions data from 2-2004, UnB departments were assigned values according to their rank by minimum score for selection; the most selective departments were assigned the highest values and the least selective the lowest values. Using this measure, the regressions in Columns E and F demonstrate that for applicants and students,preto in the postquota period is positive and significantly related to selec-tivity of department, whilepretois negative and significantly related. Thus, although self-reportedpretoapplicants/students tended to apply to less selective departments thanbrancos, the racial gap in selectivity decreased with the implementation of racial quotas. This may suggest thatpretosare better characterized as marginal than intra-marginal, indicating that it is unlikely that returns to effort had diminished with the introduction of quotas. Column G, which makes use of photo ratings, confirms that selectivity of department varied significantly with skin tone but does not confirm that the policy narrowed the gap in selectivity, as the coefficient on darkest quintile in the postquota period is positive but insignificant. Taken together, the findings in the table imply that racial quotas had not reduced the preuniversity effort of appli-cants or students. Some evidence, albeit tenuous, may signify that the policy raised effort.
C. Effects on Racial Gaps in College Academic Performance
Focusing on UnB students, we examine the effect of quotas on racial gaps in college GPA. Racial disparities in college academic performance reflect a myriad of his-torical, social, and behavioral factors. The adoption of racial quotas might impact such disparities by modifying behaviors and/or the composition of students enrolled. Regardless of the underlying mechanisms, changes in racial gaps in GPA measure the extent to which the policy ameliorates or exacerbates college “mismatch.” Table 7 displays the regressions. Grades range from zero (bad) to five (good); the mean and standard deviation of GPA are 3.82 and 0.65, respectively. The first three col-umns include students in all departments, and the last six colcol-umns include students in only the 50 percent most selective departments.
in-770
The
Journal
of
Human
Resources
Table 6
Preuniversity Effort
Dependent Variable:
Vestibular
Attempts Cursinho Selectivity of Department
Variable A B C D E F G
Pardo × postquotas 0.240 0.058 −0.004 0.001 −0.278
(0.043)** (0.016)** (0.038) (0.488) (1.443)
Preto × postquotas 0.078 −0.003 −0.060 1.530 4.852
(0.071) (0.027) (0.071) (0.828)* (2.649)*
Pardo 0.043 0.021 0.034 −1.306 −1.322
(0.036) (0.014) (0.032) (0.419)** (1.182)
Preto 0.119 0.054 0.096 −2.755 −8.207
(0.059)** (0.022)** (0.062) (0.697)** (2.275)**
Asian −0.040 0.038 0.037 −0.613 4.668
(0.053) (0.019)* (0.066) (0.554) (2.995) Indigenous 0.114 0.133 −0.022 −2.935 −4.682
(0.120) (0.040)** (0.074) (1.192)** (3.038) Lightest quintile × postquotas 0.160
(0.085)* Second quintile × postquotas 0.075
(0.083)
Third quintile × postquotas 5.150
Francis
and
T
annuri-Pianto
771
Fourth quintile × postquotas −0.077 4.604
(0.076) (3.261)
Darkest quintile × postquotas −0.028 2.495
(0.090) (3.381)
Lightest quintile −0.189
(0.065)**
Second quintile −0.176
(0.063)**
Third quintile −6.282
(2.531)**
Fourth quintile 0.024 −5.994
(0.056) (2.722)**
Darkest quintile −0.033 −7.741
(0.076) (2.883)**
2-2003 −0.038 0.075 −0.323 0.046
(0.030) (0.059) (1.168) (2.013) 1-2004 −0.078 −0.070 −0.103 −0.065 0.148 0.553 1.691
(0.027)** (0.010)** (0.037)** (0.065) (0.300) (1.333) (2.442) 1-2005 0.125 −0.021 −0.089 −0.123 1.093 0.613 1.817
(0.028)** (0.010)** (0.030)** (0.052)** (0.301)** (1.138) (1.948) 2-2005 −0.608 0.029 −0.038 −0.022 1.552 0.039 0.342
(0.029)** (0.010)** (0.023)* (0.038) (0.300)** (0.900) (1.543) Gender/socioeconomic controls Yes Yes Yes Yes Yes Yes Yes Subject area controls Yes Yes Yes Yes No No No Applicant or student sample App App Stu Stu App Stu Stu
N 24,252 24,189 2,244 729 24,252 2,253 731
Sources: QSC (Columns A–B, E), PSEU (Columns C–D, F–G).
772
The
Journal
of
Human
Resources
Table 7
College Academic Performance
Dependent Variable: College Grade Point Average (GPA)
Variable A B C D E F G H I
For all departments For 50 percent most selective departments
Pardo × postquotas −0.062 0.020 0.044
(0.060) (0.080) (0.079)
Preto × postquotas 0.012 0.140 0.204
(0.115) (0.190) (0.195)
Pardo −0.070 −0.136 −0.131
(0.047) (0.063)** (0.062)**
Preto −0.128 −0.338 −0.300
(0.100) (0.170)** (0.175)*
Asian 0.000 −0.081 −0.120
(0.085) (0.113) (0.117)
Indigenous −0.362 −0.299 −0.249
(0.109)** (0.137)** (0.131)*
Third quintile × postquotas 0.091 0.316 0.331
(0.139) (0.161)* (0.152)**
Fourth quintile × postquotas −0.102 0.076 0.130
(0.132) (0.176) (0.169)
Darkest quintile × postquotas −0.031 0.160 0.260
(0.139) (0.219) (0.223)
Third quintile −0.164 −0.200 −0.194
Francis
and
T
annuri-Pianto
773
Fourth quintile 0.002 −0.088 −0.074
(0.106) (0.137) (0.130)
Darkest quintile −0.111 −0.228 −0.212
(0.121) (0.182) (0.190)
Displacing students −0.256 −0.330 −0.170
(0.070)** (0.087)** (0.098)*
Displaced students −0.083 −0.101 −0.059
(0.065) (0.084) (0.083)
2-2003 0.002 0.120 0.020 0.054 0.035 0.135 0.096 0.022 0.007
(0.051) (0.081) (0.040) (0.064) (0.062) (0.111) (0.109) (0.055) (0.054) 1-2004 0.002 0.227 0.023 0.039 0.002 0.364 0.328 0.012 −0.022
(0.058) (0.100)** (0.050) (0.077) (0.075) (0.141)** (0.137)** (0.070) (0.067) 1-2005 −0.066 0.102 −0.062 −0.020 −0.019 0.100 0.061 −0.014 −0.014
(0.055) (0.072) (0.055) (0.070) (0.069) (0.100) (0.097) (0.068) (0.069) 2-2005 −0.143 −0.000 −0.152 −0.087 −0.057 0.045 0.064 −0.102 −0.066
(0.040)** (0.063) (0.041)** (0.055) (0.055) (0.094) (0.092) (0.055)* (0.056)
Vestibular score 0.169 0.193 0.153
(0.028)** (0.047)** (0.031)**
Gender/socioeconomic controls Yes Yes Yes Yes Yes Yes Yes Yes Yes
Subject area controls Yes Yes Yes Yes Yes Yes Yes Yes Yes
Applicant or student sample Stu Stu Stu Stu Stu Stu Stu Stu Stu
N 2,253 731 2,253 1,136 1,136 373 373 1,136 1,136
Source: PSEU.
774 The Journal of Human Resources
digenous is significant. Restricting the sample to students in the 50 percent most selective departments uncovers additional findings. Column D reveals significant disparities, especially betweenbrancosandpretos. The coefficients onpardoin the postquota period and preto in the postquota period are insignificant, so the policy did not appear to widen or narrow racial disparities among students in selective departments. Controlling for vestibular score in Column E, racial gaps in GPA slightly decrease in magnitude but remain significant indicating that they are not merely an artifact of differential performance on the vestibular. Nevertheless, Col-umns F and G do not yield evidence for the existence of racial disparities; the puzzling coefficient on third quintile in the postquota period may perhaps be ex-plained by changes in the composition of students and/or low sample size.
It is also fruitful to compare the academic performance of displacing and displaced students.9As Column C shows, the GPA of displaced students is lower than that of intramarginal students but not significantly so, while the GPA of displacing students is significantly lower than that of displaced and intramarginal students. Restricting the sample to students in the 50 percent most selective departments (Column H) widens the gap in GPA between displacing students and everyone else. That differ-ence is roughly the same as the differdiffer-ence betweenbrancosandpretosin Column D. However, controlling for vestibular score in Column I, the coefficient on dis-placing students falls to the extent that it is no longer significantly different from the coefficient on displaced students.
In summary, there may have been modest racial disparities in GPA among students in selective departments, but the introduction of racial quotas did not seem to impact these in any way. Displacing students had somewhat lower GPAs than displaced and intramarginal students, an outcome partially attributable to differential performance on the vestibular. Thus, the evidence is inconsistent with large “mismatch” effects with respect to college GPA (see Rothstein and Yoon, 2008). Factors independent of the policy, including racial differences arising prior to college attendance, appear to be driving any racial disparities in academic performance.
D. Effects on Racial Identity
At UnB, quotas are for negros. Given the competitiveness of admissions, there is substantial incentive to self-identify as black. Moreover, the university provides quota students with an array of programs that reinforce and foster investments in black identity, including a space on campus to study, meet, and have activities. Therefore, the policy of racial quotas may have caused some students to consider themselves black thus placing them on a new life path, while it may have caused others to self-identify as black solely for the purpose of admissions. One of the main empirical challenges is to differentiate between actual change in black identity and racial misrepresentation. Actual change is enduring, substantial, and genuine,
Francis and Tannuri-Pianto 775
whereas misrepresentation is temporary, superficial, and opportunistic. Although we rely on both the QSC and PSEU to measure black identity, the PSEU better mini-mizes misrepresentation. PSEU respondents had little incentive to misrepresent themselves because they had already matriculated, understood that their responses were absolutely confidential, and were unaware of the research objectives.
We begin the analysis by using the QSC to estimate the effect of racial quotas on black identity. The first two columns of Table 8 involve the sample of applicants. The coefficients on both pardo and preto applicants in the postquota period are positive and significant. This may suggest that racial quotas increased the likelihood that a pardo applicant self-identified as negro by about 25 percentage points and increased the likelihood that a preto applicant self-identified asnegro by about 3 percentage points. Alternatively, this may suggest that racial quotas attractedpardo applicants who tended to consider themselves black. Appendix Table 2, which the reader can find on the author’s website, may help to shed light on the issue of selection into the applicant pool. The appendix table shows that postquotas the ap-plicant pool became morenegroand morepardo, which certainly does not rule out the possibility that the rise in black identity was attributable to change in the appli-cant pool. More evidence is required to distinguish between the hypotheses.
The last six columns of Table 8 involve the sample of students who completed both the QSC and the PSEU. They responded to the same race questions at two points in time, first as an applicant and later as a student. In Columns C and D, the dependent variable isnegroon the QSC. Here, the results mirror the results obtained with applicants. It appears that racial quotas increased the likelihood that pardo students self-identified asnegroon the QSC by about 27 percentage points. In Col-umns E to H, the dependent variable is negro on the QSC and non-negro on the PSEU. If change in the applicant pool explained the increase in black identity on the QSC, we would expect consistency between the QSC and PSEU. However, the evidence indicates otherwise. The coefficient on pardo in the postquota period is positive and significant, while the coefficient on fourth quintile in the postquota period is positive, though insignificant. This may suggest that quotas raised, by about 15 percentage points, the likelihood thatpardosself-identified asnegroon the QSC but not on the PSEU. Hence, there was systematic inconsistency in black identity associated with the adoption of quotas. If results from students who responded to both surveys may provide insight more generally, they imply that part of the rise in black identity amongpardoson the QSC was not a manifestation of change in the applicant pool but of racial misrepresentation.
776
The
Journal
of
Human
Resources
Table 8
Black Identity on QSC
Dependent Variable:
Negroon QSC Negroon QSC and non-negroon PSEU
Variable A B C D E F G H
Pardo × postquotas 0.246 0.245 0.267 0.154 0.150
(0.013)** (0.013)** (0.064)** (0.053)** (0.054)**
Preto × postquotas 0.025 0.027 −0.027 −0.001 0.010 (0.013)** (0.013)** (0.042) (0.035) (0.040)
Pardo 0.257 0.248 0.149 0.046 0.049
(0.011)** (0.011)** (0.055)** (0.044) (0.045)
Preto 0.915 0.894 0.886 −0.062 −0.053
(0.010)** (0.010)** (0.036)** (0.027)** (0.034)
Asian 0.065 0.058 −0.079 −0.073 −0.083
(0.010)** (0.010)** (0.032)** (0.026)** (0.038)**
Indigenous 0.376 0.371 0.247 0.202 0.207
(0.041)** (0.041)** (0.130)* (0.127) (0.127)
Third quintile × postquotas 0.006 −0.060 −0.093
(0.162) (0.141) (0.137)
Fourth quintile × postquotas 0.399 0.176 0.153
Francis
and
T
annuri-Pianto
777
Darkest quintile × postquotas 0.374 0.090 0.080
(0.181)** (0.087) (0.096)
Third quintile 0.068 0.090 0.121
(0.143) (0.122) (0.118)
Fourth quintile −0.048 −0.029 0.004
(0.126) (0.097) (0.109)
Darkest quintile 0.305 −0.099 −0.076
(0.172)* (0.068) (0.086)
1-2004 0.076 0.075 0.055 0.093 0.060 0.066 0.066 0.074
(0.005)** (0.005)** (0.036) (0.109) (0.033)* (0.034)** (0.078) (0.082)
1-2005 0.088 0.092 0.182 0.202 0.182 0.180 0.243 0.243
(0.006)** (0.006)** (0.038)** (0.064)** (0.036)** (0.036)** (0.066)** (0.069)**
2-2005 0.090 0.095 0.192 0.238 0.213 0.209 0.295 0.310
(0.007)** (0.007)** (0.035)** (0.067)** (0.033)** (0.033)** (0.062)** (0.061)**
Gender/socioeconomic controls No Yes Yes Yes No Yes No Yes
Subject area controls No Yes Yes Yes No Yes No Yes
Applicant or student sample App App Stu Stu Stu Stu Stu Stu
N 23,971 23,971 951 324 965 951 331 324
Sources: QSC (Columns A–H), PSEU (Columns C–H).
778 The Journal of Human Resources
Table 9
Difference in Black Identity between QSC and PSEU (in percentages)
Brancos Pardos Pretos
Negro Prequotas Postquotas Prequotas Postquotas Prequotas Postquotas
QSC PSEU
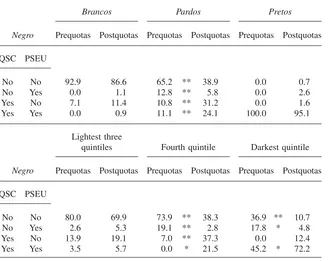
No No 92.9 86.6 65.2 ** 38.9 0.0 0.7 No Yes 0.0 1.1 12.8 ** 5.8 0.0 2.6 Yes No 7.1 11.4 10.8 ** 31.2 0.0 1.6 Yes Yes 0.0 0.9 11.1 ** 24.1 100.0 95.1
Lightest three
quintiles Fourth quintile Darkest quintile
Negro Prequotas Postquotas Prequotas Postquotas Prequotas Postquotas
QSC PSEU
No No 80.0 69.9 73.9 ** 38.3 36.9 ** 10.7 No Yes 2.6 5.3 19.1 ** 2.8 17.8 * 4.8 Yes No 13.9 19.1 7.0 ** 37.3 0.0 12.4 Yes Yes 3.5 5.7 0.0 * 21.5 45.2 * 72.2
Sources: QSC, PSEU.
Note: A double asterisk indicates significant difference in proportions at the 5 percent level, and a single asterisk indicates significance at the 10 percent level. Skin tone quintiles are based on ratings of student photos. The sample consists of students who completed both the QSC and PSEU. Sample weights are used.
although the overall rate of consistency between surveys decreased forpardos, the percentage who reported that they werenegroon both surveys increased from 11.1 percent to 24.1 percent.
Francis and Tannuri-Pianto 779
Table 10
Black Identity on PSEU (in percentages)
Brancos Pardos Pretos
Prequotas Postquotas Prequotas Postquotas Prequotas Postquotas
Negro
Yes 2.2 2.0 18.8 ** 24.4 100.0 98.2
No 97.8 98.0 81.2 ** 75.6 0.0 1.8
Lightest three quintiles Fourth quintile Darkest quintile
Prequotas Postquotas Prequotas Postquotas Prequotas Postquotas
Negro
Yes 10.9 8.0 20.5 19.8 57.1 ** 77.1
No 89.1 92.1 79.5 80.2 42.9 ** 22.9
Source: PSEU.
Note: A double asterisk indicates significant difference in proportions at the 5 percent level, and a single asterisk indicates significance at the 10 percent level. Skin tone quintiles are based on ratings of student photos. Sample weights are used.
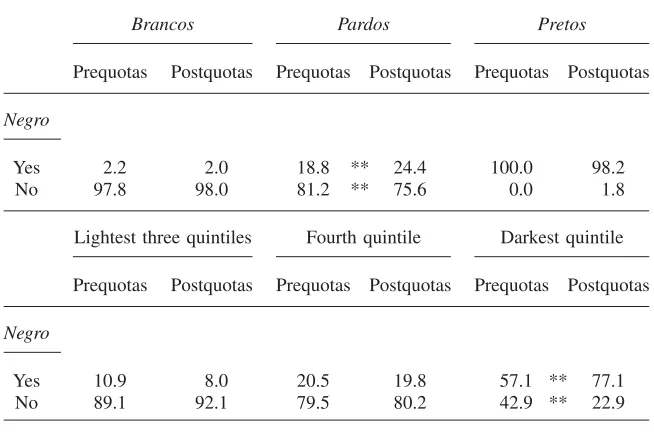
summarize, Table 9 reveals evidence that points to a move toward racial misrepre-sentation among somepardos, especially those in the fourth quintile, but also points to a move toward consistent black identity among otherpardos, especially those in the darkest quintile. In what follows, we explore genuine change in identity using the entire sample of students, not just the subsample of students who completed both surveys.
780 The Journal of Human Resources
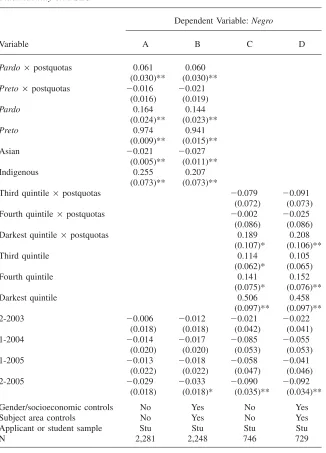
Table 11 explores the effect of racial quotas on black identity with the PSEU and difference-in-difference models. As the table shows, the coefficients on 2-2003 and 1-2004 are not significant in any of the specifications indicating that there was no trend in black identity prior to the implementation of quotas. In Columns A and B, the coefficient onpardo in the postquota period is positive and significant, which may suggest that racial quotas increased the likelihood that a pardo student self-identified asnegroby 6 percentage points. In Columns C and D, the coefficient on darkest quintile in the postquota period is positive and significant. This may suggest that racial quotas increased black identity by roughly 20 percentage points among students with skin tone in the darkest quintile. To elucidate the findings, it is im-portant to understand that of students with skin tone in the darkest quintile, about 47 percent self-identified aspardoand 48 percent aspreto(see Appendix Table A1). Therefore, the table may provide evidence of change in black identity among dark-skinned students. These results are consistent with the incentives created by the policy. Indeed, the incentive to apply under the quota system was substantial given the competitiveness of admissions, and programs for quota students reinforced and fostered investments in black identity. In this way, the policy may have placed some students on a new life path, the initial steps in the dynamic construction of black identity. These results are also consistent with the literature on the determinants of racial identity in economics, sociology, and other social sciences (Darity, Mason, and Stewart 2006; Golash-Boza and Darity 2008; Harris and Sim 2002; Kibria 1997; Lee and Bean 2004; Nagel 1994).
VI. Conclusion
In this paper, we have analyzed a policy that was part of the first-wave of affirmative action programs in Brazil. We find that racial quotas raised the proportion of black and dark-skinned students, and that displacing applicants were from lower socioeconomic status families. The evidence suggests that racial quotas did not reduce the preuniversity effort of either applicants or students. Additionally, there may have been modest racial disparities in college academic performance among students in selective departments, though the policy did not seem to impact these in any way. The findings also suggest that racial quotas induced some indi-viduals to misrepresent their racial identity but inspired other indiindi-viduals, especially the darkest-skinned, to genuinely consider themselves black.
Francis and Tannuri-Pianto 781
Table 11
Black Identity on PSEU
Dependent Variable:Negro
Variable A B C D
Pardo × postquotas 0.061 0.060 (0.030)** (0.030)** Preto × postquotas −0.016 −0.021
(0.016) (0.019)
Pardo 0.164 0.144
(0.024)** (0.023)**
Preto 0.974 0.941
(0.009)** (0.015)** Asian −0.021 −0.027
(0.005)** (0.011)** Indigenous 0.255 0.207
(0.073)** (0.073)**
Third quintile × postquotas −0.079 −0.091 (0.072) (0.073) Fourth quintile × postquotas −0.002 −0.025
(0.086) (0.086) Darkest quintile × postquotas 0.189 0.208
(0.107)* (0.106)**
Third quintile 0.114 0.105
(0.062)* (0.065)
Fourth quintile 0.141 0.152
(0.075)* (0.076)** Darkest quintile 0.506 0.458
(0.097)** (0.097)** 2-2003 −0.006 −0.012 −0.021 −0.022
(0.018) (0.018) (0.042) (0.041) 1-2004 −0.014 −0.017 −0.085 −0.055
(0.020) (0.020) (0.053) (0.053) 1-2005 −0.013 −0.018 −0.058 −0.041
(0.022) (0.022) (0.047) (0.046) 2-2005 −0.029 −0.033 −0.090 −0.092
(0.018) (0.018)* (0.035)** (0.034)**
Gender/socioeconomic controls No Yes No Yes Subject area controls No Yes No Yes Applicant or student sample Stu Stu Stu Stu
N 2,281 2,248 746 729
Source: PSEU.
782 The Journal of Human Resources
Appendix Table A1
Distribution of Self-Reported Race by Skin Tone Quintile (in percentages) Skin tone quintiles (photos)
Lightest Second Third Fourth Darkest Quintile Quintile Quintile Quintile Quintile
Race/skin tone (self-reported)
Branco 81.8 61.3 39.0 22.6 2.6
Pardo 17.2 33.1 52.9 70.1 47.1
Preto 0.0 0.6 2.1 3.7 47.8
Asian 0.0 2.9 3.8 2.3 0.0
Indigenous 0.9 2.2 2.1 1.4 2.4
Source: PSEU.
Note: Quintiles of average standardized skin tone are based on ratings of student photos. Sample size is 748. Sample weights are used.
References
Abdulkadiroglu, Atila. 2005. “College Admissions with Affirmative Action.”International Journal of Game Theory33(4):535–49.
Akerlof, George A., and Rachel E. Kranton. 2000. “Economics and Identity.”Quarterly Journal of Economics115(3):715–53.
———. 2002. “Identity and Schooling: Some Lessons for the Economics of Education.”
Journal of Economic Literature40(4):1167–1201.
Arcidiacono, Peter. 2005. “Affirmative Action in Higher Education: How Do Admission and Financial Aid Rules Affect Future Earnings?”Econometrica73(5):1477–1524.
Austen-Smith, David, and Roland G. Fryer, Jr. 2005. “An Economic Analysis of Acting White.”Quarterly Journal of Economics120(2):551–83.
Bertrand, Marianne, Rema Hanna, and Sendhil Mullainathan. 2010. “Affirmative Action in Education: Evidence from Engineering College Admissions in India.”Journal of Public Economics94(1–2):16–29.
Bodenhorn, Howard. 2006. “Colorism, Complexion Homogamy, and Household Wealth: Some Historical Evidence.”American Economic Review96(2):256–60.
Bucks, Brian. 2004. “Affirmative Access versus Affirmative Action: How Have Texas’ Race-Blind Policies Affected College Outcomes?” Working Paper, Texas Schools Project. Card, David, and Alan B. Krueger. 2005. “Would the Elimination of Affirmative Action Af-fect Highly Qualified Minority Applicants? Evidence from California and Texas.” Indus-trial and Labor Relations Review58(3): 416–34.
Cardoso, Claudete Batista. 2008. “Efeitos da Polı´tica de Cotas na Universidade de Brası´lia: Uma Ana´lise do Rendimento e da Evasa˜o.” Master’s Thesis, Department of Education, University of Brasilia.
Chan, Jimmy, and Erik Eyster. 2003. “Does Banning Affirmative Action Lower College Stu-dent Quality?”American Economic Review93(3):858–72.
Coate, Stephen, and Glenn C. Loury. 1993. “Will Affirmative-Action Policies Eliminate Negative Stereotypes?”American Economic Review83(5):1220–40.
Francis and Tannuri-Pianto 783
Darity, William A., Jr., Jason Dietrich, and Darrick Hamilton. 2005. “Bleach in the Rain-bow: Latin Ethnicity and Preference for Whiteness.”Transforming Anthropology
13(2):103–109.
Darity, William A., Jr., Patrick L. Mason, James B. Stewart. 2006. “The Economics of Iden-tity: The Origin and Persistence of Racial Identity Norms.”Journal of Economic Behav-ior and Organization60(3):283–305.
De Fraja, Gianni. 2005. “Reverse Discrimination and Efficiency in Education.”International Economic Review46(3):1009–31.
Desai, Sonalde, and Veena Kulkarni. 2008. “Changing Educational Inequalities in India in the Context of Affirmative Action.”Demography45(2):245–70.
Dickson, Lisa M. 2006. “Does Ending Affirmative Action in College Admissions Lower the Percent of Minority Students Applying to College?”Economics of Education Review
25(1):109–19.
Donohue, John J., III, and James Heckman. 1991. “Continuous versus Episodic Change: The Impact of Civil Rights Policy on the Economic Status of Blacks.”Journal of Eco-nomic Literature29(4):1603–43.
Eltis, David. 2001. “The Volume and Structure of the Transatlantic Slave Trade: A Reas-sessment.”William and Mary Quarterly58(1):17–46.
Epple, Dennis, Richard Romano, and Holger Sieg. 2008. “Diversity and Affirmative Action in Higher Education.”Journal of Public Economic Theory10(4):475–501.
Ferman, Bruno, and Juliano Assunc¸a˜o. 2005. “Affirmative Action in University Admissions and High School Students’ Proficiency.” Working Paper, Department of Economics, PUC-Rio.
Francis, Andrew M. 2008. “The Economics of Sexuality: The Effect of HIV/AIDS on Ho-mosexual Behavior in the United States.”Journal of Health Economics27(3):675–89. Francis, Andrew M., and Maria Tannuri-Pianto. 2012. “The Redistributive Equity of
Affir-mative Action: Exploring the Role of Race, Socioeconomic Status, and Gender in College Admissions.”Economics of Education Review31(1): 45–55.
Fryer, Roland G., Jr., and Glenn C. Loury. 2005a. “Affirmative Action and Its Mythology.”
Journal of Economic Perspectives19(3):147–62.
———. 2005b. “Affirmative Action in Winner-Take-All Markets.”Journal of Economic In-equality3(3):263–80.
Fryer, Roland G., Jr., Glenn C. Loury, and Tolga Yuret. 2008. “An Economic Analysis of Color-Blind Affirmative Action.”Journal of Law, Economics, and Organization
24(2):319–55.
Fryer, Roland G., Jr., Lisa Kahn, Steven D. Levitt, and Jorg L. Spenkuch. 2008. “The Plight of Mixed Race Adolescents.” NBER Working Paper number 14192.
Golash-Boza, Tanya, and William Darity, Jr. 2008. “Latino Racial Choices: The Effects of Skin Colour and Discrimination on Latinos’ and Latinas’ Racial Self-Identifications.” Eth-nic and Racial Studies31(5):899–934.
Goldsmith, Arthur H., Darrick Hamilton, and William Darity, Jr. 2006. “Shades of Discrimi-nation: Skin Tone and Wages.”American Economic Review96(2): 242–245.
———. 2007. “From Dark to Light: Skin Color and Wages among African-Americans.”
Journal of Human Resources42(4):701–38.
Harris, David R., and Jeremiah Joseph Sim. 2002. “Who is multiracial? Assessing the com-plexity of lived race.”American Sociological Review67(4):614–27.
Hersch, Joni. 2006. “Skin-Tone Effects among African Americans: Perceptions and Reality.”
American Economic Review96(2):251–55.
Holzer, Harry, and David Neumark. 2000. “Assessing Affirmative Action.”Journal of Eco-nomic Literature38(3):483–568.
784 The Journal of Human Resources
Kain, John F., Dan O’Brien, and Paul Jargowsky. 2005. “Hopwood and the Top 10 Percent Law: How They Have Affected the College Enrollment Decisions of Texas High School Graduates.” Working Paper, Texas Schools Project.
Kibria, Nazli. 1997. “The Construction of ’Asian American’: Reflections on Intermarriage and Ethnic Identity among Second-Generation Chinese and Korean Americans.”Ethnic and Racial Studies20(3):523–44.
Lee, Jennifer, and Frank D. Bean. 2004. “America’s Changing Color Lines: Immigration, Race/Ethnicity, and Multiracial Identification.”Annual Review of Sociology30(2004):221– 42.
Leonard, Jonathan S. 1984a. “Antidiscrimination or Reverse Discrimination: The Impact of Changing Demographics, Title VII, and Affirmative Action on Productivity.”Journal of Human Resources19(2):145–74.
———. 1984b. “Employment and Occupational Advance under Affirmative Action.” Re-view of Economics and Statistics66(3):377–85.
———. 1984c. “The Impact of Affirmative Action on Employment.”Journal of Labor Eco-nomics2(4):439–63.
Long, Mark C. 2004a. “College Applications and the Effect of Affirmative Action.”Journal of Econometrics121(1–2):319–42.
———. 2004b. “Race and College Admissions: An Alternative to Affirmative Action?” Re-view of Economics and Statistics86(4):1020–33.
Loury, Linda Datcher, and David Garman. 1993. “Affirmative Action in Higher Education.”
American Economic Review83(2):99–103.
Lovell, Peggy A., and Charles H. Wood. 1998. “Skin Color, Racial Identity, and Life Chances in Brazil.”Latin American Perspectives25(3):90–109.
Nagel, Joane. 1994. “Constructing Ethnicity - Creating and Recreating Ethnic Identity and Culture.”Social Problems41(1):152–76.
PDAD (Pesquisa Distrital por Amostra de Domicı´lios). 2004. “PDAD Technical Report.” SEPLAN/CODEPLAN (Companhia de Desenvolvimento do Planalto Central), Brasilia. PNAD (Pesquisa Nacional por Amostra de Domicı´lios). 2004. Data set, Instituto Brasileiro
de Geografia e Estatı´stica, Brasilia.
Rangel, Marcos. 2007. “Is Parental Love Colorblind? Allocation of Resources within Mixed Families.” Working Paper 0714, Harris School of Public Policy Studies, University of Chicago.
Rothstein, Jesse, and Albert H. Yoon. 2008. “Affirmative Action in Law School Admis-sions: What Do Racial Preferences Do?” NBER Working Paper number 14276.
Ruebeck, Christopher S., Susan L. Averett, and Howard N. Bodenhorn. 2009. “Acting White or Acting Black: Mixed-Race Adolescents’ Identity and Behavior.”B.E. Journal of Eco-nomic Analysis and Policy: Contributions to EcoEco-nomic Analysis and Policy9(1):1–42. Smith, James P., and Finis Welch. 1984. “Affirmative Action and Labor Markets”Journal
of Labor Economics2(2):269–301.
Telles, Edward. 2004.Race in Another America: The Significance of Skin Color in Brazil. Princeton: Princeton University Press.
Theodoro, Ma´rio, Luciana Jaccoud, Rafael Oso´rio, and Sergei Soares. 2008.As polı´ticas pu´blicas e a desigualdade racial no Brasil: 120 anos apo´s a abolic¸a˜o. Brası´lia: Ipea. Tienda, Marta, Sigal Alon, and Sunny X. Niu. 2008. “Affirmative Action and the Texas Top
10% Admissions Law: Balancing Equity and Access to Higher Education” Working Pa-per, Princeton University Office of Population Research.
Wood, Charles H., and Peggy A. Lovell. 1992. “Racial Inequality and Child Mortality in Brazil.”Social Forces70(3):703–24.