VARIABILITY OF ATMOSPHERIC CO
2OVER INDIA AND SURROUNDING OCEANS
AND CONTROL BY SURFACE FLUXES
R. K. Nayaka,*, V.K. Dadhwala, A. Majumdarb, N. R. Patelb , and C. B. S. Dutta aNational Remote Sensing Center, Hyderabad
bIndian Institute of Remote Sensing, Dehradun [email protected]
KEY WORDS: Carbon cycle, Atmospheric InfraRed Sounder, Net Primary Productivity, flux exchanges, terrestrial biosphere, Indian Ocean.
ABSTRACT:
In the present study, seasonal and inter-annual variability of atmospheric CO2 concentration over India and surrounding oceans during 2002-2010 derived from Atmospheric InfrarRed Sounder observation and their relation with the natural flux exchanges over terrestrial Indian and surrounding oceans were analyzed. The natural fluxes over the terrestrial Indian in the form of net primary productivity (NPP) were simulated based on a terrestrial biosphere model governed by time varying climate parameters (solar radiation, air temperature, precipitation etc) and satellite greenness index together with the land use land cover and soil attribute maps. The flux exchanges over the oceans around India (Tropical Indian Ocean: TIO) were calculated based on a empirical model of CO2 gas dissolution in the oceanic water governed by time varying upper ocean parameters such as gradient of partial pressure of CO2 between ocean and atmosphere, winds, sea surface temperature and salinity. Comparison between the variability of atmospheric CO2 anomaly with the anomaly of surface fluxes over India and surrounding oceans suggests that biosphere uptake over India and oceanic uptake over the south Indian Ocean could play positive role on the control of seasonal variability of atmospheric carbon dioxide growth rate. On inter-annual scale, flux exchanges over the tropical north Indian Ocean could play positive role on the control of atmospheric carbon dioxide growth rate.
1. INTRODUCTION
Carbon dioxide (CO2) is a major greenhouse gas in the
atmos-phere and plays a significant role in warming the earth by radia-tive forcing through entrapment of outgoing long-wave radiations from the earth to the space. The concentration of CO2 has in-creased by 31% since pre-industrial times, from 280 parts per mil-lion by volume (ppm) to more than 370 ppm today and half of these increase has been since 1965 (Karl and Trenberth, 2003). Earth’s climate is highly sensitive to this rapid growth of CO2, and numerous studies revealed the fact that present global warm-ing is a consequence of such change. Simulation studies under different scenarios of atmospheric CO2 concentration suggest that in the coming century, global average temperature may increase in the range of 2 – 4.5 oC (IPCC report 2007). Much of the current increasing trend of CO2 is attributable to the 6-fold increase in human use of fossil fuel, deforestation and other anthropogenic activities. Of the total anthropogenic CO2 emission, only 30 - 40% remains in the atmosphere and the rest is being absorbed by ocean and terrestrial biosphere (IPCC reports 1995).
Ocean is the large reservoir of the carbon and exchanges CO2 with the atmosphere at the air-sea interface primarily due to sim-ple physical dissolution, with the net flux to and from the ocean surface depending on the gradient of the partial pressures of CO2 in atmosphere and water. Presently global ocean is the major sink of atmospheric CO2. Atlantic Ocean is contributing about 42% of the global ocean uptake, followed by 32% and 21% by Pacific and Indian Ocean respectively (Takahashi et al., 2009). The global terrestrial biosphere is the second major natural sink of atmos-pheric CO2 at the present time (House et al., 2003). Net Primary
Productivity (NPP) is the fundamental process in terrestrial bio-sphere functioning and is defined as the quantitative measure of the carbon assimilation per unit time and space by terrestrial bio-sphere. Hence the estimates of NPP in regional and global scale play crucial role in limiting the increasing rate of atmospheric CO2. However, several studies indicated that uptake strength of these natural sinks may decline in future owing the climate change (Berthelot et al., 2005).
In order to understand the carbon cycle better, several observation networks are established across the globe in recent time under dif-ferent national and international efforts. Space based observation programs such as Atmospheric InfraRed Sounder (AIRS) and SCanning Imaging Absorption spectroMeter for Atmospheric CartograpHY (SCHIAMACHY) are being operationalized since 2002. AIRS is a new generation space-born Infra-Red (IR) sounder launched into Earth-orbit along with Advanced Micro-wave Sounding Unit (AMSU-A) on May 4, 2002 by the Aqua satellite under the NASA Earth Observation Program with an in-tent of extracting valuable information about tropospheric varia-tions of carbonaceous trace gases. In present study, 7 years monthly data of mid-troposphere CO2 during 2002-2010 derived from AIRS observations are used to analyze its spatial and tempo-ral variability in association to its control by surface fluxes over the Indian subcontinent and surrounding oceans.
2. DATA AND METHODS 2.1 Atmospheric CO2
AIRS (http://disc.sci.gsfc.nasa.gov/AIRS/data-holdings/by-data-product/AIRX3C2M). AIRS is a hyper spectral sensor with 2378 spectral channels within 0.41 – 15.4 microns and that can measure the vertical profiles of atmospheric temperature and moisture together with several trace greenhouse gases. Retrieval of atmospheric CO2 from the AIRS observations was based on inverse modeling of radiative transfer processes where clear sky observations at CO2 dedicated channels (9 long wave channels within the band 699-705 cm-1, and 6 short wave channels within the band 1939-2107 cm-1) were used in atmospheric radiative transfer model (Strow et al., 2003). For the analysis of the data in subsequent sections long-term growth rate is computed by fitting a trend line between CO2 concentration and months using the least square method. The annual mean growth rate of atmospheric CO2 for a given year is calculated by taking the difference in concentrations of CO2 in January of subsequent year and the value in January of the given year. The calculation of monthly growth rate was done by taking the difference between the values of consecutive months using backward difference scheme.
2.2 Estimates of Air-Sea CO2 Fluxes
The air-sea CO2 fluxes can be estimated from the measurement of partial pressure of dissolved CO2 in ocean surface water (pCO2w) and in the adjacent atmospheric layer (pCO2a ) using the following empirical relation
Where k and Ko respectively are the gas transfer velocity and solubility of CO2 in sea water. The gas transfer velocity can be estimated using the following relation (Wanninkhof and Mcgillis, 1999).
Where Sc is the Schimdt number, the viscosity of sea water
divided by the molecular diffusion co-efficient of CO2 in water and it can be calculated from the data of sea surface temperature (SST) according to the formulation:
3 The solubility can be estimated using the relation based the relation (Weiss, 1974).
Where SSS is the sea surface salinity and the units of various quantities involved in the calculation of CO2 fluxes are: SST in Kelvin, SSS in psu, U in m sec-1, Ko in mol kg-1atm-1, k in cm hr-1, and pCO2a and pCO2w in µ atm. Thus the estimated flux will be measured in the unit of and a constant factor 1.07748 is multiplied on the estimated flux to convert the quantity in to the unit of gC m-2 yr-1.
The CO2 flux exchanges over the north Indian Ocean during past 6 years (2003-2008) in monthly scale were estimated using wind speed data based on monthly NASA QuikSCAT observations (www.remss.com), optimal interpolated SST (Reynolds et al., 2002), Simple Ocean Data Assimilation SSS (Carton et al., 2005) and monthly climatological data of partial pressure difference between ocean and atmosphere:pCO2w-pCO2a (del pCO2) (Takahashi et al., 2009). The estimated fluxes exhibits large spatial and temporal variability with positive values over the north Indian Ocean and negative over the tropical south Indian Ocean (Fig 1). The estimated fluxes were mostly positive over the north India Ocean (north to 10 0S) with net annual release of 88 Tg C yr-1 (at the rate of 20 g C m-2) over the Arabian Sea(5 – 250 N), 42 Tg C yr-1 (at the rate of 4.0 g C m-2) over the Equatorial India Ocean (100 S - 50 N) and 8 Tg C yr-1 at the rate of 3.0 g C m-2 ) over the Bay of Bengal (5-250 N). Most of the CO2 release in a year by the tropical north Indian Ocean occurs during the south-west monsoon period (June – September) which accounts for 85% of the total annual release. The total annual flux exchanges over the equatorial Indian Ocean occur 55% during the south-west monsoon and 22% during the winter monsoon (December-February). Very large values of flux exchange regions were coinciding with the strong upwelling regions (Sarma, 2003). The CO2 uptake by the TIO (300 S - 100 S) was 60 Tg C yr-1 (at the rate of 4.5 g C m-2) and 78% of this uptake was accounted during June-September. The inter-annual variation in the CO2 flux exchanges over different regions of the north Indian Ocean was also significant.
2.3 Estimates of terrestrial biosphere uptake of atmospheric CO2
The Carnegie–Ames–Stanford Approach: CASA (Potter et al., 2003), a simple terrestrial biosphere model based on light use efficiency that simulates terrestrial NPP based on spatially explicit input of satellite greenness index, solar radiation, air temperature, precipitation plus soil and vegetation cover maps. Previously we have implemented this model for the study of spatio-temporal analysis of NPP over India during year 2003 (Nayak et al. 2009). In present case, the model was used to simulate monthly NPP over India (at 8 km spatial resolution) for the years 2002-2006. The simulation period was restricted to 5 years only owing to the data constrains. Data of satellite greenness index used in the study was based on MODerate-resolution Imaging Spectroradiometer (MODIS) observation (http://glcf.umiacs.umd.edu/data/ndvi/) data of climatic parameters: temperature, precipitation and solar radiation were based Climate Research Unit (CRU) (www.cru.uea.ac.uk/cru/data/hrg), land cover map was based on Agrawal, et al. 2003 and the soil attribute map was based on Reynolds et al., 1999.
3. RESULTS
3.1 Spatiotemporal variability of atmospheric CO2
Spatial pattern of monthly climatology of mid-tropospheric CO2 over India and surrounding oceans based on AIRS observation during 2002-2010 are presented in Figure 2. The notable observed features are the strong seasonal and latitudinal gradient modulated by monsoonal activity over the study region. During the winter monsoon over Indian subcontinent (December to February) large values of CO2 (> 380.5 ppm) are observed and are confined over the southern China. There is progressive increase of the spatial extent of these large values. CO2 concentration decreases over India and surrounding oceans along north-south direction from 381 ppm at 300N up to 377 ppm at 80N and then it increased slowly over the south TIO. Relatively smaller values ranges between 376-378 ppm spread over the northern tropics (between 0 - 25 0 N latitude) along west-east direction. The smallest values are located over the western Arabian Sea in January. Similar small values of atmospheric CO2 is observed over India with prominent minimum values in February. There is a belt of small CO2 situated in the southern hemisphere between 10 and 25 0 S latitudes and is more prominent in January. During the spring season (March- May), the region of large values of CO2 on the northern latitude increases progressively in all the directions. In May, most part of the northern hemisphere has come under the large values of CO2. These variations of CO2 in the spring season is associated with local minimum over some pockets, in particular to the southern China, adjacent to Nepal territory in March and April and south-western India (western-Ghat hills) in May. The small values of CO2 band over the south Indian Ocean also remain prominent in this period which could be due to increasing strength of oceanic CO2 uptake.
Figure 1 Monthly maps of air-sea fluxes of CO2 over TIO during a climatological year 2002-2009.
With the arrival of southwest monsoon over India and surrounding region in June, CO2 levels declined over north TIO and over the terrestrial India. There is a local and isolated minimum of CO2 observed over central India. Through the progress of southwest monsoon in July and August, atmospheric CO2 levels further declines over most part of Indian Ocean.
During the early period of the autumn (September), the levels of atmospheric CO2 are further declined below 380 ppm over most part of the study region. Through the progress of autumn (October-November), the values of CO2 remained below 380 ppm over most parts of the study region except few pockets in the northern latitude over China.
The regional average of atmospheric CO2 and the linear growth rate (trend) computed using the least square method between CO2 concentration and years over India and surrounding oceans are presented in Fig. 3. The data exhibit linear increasing trend of 2.14 ppm yr-1 with distinct seasonal cycle over the terrestrial India. The de-trended CO2 values remain positive during January-June and negative during July-December. The seasonal cycle has larger amplitude over India than the global average. Annual atmospheric CO2 growth rate over India and over different regional basins of the Indian oceans for different years exhibit large variations.
Figure 2 Monthly maps of mid-tropopsheric CO2 over the India and surrounding oceans based on AIRS observation during a climatological year 2002-2010.
3.2 Relationship between atmospheric CO2 growth rate and surface fluxes
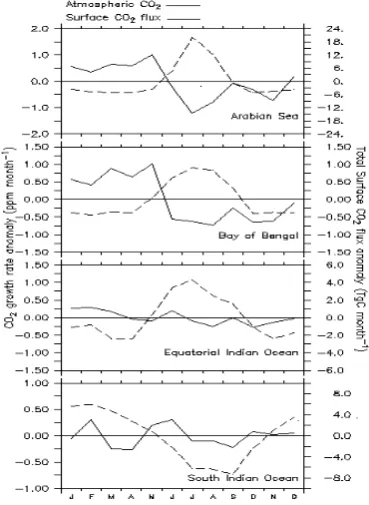
To assess the role of surface fluxes on atmospheric CO2 variability on a seasonal scale, regional averages of CO2 and its monthly growth rates over India, and over different regional basins of the Indian oceans: Arabian Sea, Bay of Bengal, Equatorial Indian ocean, and southern tropical Indian ocean have been estimated for all the years of the study period. Similar regional averages were also carried out for the surface CO2 fluxes. Comparison between monthly climatology of the atmospheric CO2 growth rate and surface CO2 fluxes over India and over different regional basins of the Indian Ocean were presented in Fig. 4 and Fig. 5 respectively.
Atmospheric CO2 growth rate and terrestrial NPP over India exhibit an inverse relation between them during most of the periods in a year (Fig 4). The positive anomaly of atmospheric CO2 growth rate is being estimated during January to June and is associated with negative anomaly of terrestrial CO2 uptake. With the arrival of southwest monsoon over the country in June and its progress through July and August, atmospheric CO2 started declining over the country and caused negative anomaly of CO2 growth rate. This could be due to large enhancement of CO2 uptake by terrestrial biosphere over the country as implied from the large negative values of NPP anomaly. In subsequent post-summer monsoon months (September -November), the anomaly of CO2 growth rate is mostly negative due to large terrestrial biospheric CO2 uptake (positive NPP anomaly). In early winter monsoon (December), CO2 growth rate is positive and is associated with negative NPP anomaly. This result suggests that the terrestrial biosphere over India play significant role in removal of CO2 from the atmosphere in the seasonal scale.
Figure 4 CO2 growth rate anomaly compares with anomaly of NPP over India during the climatological year.
As shown in Figure 5, over the north TIO: Arabian Sea and Bay of Bengal, atmospheric CO2 growth rate is positive during winter and spring (December - May) and is negative during summer and autumn (June-November). Estimated air-sea CO2 fluxes over these basins however remain positive throughout the year, their anomalies remain positive during June-August and negative during rest of the year. There exist inverse relation between the anomalies of the atmospheric CO2 growth rate and surface CO2 fluxes during most of the period in a year except October-November. This result indicates that surface fluxes over the north TIO have negative role in the growth of atmospheric CO2 concentration in seasonal scale except for the months of October and November when surface flux may have positive control on the atmospheric CO2. However less significant, the similar
inverse relation could exists between anomalies of atmospheric CO2 growth rate and surface fluxes over the equatorial Indian Ocean during major periods of a year (July-September, January-April).
Figure 5 CO2 growth rate anomaly compares with anomaly of air-sea fluxes of CO2 over different basins of the TIO.
Over the south TIO, the atmospheric CO2 growth rate remains positive during most of the periods in a year except in the month of March and April. Estimated surface CO2 fluxes remain negative during most of the period in a year except January-February. The relation between the anomalies of atmospheric CO2 growth rate and surface fluxes over south TIO is much different than that of the north TIO. Atmospheric growth rate anomalies remain in phase with the surface flux anomalies during July-September, November-December, February and May. During July-September, the atmospheric CO2 growth rate anomalies remain mostly negative together with continuous negative values of surface flux anomalies. This implies that enhancement in the CO2 uptake by the south Indian Ocean may leads to decrease in atmospheric CO2 concentration locally. During November-December and May, anomaly of atmospheric CO2 growth rate remains positive together with positive anomaly of surface fluxes which implies that due to the reduction in the CO2 uptake by the south tropical Indian Ocean, the atmospheric CO2 growth rate could be enhanced. This result indicates that south Indian Ocean may play significantly positive role in regulating atmospheric CO2 seasonal variability.
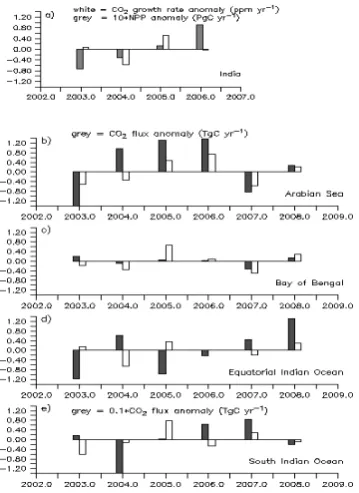
CO2 growth rate undergone fluctuation irrespective of continuous increase of terrestrial biospheric uptake over India. Total NPP over India was increased from 1.45 Pg C in 2003 to 1.61 PgC in 2006, while smallest atmospheric CO2 growth rate was observed in 2004 (1.46 ppm yr-1) and largest (2.54 ppm yr-1) in 2005 (Table 2). However, there was hardly any association between the two parameters, it could be noticed that relatively large value of atmospheric CO2 growth rate (2.11 ppm yr-1) was observed together with small value of NPP in 2003 and relatively small value of atmospheric CO2 growth rate (2.01 ppm yr-1) was observed together with large value of NPP in 2006. Hence inverse relation could be seen between the anomaly of atmospheric CO2 growth rate and anomaly of NPP in 2003 and 2006.
Figure 6. Comparison between anomaly of atmospheric CO2
growth rate (ppm y-1) and anomaly of surface CO2 fluxes over
India (in form of NPP in gC m-2 y-1) and over different basins of the Indian Ocean during different years of the study period. The NPP anomaly shown in the figure is presented in an enhanced scale (i.e. 10 times larger) and fluxes over south Indian Ocean are presented in a reduced scale (10 times smaller than the actual value).
The bar plots between the anomalies of the atmospheric CO2 annual growth rate and surface fluxes over different basins of the Indian ocean as shown in Fig. 6 illustrate that the flux exchanges over the Arabian Sea could have significant control on the atmospheric CO2 growth rate locally. Estimates of mean surface fluxes over the Arabian sea are one order magnitude higher than the fluxes over rest part of the Indian ocean and one order smaller than that of terrestrial fluxes (in terms of NPP) over India (see table 1). Anomaly of atmospheric CO2 growth rate remains in phase with surface CO2 flux anomalies during most of the study period except in 2004. Similar phase in both the anomalies suggests that enhancement of surface fluxes over the ocean may
lead enhancement of atmospheric CO2 growth rate and vice versa. However the magnitude of surface CO2 fluxes over Bay of Bengal is one order smaller than that of the Arabian Sea, there exists the similar relationship between anomalies of atmospheric CO2 growth rate with the surface CO2 fluxes. On the other hand, fluxes over the equatorial Indian Ocean varies arbitrarily with the anomalies of atmospheric CO2 growth rate. The fluxes over the south tropical Indian ocean, however comparable with the fluxes over the Arabian Sea, they varies almost inversely with the atmospheric CO2 growth rate. This result suggests that ocean surface fluxes have negative role on the growth of atmospheric CO2.
4. CONCLUDING REMARKS
In this paper, seasonal and inter-annual variability of atmospheric CO2 in relation to terrestrial biosphere uptake over India and
air-sea fluxes of CO2 over the surrounding oceans based on AIRS
observation are studied. However the study period is short, following conclusions can be drawn: (i) there exists strong seasonal and inter-annual variability of mid-tropospheric CO2
growth rate over India and surrounding oceans with the mean long term linear growth rate 2.15 ppm yr-1, (ii) the terrestrial biospheric CO2 uptake over India and oceanic CO2 uptake by southern tropical Indian ocean may play positive role on the control of seasonal variability of atmospheric CO2 locally; (iii)
flux exchanges over the north TIO may play positive role and flux exchanges over the south TIO play negative role on the control of
inter-annual variability of the atmospheric CO2. The role of
terrestrial biospheric uptake on the inter annual variability of atmospheric CO2 growth yet to be investigated using NPP data
over India during more number of years.
REFERENCES
Agrawal, S., Joshi, P. K., Shukla, Y., Roy, P.S. SPOT VEGETATION multi temporal data for classifying vegetation in south central Asia. Current Science, 2003, 84 (11), 1440-1448. Berthelot M, P. Friedlingstein, P. Ciais, et al., How uncertainties in future climate change predictions translate into future terrestrial carbon fluxes. Glob Change Biol. 2005; 1:959–970. doi: 10.1111/j.1365-2486.2005.00957.x.
Carton, J.A., B.S. Giese, and S.A. Grodsky, Sea level rise and the warming of the oceans in the SODA ocean reanalysis, J. Geophys. Res., 2005 110, art# 10.1029/2004JC002817.
House J.I., I.C. Prentice, N. Ramankutty, et al., Reconciling ap-parent inconsistencies in estimates of terrestrial CO2 sources and sinks. Tellus. 2003;55B:345–363.
Karl. T.R., K.E. Trenberth, Modern Global Climate Change, Sci-ence, 2003, Vol 302, 1719-1723.
Nayak, R. K., N. R. Patel and V. K. Dadhwal, Estimation and analysis of terrestrial net primary productivity over India by re-mote-sensing driven terrestrial biosphere model, Journal of Envi-ronment Monitoring and Assessment, 2009 10.1007/s10661-009-1226-9.
surface data, Global Biogeochemical Cycles,1993, Vol. 7, No.4, 811-841.
Reynolds, C.A., Jackson, T. J., Rawls, W.J., Estimated Available Water Content from the FAO Soil Map of the World, Global Soil Profile Databases, Pedo-transfer Functions. NOAA National Geo-physical Data Center, Boulder, CO. 1999.
Reynolds, R. W., N. A. Rayner, T. M. Smith, et al. , An improved in situ and satellite SST analysis for climate. J. Climate, 2002, 15, 1609-1625.
Strow L.L., S.E.Hannon, S. DeSouza-Mackado et al., An over-view of the AIRS radiative transfer model. IEEE Trans. Geosci. Rem. Sens., 2003 v.41, N 2, 303-313.
Takahashi, T., S.C. Sutherland, and A. Kozyr, Global Ocean Sur-face Water Partial Pressure of CO2 Database: Measurements Per-formed During 1968-2008 (Version 2008). ORNL/CDIAC-152,
NDP-088r. Carbon Dioxide Information Analysis Center, Oak Ridge National Laboratory,U.S. Department of Energy, Oak Ridge, Tennes, 2009 doi:10.3334/CDIAC/otg.ndp088r.
Wanninkhof, R. and Mcgillis, W.R., 1999, A cubic relationship between air-sea CO2 exchange and wind speed, Geo-phys.Res.Lett.26, 1889-1892.
Weiss, R.F., 1974, Carbon dioxide in water and sea water: The solubility of a non-ideal gas, Mar. Chem., 2, 203-215.
ACKNOWLEDGEMENT