FOREST ECOSYSTEM DYNAMICS ASSESSMENT AND PREDICTIVE MODELLING IN
EASTERN HIMALAYA
S.P.S. Kushwaha*, S. Nandy*, M. Ahmad*, Reshu Agarwal*
Indian Institute of Remote Sensing, Dehradun 248001, India
([email protected], [email protected], [email protected], [email protected]) Commission VI, WG VI/4
KEY WORDS: Deforestation, CAMM, GIS, IRS LISS-3, Landsat TM, Modelling, Remote Sensing
ABSTRACT:
This study focused on the forest ecosystem dynamics assessment and predictive modelling deforestation and forest cover prediction in a part of north-eastern India i.e. forest areas along West Bengal, Bhutan, Arunachal Pradesh and Assam border in Eastern Himalaya using temporal satellite imagery of 1975, 1990 and 2009 and predicted forest cover for the period 2028 using Cellular Automata Markov Modedel (CAMM). The exercise highlighted large-scale deforestation in the study area during 1975-1990 as well as 1990-2009 forest cover vectors. A net loss of 2,334.28 km2 forest cover was noticed between 1975 and 2009, and with current rate of deforestation, a forest area of 4,563.34 km2 will be lost by 2028. The annual rate of deforestation worked out to be 0.35 and 0.78% during 1975-1990 and 1990-2009 respectively. Bamboo forest increased by 24.98% between 1975 and 1990-2009 due to opening up of the forests. Forests in Kokrajhar, Barpeta, Darrang, Sonitpur, and Dhemaji districts in Assam were noticed to be worst-affected while Lower Subansiri, West and East Siang, Dibang Valley, Lohit and Changlang in Arunachal Pradesh were severely affected. Among different forest types, the maximum loss was seen in case of sal forest (37.97%) between 1975 and 2009 and is expected to deplete further to 60.39% by 2028. The tropical moist deciduous forest was the next category, which decreased from 5,208.11 km2 to 3,447.28 (33.81%) during same period with further chances of depletion to 2,288.81 km2 (56.05%) by 2028. It noted progressive loss of forests in the study area between 1975 and 2009
through 1990 and predicted that, unless checked, the area is in for further depletion of the invaluable climax forests in the region, especially sal and moist deciduous forests. The exercise demonstrated high potential of remote sensing and geographic information system for forest ecosystem dynamics assessment and the efficacy of CAMM to predict the forest cover change.
1. INTRODUCTION
The human societies throughout their history have co-evolved with their environment through change, instability and mutual adaptation. In past, humans lived in harmony with other creatures in different ecological systems till they advanced technically and socially. Today humans dominate the ecosystems and landscapes throughout the world (Vitousek et al., 1997; Kushwaha et al., 2010). Nature supports diversity and not the dominance. Humans have interfered and brought about unprecedented changes in ecosystems, landscapes, biomes and the biosphere. Global changes in the land use/land cover, especially deforestation together with fossil fuel burning, is responsible for carbon accumulation in the atmosphere over past one century (Candell and Raupach, 2008) so much so that the survival of the large number of species is at stake. The concerns on the land use/land cover changes emerged in the research agenda on global environmental change with the realization that the land surface processes influence climate (Pitman and Narisma, 2005). Besides influencing biodiversity, the land cover change modifies surface albedo and thus, surface-atmosphere energy exchanges, which have an impact on regional climate (Sagan et al., 1979). In the early eighties, terrestrial ecosystems as sources and sinks of carbon were highlighted (Woodwell et al., 1983). This underscored the impact of land use/land cover change on the global climate through carbon cycle (Houghton et al., 1985). A much larger range of impacts of land use/land cover change on ecosystem goods and services were further identified. Of primary concern are the impacts on biodiversity (Sala et al., 2000), soil
degradation (Trimble and Crosson, 2000), and the ability of ecological systems to support humans (Vitousek et al., 1997). Thus, understanding and predicting the land use/land cover changes, especially the deforestation and forest degradation, is of paramount importance.
ISPRS Archives XXXVIII- 8/W20; Workshop Proceedings: Earth Observation for Terrestrial Ecosystems
Kushwaha et al., 2010). Satellite imagery and GIS have been used to evaluate the habitat suitability for tiger (Imam et al., 2009) and mountain goat and muntjak (Singh and Kushwaha, 2011) in India. The ecological status of elephant corridors in Northern Indian Elephant Range in Uttaranchal was monitored by Khanna et al. (2001) using a combination of remote sensing, GIS and field investigations.
One of our earlier studies (Srivastava et al., 2002) covering Sonitpur district alone reported a loss of 232 km2 forest area between 1994 and 2001 using Indian Remote Sensing Satellite, IRS LISS-3 imagery. In a subsequent study, Kushwaha and Hazarika (2004) reported loss of 344 km2 forest area between 1994 and 2002 again using LISS-3 imagery, which was attributed to increased insurgency in the area during period under consideration. During this study, it came to our notice that not only Sonitpur forests but also other forests along West Bengal, Bhutan, Arunachal Pradesh, and Assam border have been subjected to massive deforestation and hence, we decided to work it out. Present study attempted to monitor deforestation in the said area up to 1000 m elevation on Arunachal side in the Eastern Himalaya using temporal satellite imagery of 1975, 1990 and 2009 periods. Effort was also made to predict the forest cover for the period, 2028 using Cellular Automata Markov Model. 1.1 Cellular Automata Models
Cellular automata models are becoming popular due to the ease of implementation, ability to rebuild the spatial frame and applicability to various dynamic phenomena. According to Wu (1998), the combination of three elements viz., geographic information system (GIS), cellular automata (CA), and multi-criteria evaluation (MCE), has advantages in decision-making, easier access to spatial information, and the more realistic definition of transition rules. Large-scale forest dynamics was studied by Lett et al. (1999) by using CA and an individual-based model. Soares-Filho et al. (2002) proposed a spatially-explicit cellular automata simulation model, DINAMICA to simulate the landscape dynamics of Amazonian colonization. They concluded that model showed good performance in replicating the spatial pattern.
Christopher et al. (2006) developed a GIS-based fuzzy constrained cellular automata model for forest insect infestation and concluded that CA modeling can provide useful information for forest management in the event of an insect outbreak. These models, in conjunction with Markov Chain, perform better in simulating the land changes and vegetation dynamics as compared to conventional models and produce results that are more significant and practical. Alexandridis et al. (2008) presented the simulation results of a cellular automata model describing the forest fire spread on a mountainous landscape and concluded that the model can be used to develop a fire risk management tool for heterogeneous landscapes. Temporal and spatial complexities of the phenomenon can be efficiently modeled by precise declaration of transition rules in CA models. The remote sensing and GIS technologies together provide an unbiased data source over large areas and thus, enhance our ability to monitor the land use/land cover changes in space and time (Lillesand and Kiefer, 2000).
1.1.1 Cellular Automata Markov Model (CAMM): CAMM comprises two methods to model forest cover i.e. Markov Chain Analysis and Cellular Automata Analysis. Markov chain analysis is a method for modeling land use/land cover change when changes and the processes in the landscape are difficult to describe. A Markovian process is simple process in the sense that the future state of the system can be modelled purely on the basis of the immediately preceding state:
]
Markov chain analysis describes land use/land cover changes from one period to another and uses this as the basis to project the future changes. It generates transition probability, transition area matrices and suitability images of land use changes from time one to time two. The transition probabilities matrix records the probability that each land cover category will change to every other category, the transition area matrix records the number of pixels that are expected to change from each land cover type to each other land cover type over next time period while suitability describes the transfer potential of a cell of specific type from one class to another. These suitability images are the function of probability of transit from state T1 to T2 which plays an important
role in affecting the transfer of the state of a cell (Novaline et al., 2008):
(x,y) = probability of the transition from one state to another for the pixel located at (x,y)
= degree of suitability to the conversion from one state to another for the pixel located at (x,y) Markov chain analysis generates only the matrices, which do not contain any information about spatial distribution of the changes. To add this component, the suitability-based CA technique is used. The essence of suitability-based CA is that the predicted state of the pixel not only depends on the neighboring pixels but it also checks the suitability for the transition. It is an agent that has the ability to change its state based upon the application of a rule that relates the new state to its previous state and those of its neighbours based on the suitability of the transition. Suitability-based cellular automata model can be represented as a two dimensional model:
where N is the neighborhood, which provides the input rules for the pixel transition Above model uses a spatially-explicit contiguity-weighting factor to change the state of cells based on its neighbours and suitability thus giving geography more importance in the solution.
2. STUDY AREA
The study covered areas along West Bengal, Bhutan, Arunachal Pradesh borders (25°44´46´´-28°20´01´´N and 89°42´00´´-96°24´21´´E)) comprising partly Dhubri, Kokrajhar, Goalpara, Berpeta, Nalbari, Kamrup, Darrang, Nagaon, Sonitpur, Golaghat, Lakhimpur, Jorhat, Sibsagar, Dhemaji, and Sadia districts in Assam and West Kameng, East Kameng, Lower Subansiri, West Siang, East Siang, Dibang Valley, Lohit, and Changlang districts of Arunachal Pradesh, total study area being 42,250 km2. The area lies north of India’s mightiest river, Brahmaputra. The area makes part of the ‘Himalaya’ and ‘North-East’ biogeographic zones (Rodgers and Pawar, 1988), and ‘Himalaya’ biodiversity hotspot with 3160 endemic species (Singh and Kushwaha, 2008). Shifting cultivation is widely practiced in the study area. The population density in Assam districts is higher than in Arunachal districts. The terrain varies from dooars (alluvial, table land in Shivalik foothills) in Assam to mountains in Arunachal Pradesh. Large number of tea gardens, some more than 100 year old, dot the landscape in the study area, with influx of work force from as far as Orissa, Chhattisgarh and Madhya Pradesh provinces. Some of the world’s finest tea is produced in the study area.
The temperature ranges from 7°C in January to as high as 38°C in May. There is significant variation in the rainfall across Assam. It is as high as 3350 mm in Lakhimpur and as low as 1290 mm in Lumding. The annual rainfall in the study area is ca. 2400 mm. Both southwest and northeast monsoons bring rain to the area. Relative humidity ranges from 67% in dry season to 87% in wet season (ASTEC, 2004). The study area partly covers three Elephant Ranges viz., ‘Eastern Dooars’ comprising Manas (and Buxa-Jaldapara) Elephant Reserve, ‘North Brahmaputra’ comprising Kameng and Sonitpur Elephant Reserves, and the ‘South Brahmaputra’ including Dibru and Deomali Elephant Reserves (Bisht, 2002). The entire study area thus, can be called as Elephant Landscape (MoEF, 2010). Some other wild animal species reported from the study area are tiger, leopard, clouded leopard, red panda, musk deer, sambar, hog deer, Himalayan black bear, wild dog, fishing cat, jungle cat, slow loris, Indian bison, fox, jackal, Malayan giant squirrel, civet cat, hare, yellow-throated martin, rhesus macaque, capped langur, about 250 varieties of butterflies, 300 species of birds and four species of hornbills have been reported from the study area (Kushwaha and Hazarika, 2004).
According to Champion and Seth (1968), the study area has two categories of Northern Tropical Wet Evergreen Forest (1B) i.e. Assam Valley Tropical Evergreen Forest (1B/C1) and the Upper Assam Valley Tropical Evergreen Forest (1B/C2), Assam Valley Tropical Semi-Evergreen Forest (2B/C1), East Himalayan Moist Mixed Deciduous Forest (3C/C3b), Very Moist Sal-Bearing Forest (3C/C1), and Khair-Sissoo Forest (5/1S2). The East Himalayan Moist Mixed Deciduous Forest dominates the landscape. Some of the prominent plant species found in the study area are: Shorea assamica Dyer (sal), Dipterocarpus turbinatus C.F.Gaertn (hollong), Artocarpus chaplasha Roxb. (sam), Tetrameles nudiflora R. Br. (maina), Cinnamomum glaucescens (Nees), Hand.-Mazz. (gonsorai), Ailanthus grandis Prain (borpat), Canarium strictum Roxb. (dhuna), Dysoxylum excelsum Blume (poma), Duabanga grandiflora (DC.) Walp. (khokan), Dillenia indica L. (outenga), Balakata baccata (Roxb.) Esser (sellang),
Mesua ferrea L. (nahor), Castanopsis indica (Roxb. ex Lindl.) A. DC. (hingori), Kayea assamica King & Prain (sia nahor), Phoebe goalparensis Hutch. (bonsum) etc. (Rao, 1974).
The current population of 28 million people in Assam, coupled with increasing demand for natural resources and land for agriculture, housing, industry, is resulting in fragmentation of the forests through over-exploitation and slash and burn agriculture (Choudhury, 1999). The study area is facing highest rate of deforestation and happens to be the ‘deforestation hotspot’ in the country. While forest cover at country level has registered improvement (FSI, 2009) over last decade, the forests in the study area are being depleted at an alarming rate.
3. MATERIALS AND METHODS
The multi-date satellite imagery of 1975 (Landsat MSS), 1990 (Landsat TM) and 2009 (IRS LISS-3) were used for this study. The individual imagery were radiometrically corrected using dark pixel subtraction technique (Lillesand and Kiefer, 2000). The IRS LISS-III imagery were geometrically corrected using ortho-rectified Landsat imagery as reference layer. Effort was made to achieve high planimetric (sub-pixel) accuracy. The respective period satellite imagery were mosaiced using histogram matching. An appropriate classification scheme suiting large area (42,250 km2) multi-period mapping and change detection task was chosen.
The on-screen visual interpretation method was employed to delineate and map the intended forest and non-forest categories. The patches smaller than 3 pixel x 3 pixel (ca. 1 ha) were merged with surrounding categories. The pre-field work culminated in the preparation of the interim maps. These maps were taken to field for ground truth collection and verification simultaneously. The field work was carried out between 5th and 20th March, 2009. The field work was planned in such a way that maximum forest types/densities could be visited. The 2009 imagery were handy during field work.
A Trimble Juno-SB GPS receiver, Survey of India topographic maps, and Ranger’s Compass were used in field to locate the points. A total of 489 points were checked on ground. The geo-coordinates of all the points, land cover/forest type/density and land use were noted at each point in the field form prepared for this purpose. Wherever possible, forest department records and maps were collected and views of the forest officials was noted. Field photographs at each point were also taken for record. The post-field work included interpretation of un-interpreted areas and corrections, if any, in the interim maps. A total of 250 ground truth points were used for interpretation. To start with, the forest cover shown as green wash on the topographic maps was digitized and a vector layer was generated. This layer was then overlaid on the satellite imagery of subsequent periods to map only change areas. The procedure of mapping change areas using previous period vector layer was followed throughout for all period satellite imagery.
ISPRS Archives XXXVIII- 8/W20; Workshop Proceedings: Earth Observation for Terrestrial Ecosystems
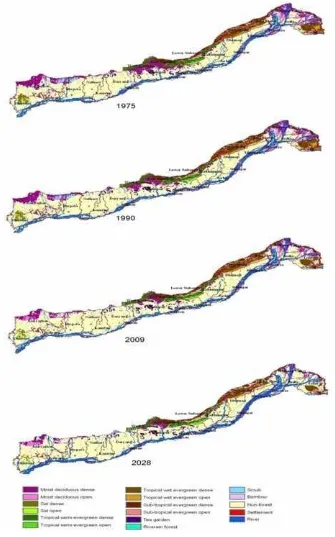
cover during 1975, 1990, 2009 and 2028 (predicted). Fig. 2 depicts forest cover status over time. The 1990 and 2009 forest vector layers were used for predicting the forest cover for the period 2028 using CA Markov Model. A 5x5 contiguity filter was used in the process. The Chi-square ( 2)
χ test for goodness of fit
was applied on 2009 and predicted 2010 data to test the potential of the model to predict the forest cover and it was found that CAMM predicts significantly well at 95% confidence
) 000 . 0 , 3 . 41666 ) 05 . 0 (
(χ(17)2 = p< .
ISPRS Archives XXXVIII- 8/W20; Workshop Proceedings: Earth Observation for Terrestrial Ecosystems
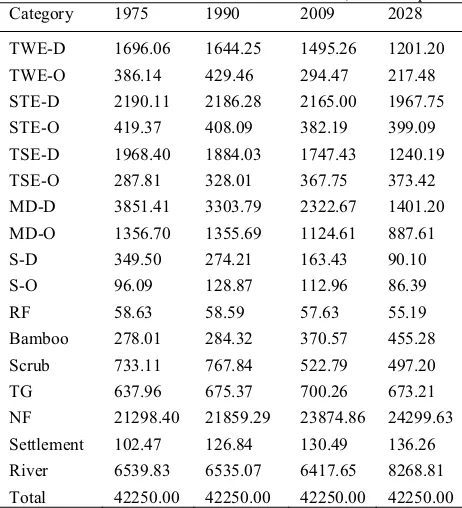
Category 1975 1990 2009 2028
TWE-D 1696.06 1644.25 1495.26 1201.20
TWE-O 386.14 429.46 294.47 217.48
STE-D 2190.11 2186.28 2165.00 1967.75
STE-O 419.37 408.09 382.19 399.09
TSE-D 1968.40 1884.03 1747.43 1240.19
TSE-O 287.81 328.01 367.75 373.42
MD-D 3851.41 3303.79 2322.67 1401.20
MD-O 1356.70 1355.69 1124.61 887.61
S-D 349.50 274.21 163.43 90.10
S-O 96.09 128.87 112.96 86.39
RF 58.63 58.59 57.63 55.19
Bamboo 278.01 284.32 370.57 455.28
Scrub 733.11 767.84 522.79 497.20
TG 637.96 675.37 700.26 673.21
NF 21298.40 21859.29 23874.86 24299.63 Settlement 102.47 126.84 130.49 136.26
River 6539.83 6535.07 6417.65 8268.81
Total 42250.00 42250.00 42250.00 42250.00 Table 1. Forest cover during different periods.
TWE-Tropical wet evergreen forest, STE- Sub-tropical evergreen forest, TSE- Tropical semi-evergreen forest, MD- Moist deciduous forest, S- Sal, RF- Riverain forest, TG- Tea garden, NF- Non-forest, D- Dense, O- Open.
Fig. 2. Forested area over time.
4. RESULTS AND DISCUSSION
The results indicated alarming depletion of the forest cover over time. In the year 1975, an area of 12,938.23 km2 was covered by seven types of forests viz., tropical wet evergreen, sub-tropical evergreen, tropical semi-evergreen, moist deciduous, sal, reverain and the bamboo forest, which got depleted to 12,285.59 km2 by
1990 and 10,603.95 km2 by 2009 thereby showing a progressive
decrease in the forest cover by 5.04% and 18.04% respectively. The predicted loss by 2028 worked out to be 8,374.89 km2 (55.27%). The non-forest and other categories viz., scrub, tea gardens, settlements and river increased by 7.96% between 1975 and 2009 and are expected to increase further (13.47%) by 2028 as per CAMM output. A net loss of 2,334.28 km2 forest cover was noticed between 1975 and 2009, and with current rate of deforestation, a forest area of 4,563.34 km2 will be lost by 2028.
The annual rate of deforestation worked out to be 0.35 and 0.78% between 1975 and 1990, and 1990 and 2009 respectively, which by any standard is high. Even scrub was lost by 28.69% between 1975 and 2009 and stands to lose further in future (32.18%). Bamboo forest expanded by 24.98% between 1975 and 2009 due to opening up of the forests. Table 1 gives the details. This study confirms our earlier finding that forests in the area have been lost at much higher rate after 1990 due to increased insurgency by Bodo ethnic tribe. Forests in Kokrajhar, Barpeta, Darrang, Sonitpur, and Dhemaji districts were noticed to be worst-affected in Assam while Lower Subansiri, West and East Siang, Dibang Valley, Lohit and Changlang are affected in Arunachal Pradesh. Among different forest types, the maximum loss was seen in case of sal forest (37.97%) between 1975 and 2009. It is predicted that this would deplete further to 60.39% by 2028 if current rate of depletion continues in future. The tropical moist deciduous forest was the next category, which decreased from 5,208.11 km2 to 3,447.28 (-33.81%) during same period. This would deplete further to 2,288.81 (56.05%) by 2028. An area of 292.47 km2 (14.05%) under tropical wet evergreen forest was lost between 1975 and 2009. By 2028, this forest will shrink further by 371.05 km2, registering a total loss of 663.52 km2 (31.87%) between 1975 and 2028. The sub-tropical evergreen forest got depleted from 2609.48 km2 to 2547.19 km2 (2.39%), and would deplete further to 2366.84 km2 (9.29%). The tropical semi-evergreen forest also showed similar trends although the loss was higher with time. It was 2256.21 km2 in 1975, got depleted to 2115.18 (6.25%), and is likely to lose further to 1613.61 km2 (28.48%).
The study also indicated that both dense and open/degraded forests have been converted to non-forests and that open/degraded forest phase is often very short. Understandably, this kind of conversion happens when pressure on land is high and the ultimate purpose is food production by a fast growing human population.
Inspite of the 1996 order of the Supreme Court of India, which prohibits tree felling in the north-eastern region, large-scale deforestation still continues. Assam is the first province in region, which nationalized its forests classifying them into reserved forest, protected forest, and unclassed forest; a legal system of forest classification generally followed by state forest departments in India. Should people be allowed to clear-fell such invaluable climax forests is often debated but never unresolved. These forests have been devastated primarily for making more land available for food production by local people. The activity is often viewed as ‘victory’ of local people, their organizations over government but ecologically means nothing. Globally too, it is still debated whether economy should go hand-in-hand with ecology or allow to over-power it as is the case with the present governance system and the development paradigm.
ISPRS Archives XXXVIII- 8/W20; Workshop Proceedings: Earth Observation for Terrestrial Ecosystems
5. CONCLUSIONS
The study tried to investigate the loss of forest along West Bengal, Bhutan, Arunachal Pradesh and Assam border in north-eastern India falling in Eastern Himalaya using satellite remote sensing. It reported significant loss in majority of the forest types. It noted progressive loss of forests in the study area between 1975 and 2009 through 1990 and predicted that, unless checked, the area is in for further depletion of the invaluable climax forests in the region, especially the tropical moist deciduous forests. Large-scale deforestation were noticed in Kokrajhar, Darrang, Sonitpur, and Dhemaji districts in Assam and Lower Subansiri, West and East Siang, Dibang Valley, Lohit and Changlang districts in Arunachal Pradesh were severely affected. Manas Tiger Reserve, Sonai-Rupai Wildlife Sanctuary, Charduar, Balipara, Nowduar, Biswanath, and Behali Reserve Forests suffered maximum and hence, qualify as ‘deforestation hotspots’ not only in Assam but in India. The Gohpur Reserve Forest has already disappeared from the scene long ago. The exercise demonstrated high potential of remote sensing and GIS for forest ecosystem dynamics assessment as also the efficacy of Cellular Automata Markov Model to predict the forest cover change.
REFERENCES:
Alexandridis, A., Vakalis, D., Siettos, C.I. and Bafas, G.V., 2008. A cellular automata model for forest fire spread prediction: The case of the wildfire that swept through Spetses Island in 1990, Applied Mathematics and Computation, 204, pp. 191-201. ASTEC, 2004. The State of Environment-2004. Report, Assam Science, Technology and Environment Council, Government of Assam, Guwahati, pp. 5-8.
Bisht, S.S., 2002. An overview of elephant conservation in India. Indian Forester, 128, pp. 121-136.
Canadell, J.G. and Raupach, M.R., 2008. Managing forests for climate change mitigation. Science, 320, pp. 1456-1457.
Champion, H.G. and Seth, S.K., 1968. A Revised Survey of the Forest Types of India. Govt. of India Publications, New Delhi. Choudhury, A.U., 1999. Status and conservation of Asian elephant, Elephas maximus in north-eastern region. Mammal Review, 29, pp. 141-173.
Christopher, B., Dragicevic, S. and Roberts, A., 2006. A fuzzy-constrained cellular automata model of forest insect infestations, Ecological Modelling, 192, pp. 107-125.
FSI, 2009. State of Forest Report 2009. Forest Survey of India, Ministry of Environment and Forests, Government of India. Houghton, R.A., Boone, R.D. Melillo, J.M. Palm, C.A. Woodwell, G.M. Myers, N. Moore, B. and Skole, D.L., 1985. Net flux of carbon dioxide from tropical forests in 1980. Nature, 316, pp. 617-620.
Imam, E., Kushwaha, S.P.S., Singh, A., 2009. Evaluation of suitable tiger habitat in Chandoli National Park, India using multiple logistic regression. Ecological Modelling, 220, pp. 3621-3629.
Jha, C.S., Dutt, C.B.S. and Bawa, K.S., 2000. Deforestation and land use changes in Western Ghats, India. Current Science, 79(2), pp. 231-238.
Khanna, V., Ravichandran, M.S. and Kushwaha, S.P.S., 2001. Corridor analysis in Rajaji-Corbett Elephant Reserve- a remote sensing and GIS approach. Journal Indian Society of Remote Sensing 29(1&2), pp. 41-46.
Kushwaha, S.P.S. and Hazarika, R., 2004. Assessment of habitat loss in Kameng and Sonitpur Elephant Reserves. Current Science, 87(10), pp. 1447-1453.
Kushwaha, S.P.S., 1990. Forest-type mapping and change detection from satellite imagery. ISPRS Journal of Photogrammetry and Remote Sensing, 45, pp. 175 -181.
Kushwaha, S.P.S., Dadhwal, V.K. and Van Bloem, S.J., 2010. Remote sensing of tropical ecosystems. Tropical Ecology, 51(1), pp. 1-2.
Kushwaha, S.P.S., Mukhopadhyay, S., Hariprasad, V. and Suresh Kumar, 2010. Sustainable development planning in Pathri rao sub-watershed using geospatial techniques. Current Science, 98(11), pp. 1479-1486.
Kushwaha, S.P.S., Subramanian, S.K., Kameswara Rao, S.V.C., Ramana Murthy, J., Chennaiah, G.Ch., Perumal, A. and Behera, G., 1996. Interfacing remote sensing and GIS methods for sustainable development. Int. J. Remote Sensing 17(15), pp. 3055-3069.
Lett, C., Silber, C. and Barret, N., 1999. Comparison of a cellular automata network and an individual-based model for the simulation of forest dynamics. Ecological Modelling, 121, pp. 277-293.
Lillesand, T.M. and Kiefer, R.W., 2000. Remote Sensing and Image Interpretation (4th Edition). John Wiley and Sons, New York, pp. 736.
LUCC, 2001. What drives tropical deforestation? Report (ISSN-1138-7424), LUCC International Project Office, Louvain-la-Neuve, Belgium.
MoEF, 2010. Gajah: Securing the Future for Elephants in India. The Report of the Elephant Task Force, Ministry of Environment and Forests, Government of India, New Delhi.
Nandy, S., Kushwaha, S.P.S. and Mukhopadhyay, S., 2007. Monitoring Chilla-Motichur corridor using geospatial tools. Journal for Nature Conservation, 15(4), pp. 237-244.
Novaline, J. Krishnan, R., Rasada Raju, P.V.S.P., Saibab, J., 2008. Spatial and dynamic modelling techniques for land use change dynamics study. The International Archives of Photogrmmetry, Remote Sensing and Spatial Information. Vol. XXXVII, Part-B2, Beijing.
NRSA, 1983. Forest cover mapping in India from satellite imagery for the periods, 1972-75 and 1980-82 using Landsat MSS imagery. Summary Report, National Remote Sensing Agency, Hyderabad.
Rao, A.S., 1974. The vegetation and phytogeography of Assam-Burma. In: Ecology and Biogeography of India (ed. M.S. Mani), Dr. W. Junk b.v. Publishers, The Hague, pp. 204-245.
Rodgers, W.A. and Panwar, H.S., 1988. Planning a wildlife protected area network in India. Report, Vol-I, Wildlife Institute of India, Dehradun, pp. 53-58
Sagan, C., Toon, O.B. and Pollack, J.B., 1979. Anthropogenic albedo changes and the earth's climate. Science, 206, pp. 1363-1368.
Sala, O.E., Stuart Chapin, F., Armesto, J.J., Berlow, E., Bloomfeld, J., Dirzo, R., Huber-Sanwald, E., Huenneke, L.F., Jackson, R.B., Kinzig, A., Leemans, R., Lodge, D.M., Mooney, H.A., Oesterheld, M., Poff, M.L., Sykes, M.T., Walker, B.H., Walker, M. and Wall, D.H., 2000. Global Biodiversity Scenarios for the Year 2100. Science, 287, pp. 1770-1774.
Singh, A. and Kushwaha, S.P.S. 2010. Refining logistic regression models for wildlife habitat suitability modeling - a case study with muntjak and goral in the Central Himalayas, India. Ecological Modelling, 222(8), pp. 1354-1366.
Singh, J.S. and Kushwaha, S.P.S., 2008. Forest biodiversity and its conservation in India. International Forestry Review 10(2), pp. 292-304.
Soares-Filho B.S., Cerqueira, G.C. and Pennachin, C.L., 2002. DINAMICA- a stochastic cellular automata model designed to simulate the landscape dynamics in an Amazonian colonization frontier. Ecological Modelling, 154, pp. 217–235.
Srivastava, S., Singh, T.P., Kushwaha, S.P.S. and Roy, P.S. 2002. Mapping of large-scale deforestation in Sonitpur district, Assam. Current Science, 82(12), pp. 1479-1484.
Trimble, S.W., and Crosson, P., 2000. U.S. soil erosion rates- Myth and reality, Science, 289, pp. 248–250.
Victor, D.G. and Ausubel, J.H., 2000. Restoring the forests. Foreign Affairs, 79(6), pp. 127-144)
Vitousek, P.M., Mooney, H.A., Lubchenco, J. and Melillo, J.M., 1997. Human domination of earth's ecosystems. Science, 277, pp. 494-499.
Woodwell, G.M., Hobbie, J.E., Houghton, R.A., Melillo, J.M., Moore, B., Peterson, B.J. and Shaver, G.R., 1983. Global deforestation: contribution to atmospheric carbon dioxide. Science, 222, pp.1081-1086.