ANALYSIS OF MULTI-TEMPORAL SATELLITE DATA FOR FOREST FIRE
CHARACTERISATION OVER CENTRAL INDIAN REGION - A CLIMATE CHANGE
PERSPECTIVE
Bijan Debnath1, 2, *, TR Kiran Chand1, G Rajashekar1 & MSR Murthy1
1 Forestry & Ecology Division, National Remote Sensing Centre, Department of Space, Indian Space Research Organization, Hyderabad, India
2
University Centre for Earth and Space Sciences, Central University, Hyderabad, India * [email protected]
KEYWORDS: Forest fires, Climate, Vegetation, Temperature, GIS
ABSTRACT
Globally, forest fires are considered as one of the major drivers of climate change, altering the terrestrial ecosystems and radiation balance of the earth-atmospheric system through high carbon emissions, emissions of trace gases, aerosols and black carbon into the atmosphere (Balch et al. 2010). The current study presents the impact of air temperature variation on forest fire occurrences in Central Indian region during 2003-2010. The decadal (2001-2010) fire events in Central India were analysed in relation to Moderate Resolution Imaging Spectrometer (MODIS) derived Enhanced Vegetation Index (EVI) and Land Surface Temperature (LST) and interpolated air temperature data from Indian Meteorological Department (IMD) to characterise the regional impact of climate on fire occurrences. The study shows the exponential relation of fire with LST and rise in air temperature. There exists an inverse relation between spatial patterns of fire and EVI, which represents the intra-annual variability in fire incidences during the summer season in Central Indian region. Majority of the fire incidences are recoded in the March month of every year with highest rank in the year 2009. The linear regression relation of forest fire density and decadal mean temperature has been applied to simulate the probable fire vulnerable zones for the 2020s decade using projected temperature spatial layer from IPCC HaDCM3 (Hadley Centre Coupled Model, version 3) data.
1. INTRODUCTION
Forest fires have a large impact not only on biodiversity but also on climate change (Chuvieco et al. 2008). Remote Sensing techniques play a key role in forest fire monitoring and mitigation (Chand et al. 2006). The behaviour of fire patterns changes spatially with the change in temperature and surface properties (Fraser and Li, 2002). Fuel load inside forest governs the occurrence of fire (Chuvieco et al. 2004) along with the dryness of the fuel which indirectly determines the availability of fuel moisture (Chuvieco et al. 2004). Forest fires in India are mostly anthropogenic in origin which is triggered by human (Spyratos et al. 2007 and Matricardi et al. 2010), yet the spread and intensity of fire depends on various parameters: temperature, fuel type, fuel moisture, wind, terrain and demography (Forzieri et al., 2010). In the present study we have analyse the impact of rise in air temperature as well as its intra-annual variability on the fire temperature. Climate over the Central Indian region has represent a lot of inter-annual variations in the past decade. Variability in temperature also affects the local factors which ultimately influence the occurrence and spread of fire. With the variations and changes in climate, phenological properties of the forest also changes (David et al. 2011). The recent advancement in remote sensing techniques helps not only in the spatial and temporal fire detection but also to achieve the information of the surface phenomena like EVI and LST which has a direct impact on forest fire occurrences. Dryness in the region has been derived as a function of change in EVI from wet season to drier months with the arrival of spring followed by summer season. As the forests in this region are mainly deciduous type, leaf fall in the region starts in February month and lasts till March and April. These provide
an ample amount of fuel on the ground surface to get burnt. Thus with the on set of spring fires are also recorded and in the March month of fire incidences are at peak level. As most of the fuel got exhausted, there is a drop in fire counts from the last of April month to May. Forest in the region has good vegetation cover across the landscape with various levels of bio rich zones which consists of endemic and rare species (NRSA, 2007). Among all the variety of species presence extensive fire occurrence may alter the growth and regeneration of fire sensitive species (Clark et al. 2003), this may lead to the extinction of rare and endangered varieties.
2. MATERIALS AND METHODOLOGY
2.1 Study Area
Central Indian region have been selected for the current study, which extends from 730 50’ E to 870 33’ E meridians and 170 30’ N to 260 52’ N parallels. In this region we have taken four states, these are: Madhya Pradesh, Chhattisgarh, Jharkhand and Odisha. The total geographic area of the region is 678,857 sq. km. covering 20.65 % of whole nation. It has a forest cover of 205,319 sq. km. which records 30.25 % of the study area and 29.72 % of India’s the total forest cover (SFR 2009). The study area is mostly dominated by dry deciduous vegetation followed by Sal system which is more in north of Chhattisgarh and eastern parts of Odisha (NRSA, 2007).
2.2 Data Used
ISPRS Archives XXXVIII- 8/W20; Workshop Proceedings: Earth Observation for Terrestrial Ecosystems mapping is carried out as part of Biodiversity project using post
and pre monsoon season data sets from IRS-P6 LISS-III data. Interpolated temperature data sets from year 2001 to 2010 have been acquired from Indian Meteorological Department. Forest fire data have been obtained from MODIS- TERRA / AQUA satellite data as a part INFFRAS project for monitoring daily active fire records. EVI and LST data sets have been acquired from MODIS WIST website. Predictive temperature data for the next decade of 2020 is taken from simulated weather predictions of IPCC HaDCM3.
Figure 1: Study area 2.3 Methodology
The overall relation of forest fire vulnerability as a function of temperature and surface property variability is carried out in 4 major steps.
2.3.1 Analysis of historical fire pattern between normal and anomalous years: Current periodic fire incidences over the last decade was analysed and found a major difference in fire incidences from normal to anomalous year with recorded air temperature (IMD, 2009). Fire events from MODIS (TERRA/AQUA) with confidence level greater than 50% have been selected. These locations are filtered out for natural vegetated region only, using the biodiversity layer thus reducing agricultural fires. These incidences are segregated and analysed for various years.
2.3.2 Correlating fire occurrence with temperature variability: Relation between temperature and fire incidences developed for Chhattisgarh, one of the state of Central Indian region. Fire events information as well as mean temperature for during 2003 to 2009 has been extracted to 5x5km grid level in the GIS environment. Linear regression graph was plotted between forest fire density and mean temperature of each grid cell. The relation achieved as a result of linear regression then applied for the geospatial layer of projected climate data from IPCC HaDCM3 model to simulate the fire probable zones in the state. 2.3.3 Relating the EVI and LST impact on fire events: The study for EVI and LST is carried out at 5x5km grid scale for the whole region. Dryness index (Di) has been generated from EVI layer. Di is a measure of change in from wet season to drier season.
Here wet season is taken as November and drier seasons are followed by the preceding summer days.
The computed dryness value then extracted to the 5km grid cells along with LST and fire events recorded. The analysis has been carried out for the year 2008-09 for the Sal dominated forests of the study area. These layers information is then correlated to each other for obtaining linear relation of Di with LST and fire incidences.
Figure 2: Flow chart showing the multi-parameter analysis 2.3.4 Forest fire patterns in various phenological and vegetational regimes: Various vegetations across the forest landscape reveals different patterns of gradual phenological changes which are directly attributed to change in weather conditions. To quantify the pattern variation in fire occurrence with climate variability in different vegetation, first all the vegetation types are broadly categorized into Sal and Non Sal systems. The vegetation type layer is generated by onscreen visual interpretation of post and pre monsoon data of IRS P6 LISS-III. The Sal system is category consisted of Sal mixed and Sal gregarious type of forests. Non Sal forests are mainly grouped with dry deciduous type mixed vegetation types. This vegetation data is extracted for the 5x5km vector grid using majority function which already has layer information of EVI / Dryness. In addition to it, all the 5km cells has fire record also which belong to particular time interval. EVI of each forest types were compared with the gradual progress of summer months. In the similar manner fire density for both the vegetation type were analysed with change in julianday. These relations were plotted to understand the spatial variation in fire patterns within different vegetation types as a function of the gradual change in the surface properties with seasonal variations.
3. RESULTS AND DISCUSSIONS
3.1 Fire occurrence is analysed between normal and anomalous years
ISPRS Archives
XXXVIII-Table 1: Inter-annual variation in The graph of central India also reveals the forest fires during the peak summer season April from 2003 to 2010.
Figure 3: Intra Annual Forest fires in norma during 2003 to 2010 3.2 Variability of air temperature and probable forest fire incidences
This correlation has been generated fro (including normal and anomalous years) o against the average air temperature of the 7y The derived R value for the exponential r which suggests a positive correlation temperature variability. This exponential re for interannual variation of air temperature but also during intra-annual seasonal var The relation is applied for Chhattisgarh to fire vulnerable map for the decade 2020.
Figure 4: Forest fire density and Air Temp The map represents probable increase i increase in Southern Chhattisgarh may b compare to the other areas and consists in districts.
8/W20; Workshop Proceedings: Earth Observation for Terr
n fire incidences increased intensity of n month of March and
al and anomalous year
its impact on future
om 7years 2003-2009 of the last decade and years duration.
relation is found 0.78 n between fire and
elation not only stands during the last decade riation in temperature. o derive the simulated
mperature correlation. in fire intensity; the be more prominent as Baster and Dantewara
Figure 5: Fire vulnerable zone i 2 3.3 Influence of EVI and LST availability on fuel recorded fi
Spatial layers of the Central I dryness of forest regions as E variation. This variation is pr because of the deciduous natur have largely followed the spatia The drop in EVI results due to associated with depleting fuel This is a strong indication of surface which is also clearly v with recorded fire locations.
wet season
Figure 6: EVI of SAL
Figure 7: Fire locations of
estrial Ecosystems
in Chhattisgarh for year 2010 and 020
T as a scale of dryness and fuel ire incidences
Indian region reveal the gradual EVI value changes with seasonal redominant over the study area re of forests. Historic fire events al contours of drop in EVI value. leaf fall summer season. It is also moisture and litter accumulation. fuel accumulation on the ground visible from FCC of Chhattisgarh
dry season
L dominated vegetation
ISPRS Archives XXXVIII- 8/W20; Workshop Proceedings: Earth Observation for Terrestrial Ecosystems The graduating summer also bring spatial change in Land Surface
Temperature (LST). This can be observed over the Central Indian region as a part of the intra-annual seasonal variations. The rise in LST is directly proportional to increment in dryness as shown in the graph with R2 value as 0.86 which indicates the heating of accumulated fuel on the surface. The dead fuel gets heat up faster than live fuel, although the present study does not carried for the quantification of dead and live fuel.
Figure 8: Graphical relation between LST and Dryness index
3.4 Variation in fire incidences in different phenological and vegetational regimes
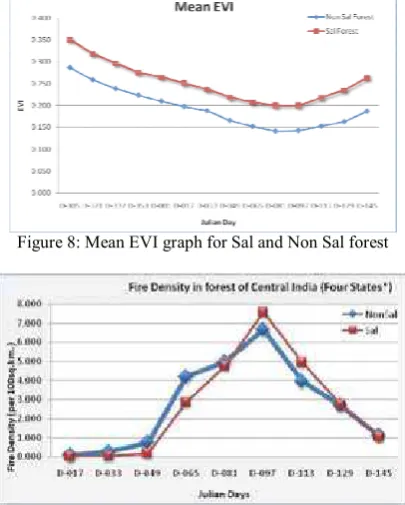
The plotted for both the vegetation types for the mean EVI value with the gradual seasonal variation represents the drop in EVI for both the forest types followed by the gain in EVI after 81st Julian day. The decrease in EVI of Sal system is less as compare to Non Sal system which suggests that the species present have good moisture retaining capacity.
Figure 8: Mean EVI graph for Sal and Non Sal forest
Figure-9: Fire regimes of Non Sal dominated regions over central India
The fire density pattern in both vegetation types varies with the intra-annual variation in weather. March is found as the peak recorded fire incidence month followed by April month for both the categories, yet the rate of change in fire occurrence is different for both types. The fire density in Non Sal system rise steeply after 49th Julian day but in Sal system it follows a constant growth. The graph also represent the highest fire density in Sal system compare to Non Sal forest even when the fire events are less in numbers. This gives a strong correlation of fire incidences with associated phenological changes which occurs in various levels for Sal and non Sal dominated regions depending with the seasonal variation.
$ $
%&)' )' ' ( ((
%&** +* (,( (*)
%&+( ))* )* (' ()'* %&, ,' ,( +()(* (* %&) '+ *'') +((,) +('+) %&(' (( , ,(,,, '(, %&))* ( *(*) *((( +((+ %&)( ++ )+ (' ('+, %&)+ ),+ * )() )(+* )%":*);(<= $(+)
%"
Table 2: Fire incidences in Sal and Non Sal forest system 4. CONCLUSIONS
GIS acts as robust tool for bringing various spatial layer information to one vector grid. Historical fire patterns from 2003 to 2010 have changed drastically. Exponential growth in fire occurrences have been found with correlation to intra-annual and inter-annual air temperature variations. There is an increment in fire incidences during the anomalous and drought year 2009 which attributes to abnormal temperature rise. Spatial patterns of fire vulnerable zones may increase by the next decade as a result of increased air temperature predicted by HaDCM3 model. Fire incidences followed spatial variation in surface properties (EVI and LST). Increased fire density in forest regions have been observed for intra-annual drop in EVI which inferred to the increased dryness in the region. Also the spatial patterns for EVI and fire incidences vary in Sal and Non Sal dominated forest areas. In this view remote sensing would assist a powerful mechanism for monitoring the changes in surface phenomenon with phenological changes. The study will further facilitate in the development of fire danger rating system for forest fire mitigation planning at high vulnerable zones. The impact of human intervention (in fire ignition and suppression) and terrain parameters have not been quantified in this paper, and will be a part of future studies.
REFERENCES
Balch, Jennifer K., Daniel C. Nepstad, Paulo M. Brando, Ane Alencar, 2010. Comment on ''The Incidence of Fire in Amazonian Forests with Implications for REDD''. Science 330, pp.1627
ISPRS Archives XXXVIII- 8/W20; Workshop Proceedings: Earth Observation for Terrestrial Ecosystems Chuvieco, Emi Lio, David Cocero, David Rian˜o, Pilar Martin,
Javier Martı´nez-Vega, Juan de la Riva, Fernando Pe´rez, 2004. Combining NDVI and surface temperature for the estimation of live fuel moisture content in forest fire danger rating. Remote Sensing of Environment 92, pp.322–331.
Chuvieco, Emi Lio, Louis Gigl Io and Chris Justice, 2008. Global characterization of fire activity: toward defining fire regimes from Earth observation data. Global Change Biology, 14, pp.1488– 1502.
Clark, D. A., S. C. Piper, C. D. Keeling, and D. B. Clark, 2003. Tropical rain forest tree growth and atmospheric carbon dynamics linked to interannual temperature variation during 1984–2000. PNAS, 100 (10) pp. 5852-5857
Fraser, R.H., Z. Li, 2002. Estimating fire-related parameters in boreal forest using SPOT VEGETATION. Remote Sensing of Environment 82 pp. 95–110
India State of Forest Report, Forest Survey of India, 2009
Indian Meteorological Department Annual Report 2009
Kiran Chand, T.R., K.V.S. Badarinath, V. Krishna Prasad, M.S.R. Murthy, Chris D. Elvidge and Benjamin T. Tuttle, 2006. Monitoring forest fires over the Indian region using Defense
MeteorologicalSatellite Program-Operational Linescan System nighttime satellite data. Remote Sensing of Environment, 103, pp. 165–178.
Lindenmayera, David B., Richard J. Hobbs, Gene E. Likensa, Charles J. Krebs, and Samuel C. Banks, September 20, 2011. Newly discovered landscape traps produce regime shifts in wet forests. PNAS, 108 (38), pp. 15887-15891.
Spyratos,Vassilis, Patrick S. Bourgeron, and Michael Ghil, 2007. Development at the wildland–urban interface and the mitigation of forest-fire risk. PNAS 104 (36), pp. 14272–14276
ACKNOWLEDGEMENT