POLYGONAL SHAPES DETECTION IN 3D MODELS OF COMPLEX ARCHITECTURES
G.B. Benciolinia,, A. Vittia,∗
aDICAM, University of Trento, 38123 Trento, Italy
Commission V, WG V/4
KEY WORDS:Variational modes, global models, geometric data, corner detection, polygonal shapes
ABSTRACT:
A sequential application of two global models defined on a variational framework is proposed for the detection of polygonal shapes in 3D models of complex architectures.
As a first step, the procedure involves the use of the Mumford and Shah (1989) 1st-order variational model in dimension two (gridded height data are processed). In the Mumford-Shah model an auxiliary function detects the sharp changes, i.e., the discontinuities, of a piecewise smooth approximation of the data. The Mumford-Shah model requires the global minimization of a specific functional to simultaneously produce both the smooth approximation and its discontinuities.
In the proposed procedure, the edges of the smooth approximation derived by a specific processing of the auxiliary function are then processed using the Blake and Zisserman (1987) 2nd-order variational model in dimension one (edges are processed in the plane). This second step permits to describe the edges of an object by means of piecewise almost-linear approximation of the input edges themselves and to detects sharp changes of the first-derivative of the edges so to detect corners. The Mumford-Shah variational model is used in two dimensions accepting the original data as primary input. The Blake-Zisserman variational model is used in one dimension for the refinement of the description of the edges.
The selection among all the boundaries detected by the Mumford-Shah model of those that present a shape close to a polygon is performed by considering only those boundaries for which the Blake-Zisserman model identified discontinuities in their first derivative. The output of the procedure are hence shapes, coming from 3D geometric data, that can be considered as polygons. The application of the procedure is suitable for, but not limited to, the detection of objects such as foot-print of polygonal buildings, building facade boundaries or windows contours.
The procedure is applied to a height model of the building of the Engineering Faculty of the University of Trento and to other data. The obtained results show the effectiveness of the variational methods in handling geometric data describing complex objects. The most original and innovative contributions of this work are:
- the consecutive and coordinated use of the proper variational models (of first and second order respectively) at first in two dimension and subsequently on the one dimensional sets arising in the first segmentation,
- the application to geometrical data that represent a quite complex architecture.
1. INTRODUCTION
The detection of polygonal shapes as, for example, building foot-prints, facade boundaries and window contours, can serve for the construction of vector models of architectures, in particular for essential polyhedral volumes with polygonal faces. Polygonal shapes can be selected from a set of shapes of various type de-tected by the processing of geometric data. A set of shapes can be produced by finding edges in the geometric data.
In this work a procedure for the detection of edges and the subse-quent identification of polygonal shapes is presented. Two global models are exploited to accomplish the main goals of the proce-dure.
The procedure starts with the application of the Mumford-Shah variational model (Mumford and Shah, 1989) to height data for the detection of sharp changes (edges, discontinuities) of a piece-wise smooth approximation of the data. The edges of such ap-proximation of height data are then processed using the Blake-Zisserman variational model (Blake and Blake-Zisserman, 1987). The output of the Blake-Zisserman model is finally treated to identify those edges that can be approximates as piecewise almost-linear curves connected by corners, i.e., polygonal shapes.
∗Corresponding author ([email protected])
The key idea behind the proposed procedure is deeply related to the characteristics of the same variational models involved. A concise description of the main characteristics of the models is given hereafter so to outline the basic elements that driven the definition of the procedure. Details about the models and their application will be given in the next two sections.
The Mumford-Shah model is an energy functional built up of three terms depending on two unknown quantities of very dif-ferent kind. One unknown is a piecewise continuous function that must smoothly approximate the data almost everywhere in the data domain. The second unknown is the set of the curves of the data domain where the requirements on the continuity and on the smoothness of the approximating functions are not imposed, i.e. a set of discontinuities. The smoothness of the approximating function is controlled my a specific term of the first order involv-ing the gradient of such function. The other two terms measure the proximity of the unknown approximation to the data and the length of the discontinuity set. The length of the discontinuity set needs to be controlled to avoid over-segmented approximations. The relative strength of the three terms is governed by specific weight parameters. To find the two unknowns one has to mini-mize the energy functional, globally over the entire data domain.
repre-senting jumps in the height data. Since buildings have, in general, a polygonal footprint, the idea is to select those regions that can be described as polygonal shapes, i.e., a set of linear segments jointed by corners.
The Mumford-Shah model can not be directly used for the re-covery of corners or junctions in the curves of the discontinuity set because only the length of the discontinuity set is controlled and because the presence of corners and junctions does not af-fect the measure of the length of the set. A further process of the Mumford-Shah output is hence needed to explicitly detect cor-ners and edges that can be approximated by a piecewise almost-linear curve, i.e,. a polygonal shapes. A variational model of the second order proposed by Blake and Zisserman (1987) has been involved to accomplish this second step of the procedure. The Blake-Zisserman model is an energy functional depending on a piecewise continuous function that smoothly approximates the data and on two discontinuity sets. In the model not only the ap-proximating function but also its first derivative is requested to be piecewise continuous. Moreover, the smoothness of the function is controlled by a term of the second order involving the second derivative of the approximating function. These two facts leave as unknown the two discontinuity set, one for the discontinuity of the approximating function and one for the discontinuities of its first derivative. Also for the Blake-Zisserman model, the un-knowns can be found minimizing the energy functional, globally over the entire data domain.
The Blake-Zisserman model is applied to the boundaries of the homogeneous regions detected by the application of the Mumford-Shah model to height data. The presence of a corner in a bound-ary will be detectable by observing the discontinuity set of the first derivative of the function that smoothly approximates the boundary.
For technical reasons, the computation of the solution of both variational models requires the discontinuity sets to be described by means of some specific auxiliary functions. The functions that represents the discontinuity sets have been mainly intended as down-weighting functions of the smoothing terms, but in fact in many applications they are a quite useful outcome of the models.
The described procedure has been implemented into a series of original computer programs that have been extensively tested on a variety of both simulated and real data, including optical images and geometric data (Vitti, 2012a,b; Zanetti and Vitti, 2013). Af-ter many application with land images and laboratory images this work extends the application range of the Mumford-Shah model and of the Blake-Zisserman model to data of a complex architec-ture.
The metric quality of the result is obviously related to the res-olution and to the overall accuracy of the data. The method is anyway quite claver in filtering out the unavoidable noise.
2. TWO GLOBAL MODELS
The Mumford-Shah model and the Blake-Zisserman model will be described to highlights their main characteristics. Deeper treat-ments on the subject are available in the literature and will be pointed out at the need.
2.1 The Mumford-Shah model
The Mumford-Shah model in dimension two is:
MS(u, K) = 1-dimensional Hausdorff measure of the set. The first term in (1) is a global measure of the proximity of the solutionuto the data, the smoothness of the functionuis induced by the second term, the last term is the so called geometric term measuring the length of the unknown setK. The parametersλandαcontrols the rel-ative strength of the three terms. The problem here is to find the pair(u, K)that minimizes the Mumford-Shah energy functional.
To solve the problem in practice it is necessary to work on a func-tional different from (1). Ambrosio and Tortorelli (1992) pro-posed to solve the Mumford-Shah variational problem by means of the following functional:
The explanation of the need for a new functional and of its defini-tion requires mathematical tools and developments that are well outside the scope of this work. We just highlight here the main characteristics of (2) that make it treatable in practice and that dis-tinguish it from (1). All the terms of the functionalFǫ(u, s)are defined over the entire domainΩ, the smooth term is now scaled by a new auxiliary functionsand the third term of (1) has been replaced by a functional ofs. This last quadratic functional ap-proximates theH1measure of the discontinuity setKexploiting the auxiliary functionswhich is defined on the bi-dimensional domainΩ. The function shas another specific role: to down-weight the gradient of the approximating functionuby going to
0right were the gradient of utakes big values and remaining close to 1almost everywhere onΩ. The parameterǫthat ap-pears in (2) is a convergence parameter. In fact it is a sequence of functionals likeFǫ(u, s)that is proved to approximate, according
to a particular type of convergence criterion (Braides, 2002), the Mumford-Shah functional (whenǫgoes to zero, the minimizers of (2) converge to the minimizers of (1)).
To better understand the output of the Mumford-Shah model we highlight that the auxiliary functionshas values close to0either where the approximating functionuhas very big gradient, i.e., where it is discontinuous, or where the approximating function uis not homogeneous with respect to the smoothness measure expressed by the second term of the functional (scaled by the parameterλ). In this work the functionswill be used to identify parts ofΩwith homogeneous values ofuwhose boundaries will be further processed to select those having a polygonal structure.
2.2 The Blake-Zisserman model
The Blake-Zisserman functional in dimension one is:
points. The parametersλ,αandβcontrol the relative strength of the four terms. The problem here is to find the triplet(u, K0, K1) that minimizes the Blake-Zisserman energy functional.
For reasons similar to those requiring a sequence of approximat-ing functionals to find the minimizers of the Mumford-Shah func-tional, also the Blake-Zisserman functional needs to be properly approximated in order to be used in practice. Ambrosio et al. (2001) proposed to solve the Blake-Zisserman variational prob-lem by means of the following functional:
Gǫ(u, s, z) =
In (4) the new auxiliary functionzis introduced to approximate the discontinuity setK1following the reasoning that lead the in-troduction of the approximating functionsin (2). The function zis close to0on the discontinuities of the first derivative of the approximating functionuand close to1almost everywhere onI.
In this work the functionzwill be used to identify sharp changes in the coordinates of the points lying on the boundary of the ho-mogeneous regions detected using the Mumford-Shah model and to identify where the variation of point coordinates is almost-linear. Sharp changes in the point coordinates, wherez values shrink to0, are expected to correspond to corners. The function zremains close to1on the parts ofIcorresponding to straight segments.
3. APPLICATIONS
The applications presented hereafter have been realized using orig-inal software implementing the Mumford-Shah model in dimen-sion two and the Blake-Zisserman model in dimendimen-sion one. The source code is available atwww.ing.unitn.it/~vittia/swand licensed as Free Software.
3.1 Example 1
A first example illustrates the use of the Blake-Zisserman model for the detection of corners and straight segments on a line. A wall plan of small Church is processed. The plan has been ob-tained by slicing the 3D point clouds of the Church acquired us-ing a terrestrial laser-scanner.
To apply the 1D BZ model to a plane curve (the boundary of a 2D flat object) we make use of the curvilinear coordinate on the curve. When dealing with discrete data, we work with the set of Cartesian coordinates of points on the plane (assumed to lie on a unknown continuous curve) and with a discrete implementa-tion of the Blake-Zisserman model. The curvilinear coordinate of the points is approximated by the chordal coordinateccomputed as the summation of the euclidean distances between successive points. The discrete Blake-Zisserman model is the applied twice: once to the coordinate pair(c, x)and once the the coordinate pair
(c, y).
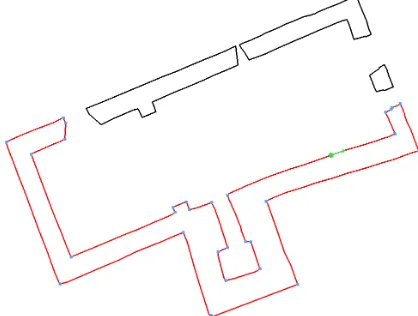
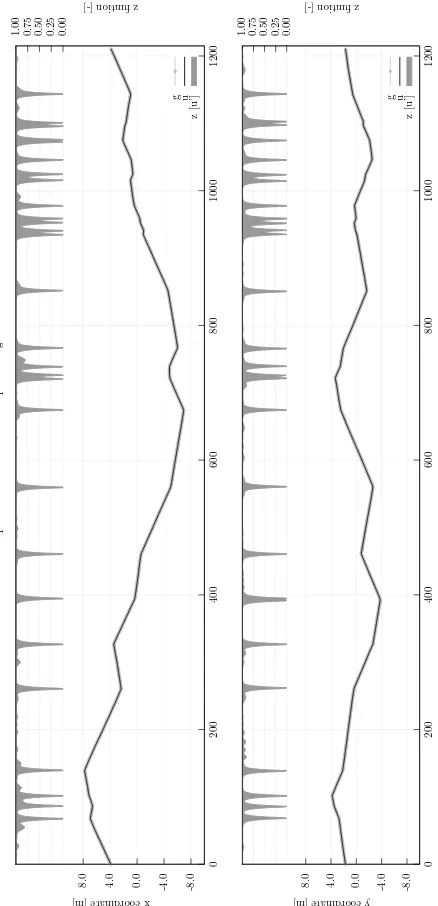
Figures (1) and (2) show a view of the point cloud and the wall plan of the Church respectively. The plot of the auxiliary func-tionzproduced by applying the Blake-Zisserman model to the red element of the wall plan of Figure (2) is given in Figure (3). The cyan dots of figure (2) have been placed on the wall plan
using the coordinates of the points where the auxiliary function z equals0in the plots of Figure (3). The green dot locates the point with coordinatec = 0and the green arrow indicates the verse of increasing of the coordinate. It is possible to note how the auxiliary functionzin the plots of Figure (3) remains close to1between the points where it shrinks to0. This fact can be exploited to identify the straight segments that compose the red curve of (2).
Figure 1: View of the point cloud of a small Church
Figure 2: Wall plan of the small Church of Figure (1), with pro-cessed element in red, detected corners represented with cyan dots
3.2 Example 2
This example illustrates the plot of the auxiliary functions ob-tained by applying the Mumford-Shah model to a gridded point cloud of a facade of an industrial building. The boundaries of the homogeneous parts of the facade have been further treated using the Blake-Zisserman model to identify the contours of the facade windows.
B
Figure 3: Plot of the auxiliary functionzproduced by the Blake-Zisserman model applied to the red element of the wall plan of Figure (2)
3.3 Example 3
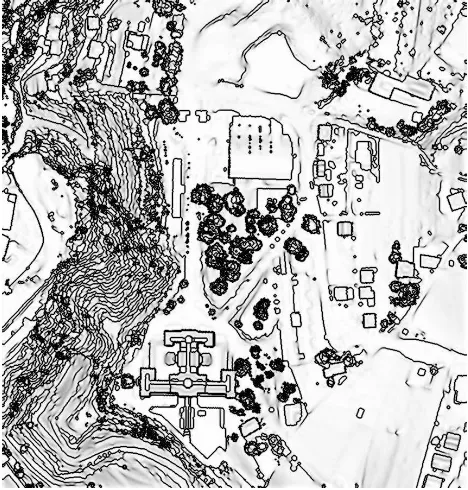
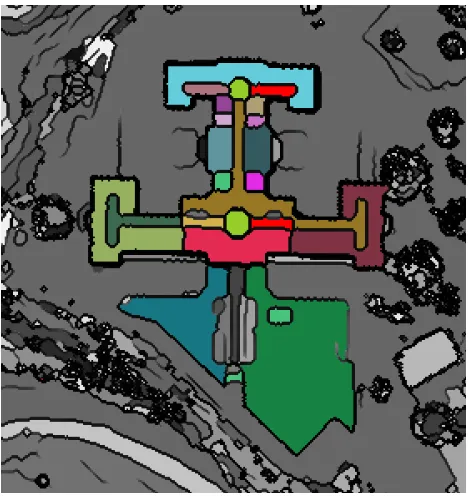
In this example the Mumford-Shah model is applied to a high-resolution (0.5mx0.5m) Digital Surface Model (DSM) of an area including a polygonal building of complex architecture. Again the boundaries of the homogeneous parts of the DSM detected using the plot of the Mumford-Shah auxiliary functions have been processed using the Blake-Zisserman model to identify the polygonal elements of the building.
Figure (8) shows an aerial view of the building. Figures (9) and (10) give the plot of the Mumford-Shah auxiliary functionufor the entire study area and a detail of the close surrounding of the building. It is possible to observe how the auxiliary function de-scribes not only the discontinuities of the approximating func-tionubut also the domain parts where the functionuis not ho-mogeneous (in light gray). In figure (10) there are some lines
Figure 4: Geometry model of the facade of an industrial building
Figure 5: Details of the original model of the facade of Figure (4) (top) and of its smooth approximation (bottom)
homoge-Figure 6: Plot of the auxiliary function s produced by the Mumford-Shah model applied to the facade of Figure (4)
Figure 7: Polygonal shapes (in green and orange) identified from the analysis of the Blake-Zisserman model applied to the bound-aries of the homogeneous regions detected after the application of the Mumford-Shah model to the facade of Figure (4)
neous regions detected after the application of the Mumford-Shah model.
4. DISCUSSIONS AND OUTLOOKS
The Mumford-Shah and Blake-Zisserman models produce an op-timal segmentation of the data by means of the minimization of specific energy functionals. In practice, the main difference be-tween the two models is in the feature of the smoothing term that is of the first order in (1) and of the second order in (3). Beside this difference the Blake-Zisserman model also permits the de-tection of discontinuities of the first derivative of the function that approximates the data. In treating geometric data the Mumford-Shah model can manifest an important limitation related to the feature of the smoothing term. In presence of strong variation of the data the smoothing therm, being of the first order, may lead to a over-segmented approximation of the data, i.e., to the appearance of spurious discontinuities. A proper choice of the
Figure 8: Aerial view of a complex building
Figure 9: Plot of the auxiliary functionsgiven by the Mumford-Shah model applied to the DSM
weigh parameters of (2) can however allow to process geometric data without the appearance of this kind of defects. The use of the Blake-Zisserman model with bi-dimensional geometric data is however feasible and may be more appropriate than the use of the Mumford-Shah model (Zanetti and Vitti, 2013).
Figure 10: Detail of the plot of the auxiliary functionsin the close surrounding of the building of Figure (8)
Figure 11: Polygonal shapes (in colors) identified from the anal-ysis of the Blake-Zisserman model applied to the boundaries of the homogeneous regions detected after the application of the Mumford-Shah model to the DSM
In this work the Mumford-Shah model has been applied to grid-ded data. Changing the numerical scheme would make possible the application of the model to unstructured data (Bourdin and Chambolle, 2000; Zanetti and Bruzzone, n.d.).
An interesting extension of the procedure presented in this work may exploit a variational model proposed by Braides and March (2006) that extends the features of the Mumford-Shah to permit a direct detection of corners along the discontinuity set of the smoothing approximating function.
References
A. Borghi, L. Cannizzaro, A. V., n.d. Geodesy for Planet Earth - International Association of Geodesy Symposia. Vol. 136, chapter Advanced techniques for discontinuity detection in GNSS coordinate time-series. An Italian case study.
Ambrosio, L. and Tortorelli, V. M., 1992. On tha approxima-tion of free discontinuity problems. Boll. Un. Mat. Ital. B (7), pp. 105–123.
Ambrosio, L., Faina, L. and March, R., 2001. Variational ap-proximation of a second order free discontinuity problem in computer vision. Siam J. Math. Anal. 32, pp. 1171–1197.
Ambrosio, L., Fusco, N. and Pallara, D., 2000. Functions of bounded variation and free discontinuity problems (Oxford Mathematical Monographs). Oxford University Press.
B. Benciolini, M. Reguzzoni, G. V. A. V., 2009. VII Hotine-Marussi Symposium on Mathematical Geodesy - International Association of Geodesy Symposia. Vol. 137, Springer, chapter Bayesian and Variational methods for discontinuity detection: theory overview and performance comparison, pp. 147–152.
Blake, A. and Zisserman, A., 1987. Visual Reconstruction. MIT Press.
Bourdin, B. and Chambolle, A., 2000. Implementation of an adaptive finite-element approximation of the mumford-shah functional. Numerische Mathematik 85(4), pp. 609–646.
Braides, A., 2002. Gamma-convergence for Beginners. Oxford University Press.
Braides, A. and March, R., 2006. Approximation by gamma-convergence of a curvatudepending functional in visual re-construction. Communications on Pure and Applied Mathe-matics 59(1), pp. 71–121.
De Giorgi, E., 1991. Frontiers in Pure and Applied Mathemath-ics, a collection of papers dedicated to J.L. Lions on the oc-casion of his 60th birthday. North-Holland P.C., chapter Free discontinuity problems in calculus of variations, pp. 55–62.
Mumford, D. and Shah, J., 1989. Optimal approximations by piecewise smooth functions and associated variational prob-lems. Comm. Pure Appl. Math. 42, pp. 577–685.
Vitti, A., 2012a. The mumfordshah variational model for image segmentation: An overview of the theory, implementation and use. ISPRS Journal of Photogrammetry and Remote Sensing 69, pp. 50–64.
Vitti, A., 2012b. Sigseg: a tool for the detection of position and velocity discontinuities in geodetic time-series. GPS Solutions 16(3), pp. 405–410.
Zanetti, M. and Bruzzone, L., n.d. Edge-crease detection and surface reconstruction from point clouds using a second-order variational model. In: Proc. SPIE 9244, Image and Signal Pro-cessing for Remote Sensing XX.