HOPC: A NOVEL SIMILARITY METRIC BASED ON GEOMETRIC STRUCTURAL
PROPERTIES FOR MULTI-MODAL REMOTE SENSING IMAGE MATCHING
Yuanxin YE a,b, *, Li SHEN a,b
a
State-province Joint Engineering Laboratory of Spatial Information Technology for High-speed Railway Safety, Southwest Jiaotong University, 611756, China - (yeyuanxin, lishen)@home.swjtu.edu.cn
b
Collaborative innovation center for rail transport safety, Ministry of Education, Southwest Jiaotong University, 611756, China - (yeyuanxin, lishen)@home.swjtu.edu.cn
Commission I, WG I/2
KEY WORDS: Multi-modal Remote Sensing Image, Image Matching, Phase Congruency, Similarity metric, HOPC,
ABSTRACT:
Automatic matching of multi-modal remote sensing images (e.g., optical, LiDAR, SAR and maps) remains a challenging task in remote sensing image analysis due to significant non-linear radiometric differences between these images. This paper addresses this problem and proposes a novel similarity metric for multi-modal matching using geometric structural properties of images. We first extend the phase congruency model with illumination and contrast invariance, and then use the extended model to build a dense descriptor called the Histogram of Orientated Phase Congruency (HOPC) that captures geometric structure or shape features of images. Finally, HOPC is integrated as the similarity metric to detect tie-points between images by designing a fast template matching scheme. This novel metric aims to represent geometric structural similarities between multi-modal remote sensing datasets and is robust against significant non-linear radiometric changes. HOPC has been evaluated with a variety of multi-modal images including optical, LiDAR, SAR and map data. Experimental results show its superiority to the recent state-of-the-art similarity metrics (e.g., NCC, MI, etc.), and demonstrate its improved matching performance.
* Corresponding author. Yuanxin YE, [email protected] 1. INTRODUCTION
Image matching is a prerequisite step for a variety of remote sensing applications including image fusion, change detection and image mosaic. The accuracy of image matching has a significant impact on these applications. Although there has been rapid development of automatic image matching techniques in the last decade, in practice these techniques often require the manual selection of tie-points(or correspondences) for multi-modal remote sensing images, especially for the optical-to-Synthetic Aperture Radar (SAR) or optical-to-Light Detection and Ranging equipment (LiDAR) images. This is because there can be significant geometric distortions and radiometric (intensity) differences between these images.
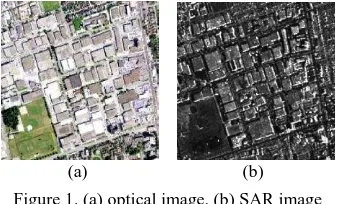
(a) (b) Figure 1. (a) optical image. (b) SAR image
Current technologies enable remote sensing images to be directly georeferenced by applying the physical model of sensors and the navigation instrument's onboard satellites, which results in the images only having the position offsets of several or a couple of dozen pixels relative to any other precisely georeferenced imagery (Goncalves et al. 2012). This allows global geometric distortions such as obvious translation,
rotation and scale differences between images to be removed by the direct georeferencing techniques. In view of this, the main difficulties remaining for multi-modal remote sensing image matching are non-linear radiometric differences. Figure 1 shows a pair of optical and SAR images. The two images have quite different intensity and texture patterns despite capturing the same scene, making tie-point detection much more difficult than previously. Therefore, the goal of this paper is to find a robust matching method that is resistant to non-linear radiometric differences between multi-modal remote sensing images. In general, image matching methods can be classified as feature-based and area-feature-based methods (Zitova and Flusser 2003). Feature-based methods first extract the features from images and then use the similarities between these features to detect tie-points between images. Common feature-based methods include point-based methods (Han et al. 2014), line or edge-based methods (Sun et al. 2015), region-based methods (Gonçalves et al. 2011), and local invariant features-based methods(Sedaghat and Ebadi 2015). However, when these types of methods are applied to process multi-modal images, significant non-linear radiometric differences between images make it difficult to detect highly-repeatable shared features, degrading the matching performance (Suri and Reinartz 2010).
Area-based methods are another type of processing method, which use similarity metrics to detect tie-points between images using a template matching scheme. Compared with feature-based methods, area-feature-based methods have the following advantages: (1) area-based methods avoid the requirement for the shared feature detection that usually has a low-repeatability between multi-modal images; (2) area-based methods can detect
tie-points within a small search region because most remote sensing images can be directly georeferenced so that there are only a few pixels differences between such images. Additionally, some current commercial software packages for remote sensing image processing such as ERDAS and ENVI, use area-based methods for their automatic image matching functional modules. This indicates that area-based methods may be somewhat more suitable for practical applications.
Similarity metrics play a decisive role in area-based methods. The common similarity metrics are normalized cross correlation (NCC), mutual information (MI) (Cole-Rhodes et al. 2003), and Matching by Tone Mapping (MTM) (Hel-Or et al. 2014). However, these similarity metrics cannot effectively handle non-linear radiometric differences between images because the intensity information is directly used to detect tie-points. In contrast, geometric structural properties of images are more resistant to non-linear radiometric differences. Figure 1 shows that contour shapes and geometric structures are quite similar between the optical and SAR images, despite their very different intensity and texture characteristics. This observations motivate us to develop a novel similarity metric using geometric structural features of images to address the problem of non-linear radiometric differences between multi-modal images in the framework of area-based methods.
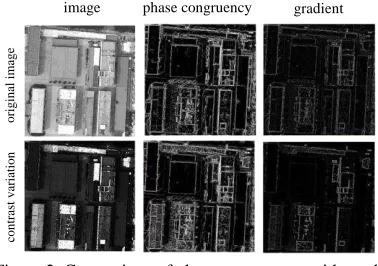
Figure 2. Comparison of phase congruency with gradient It should be noted that geometric structural features can be usually represented by gradient information, but it is sensitive to radiometric changes between images. In comparison, the phase congruency feature has been demonstrated to be more resistant to illumination and contrast variation (Kovesi 1999), as shown in Figure 2. This characteristic makes it insensitive to radiometric changes. However, the conventional phase congruency model can only obtain its magnitude that is insufficient for geometric structural feature description. Therefore, we expand the phase congruency model to build its orientation information. and use the magnitude and orientation of this model to construct a novel descriptor that captures geometric structure features, which is referred to as the Histogram of Orientated Phase Congruency (HOPC). The NCC between HOPC descriptors is used as the similarity metric (also named HOPC), and a fast template matching scheme is designed to achieve tie-points between images.
The main contributions of this paper are the follows: (1) extend the phase congruency model to build the orientation representation of this model; (2) develop a novel similarity metric based on geometric structure properties for multi-modal remote sensing image matching using the magnitude and orientation of phase congruency, and design a fast template
matching scheme for HOPC. The code and supplementary materials can be downloaded from this website1
2. METHODOLOGY
Given a reference image and a sensed image, the aim of image matching is to identify the tie points between the two images. In this section, we will present a geometric structure feature descriptor named HOPC and its use to define the similarity between two images based on the NCC of the descriptors. Our approach is based on the assumption that multi-modal images share similar geometric structural properties despite having very different intensities and textures. In this section, the phase congruency model is first extended to construct its orientation representation, and then a novel similarity metric based on geometric structural properties is developed using the extended phase congruency model.
2.1 Extended Phase Congruency
Many current feature detectors and descriptors are based on gradient information, including Sobel, Canny, SIFT, etc. These operators are usually sensitive to image illumination and contrast changes. By comparison, phase information is more robust to these changes. Oppenheim et al. analyzed the function of phase information for image processing, and found that phase information is even more important than amplitude information (Oppenheim and Lim 1981). This conclusion is clearly illustrated in Figure 3. We take the Fourier transforms of image
a
I and Ib , and use the phase information of Ia and the magnitude information of Ib to construct a new, synthetic Fourier transform which is then back-transformed to produce a new image Ic. It can be observed that Ic mainly reflects the
contour information of Ia, which shows that the contour and
structural features of images are mainly provided by phase information.
(a) (b) (c)
Figure 3. The importance of phase information of images. (a) the image Ia . (b) the image Ib . (c) the synthetic image
constructed using the phase information of Ia and the
magnitude information of Ib.
Since phase information was demonstrated to be so important for image perception, it is natural to use phase information for feature detection. Phase congruency is a feature detector based on the local phase information of images, which postulates that the features such as corners and edges are presented where the Fourier components are maximally in phase. Phase congruency can be calculated using log Gabor wavelets over multiple scales and orientations by following formula
( , ) ( , ) ( , ) ( , )
( , )
o no no o n
no o n
W x y A x y x y T
PC x y
A x y
(1)
1
https://www.dropbox.com/s/ozpnx2qunegih0a/HOPC%20code%20and%2 0supply.rar?oref=e&n=552393840
original
image
image phase congruency gradient
contrast
var
iation
where PC x y( , ) is the magnitude of the phase congruency; ( , )x y indicates the coordinates of the point in an image; W x yo( , ) is the weight factor for a frequency spread;Ano( , )x y is the amplitude at ( , )x y at wavelet scale n and orientation o ; no( , )x y is a more sensitive phase deviation; T is a noise threshold, and is a small constant to avoid division by zero. denotes that the enclosed quantity is equal to itself when its value is positive, and zero otherwise.
-20 -10 0 10 20
(a) (b)
Figure 4. The log Gabor odd-symmetric wavelet. (a) the 3-D shape of this wavelet. (b) the 2-D shape of this wavelet.
2.1.1 Orientation of Phase Congruency: The above mentioned phase congruency model is insufficient to describe image features such as geometric structural information because only magnitude information can be acquired from this model. Therefore, we extend the phase congruency model to achieve its orientation information using log Gabor odd-symmetric wavelets. The orientation of phase congruency, similar to gradient orientation, represents the most rapid direction of feature variation, which is crucial for feature description.
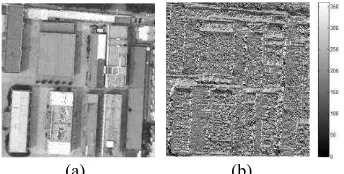
(a) (b)
Figure 5. The orientation of phase congruency. (a) the image. (b) its orientation of phase congruency.
Figure 4 shows the log Gabor odd-symmetric wavelet. This wavelet is a smooth derivative filter that can compute the image derivative in a single direction (Moreno et al. 2009). Since log Gabor odd-symmetric wavelets with multiple orientations are used in the computation of phase congruency, we project the convolution results of the wavelets in the horizontal and vertical direction to obtain the horizontal derivative a and the vertical derivative b respectively. The orientation of phase congruency is defined by Eq. (2). Figure 5 illustrates the orientation of phase congruency, which has values ranging is from 0°to
360°.
( ( ) cos( )) ( ( )sin( )) arctan( , )
no
no
a o
b o
b a
(2)where is the orientation of phase congruency and ono( ) denotes the convolution results of odd-symmetric wavelet. 2.2 Geometric structure similarity metric
In this subsection, we will develop a feature descriptor named HOPC, which captures geometric structural properties by the magnitude and orientation of phase congruency, and we also build a geometric structural similarity metric on the basis of this descriptor. HOPC is inspired from Histograms of Oriented Gradient (HOG) (Dalal and Triggs 2005) that can effectively describe local object appearance and shape through the distribution of local gradient magnitudes and orientations. Our descriptor is based on evaluating a dense grid of well-normalized local histograms of phase congruency orientations over a template window selected in an image. Figure 6 presents the main processing chain of the descriptor. The steps of this process is as follows.
(1) The first step is to select a template window with a certain size in an image, and then compute the phase congruency magnitude and orientation for each pixel in this template window, in order to provide the feature information for HOPC.
(2) The second step is to divide the template window into some overlapping blocks, where each block consists of m×m some small spatial regions, called "cells" containing n×n pixels. This process forms the fundamental framework of HOPC.
(3) The third step is to accumulate a local histogram of phase congruency orientations over all the pixels within cells of each block. Each cell is first divided into a number of orientation bins which are used to form the orientation histograms, and then the histograms are weighted by phase congruency magnitudes using a trilinear interpolation method. The histograms for the cells in each block are normalized by the L2 norm to achieve a better invariance to illumination and shadowing. This process produces the HOPC descriptor for each block. It should be noted that phase congruency orientations need to be limited to a range between 0 and 180°to construct orientation histograms of blocks, in order to handle the intensity inversion between multi-modal images.
(4) Finally, we collect the HOPC descriptors from all blocks within a dense overlapping grid covering the template window into a combined feature vector which can be used for the template matching.
Feature vectors v={x1,…….xn} Template window
Phase congruency magnitude and
oriention
Divide the window into blocks consist
of some cells
Accumulate orientation histograms for cells
and blocks
Collect HOPCs for all blocks over template
window
cell
block
Figure 6. The main processing chain of the HOPC descriptor
overlap of block
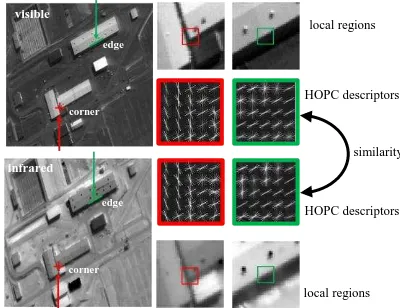
As mentioned above, HOPC is a feature descriptor that captures the internal geometric layouts of images. As such, this descriptor can be used to match two images with different intensity patterns as long as they both have similar layouts or shapes. Figure 7 shows the HOPC descriptors computed from the corner and edge regions of the visible and infrared images of the same scene. The HOPC descriptors are quite similar despite the large radiometric differences between the two images.
Figure 7. HOPC descriptors of the visible and infrared images in the corner and edge regions
Considering the similarity of geometric structural features between multi-modal images, the NCC between the HOPC descriptors is regarded as the similarity metric (also named HOPC) for image matching.
To illustrate HOPC's advantage in matching multi-modal images, it is compared to NCC, MTM and MI by the similarity curve. A pair of images (visible and SAR) with a high resolution is used in the test. There are very obviously significant non-linear radiometric differences between these images. A template window (68×68 pixels) is first selected from the visible image. Then, NCC, MTM, MI and HOPC are each calculated for x-direction translations (-10 to 10 pixels) within a search window of the SAR image.
Figure 8 Similarity curves of NCC, MTM, MI and HOPC. Figure 8 shows the similarity curves of NCC, MTM, MI and HOPC. NCC is expected to fail to detect the tie-point, and MTM and MI also have some location errors caused by the
significant radiometric differences. In contrast, HOPC not only correctly detects the tie-point, but also has the more distinguishable curve peak. This example is a preliminary indication that HOPC is more robust than the other similarity metrics to non-linear radiometric differences. More analysis on the performance of HOPCwill be given in Section 3
2.3 Fast calculation scheme for HOPC
During the template matching process, a template window moves pixel by pixel within a search region or an image. For each template window to be matched, it is obvious that the HOPC descriptor needs to be calculated. Since most of the pixels overlap between adjacent template windows, This requires a lot of extra computation. To address this issue, a fast matching scheme is designed for the HOPC descriptor.
To extract the HOPC descriptor, the template window is divided into overlapping block regions, and the descriptors of all the blocks are collected to form a final dense descriptor. Therefore, a block can be regarded as the fundamental element for the HOPC descriptor. In order to reduce the computation required for template matching, we define a block region as being centered by each pixel in a search region or an image, and extract the HOPC descriptor of each block (hereafter referred to as a block-HOPC descriptor). Each pixel will then have multi-dimensional vectors to form the 3D descriptors for the whole image, which is called the HOPC image. The block-HOPC descriptor is then collected at intervals of several pixels (such as a half block width) to generate the HOPC descriptor for the template window. The fast computing scheme is shown in Figure 9.
Figure 9. The fast computing scheme for the HOPC descriptor. (a) the image. (b) the block-HOPC image. (c) the block-HOPC descriptors at a certain interval. (d) the final HOPC descriptor. This scheme can eliminate much of repetitive computation for adjacent template windows. For example, assume that it spends T time extracting the HOPC descriptor for a template window with a size of nn pixels, where each block contains m m tasks: (1)extraction of the block-HOPC descriptors for all pixels in the search region; (2) collection of the block-HOPC descriptor at intervals of a half block width for all the template windows that are used for matching. The computational expense of the latter task can almost be ignored compared to that of the former task because it simply assembles the block-HOPC ISPRS Annals of the Photogrammetry, Remote Sensing and Spatial Information Sciences, Volume III-1, 2016
2
M T time, our scheme has a significant time advantage especially in a large template size. Figure 10 shows the run times of the two schemes with regard to increased template sizes, where 200 interest points are matched, the search region is 20× 20 pixels. It can be clearly observed that our scheme require less time than the traditional scheme, and this advantage becames more and more obvious when the template size increases.
Figure 10. The run time of the traditional match scheme and our scheme using HOPC with increased template sizes.
3. EXPERIMENT
In this section, the matching performance of HOPC is evaluated with different types of multi-modal remote sensing images, and HOPC is compared with the three state-of-the-art similarity metrics—NCC, MTM and MI. low-, medium-, and high-resolution images with resolutions from 0.5 to 30m, and cover different terrains including urban and suburban areas. All of these image pairs have been systematically corrected by their physical models, and also re-sampled in the same ground sample distance (GSD). Thus there are almost no obvious translation, rotation and scale differences between the reference and sensed images. However, significant radiometric differences are common between these images because they are acquired by different imaging modalities and from various spectra. The descriptions of the test data are listed in Table 1, and the characteristics of each set are described below.
Visible-to-Infrared: Test 1 and test 2 are the visible and infrared images, which are a pair of high resolution images and a pair of medium resolution images respectively. The high resolution image is located in the urban area, and have rich geometric structural features. In contrast, the medium resolution image covers suburban area with relatively poor geometric structural features. Moreover, the LiDAR intensity images have significant noise which increases the difficulty of matching. Test 5 includes a
pair of LiDAR depth and visible images, and vastly differences can be observed from the intensity characteristics of the two images, which make matching the two images quite challenging. Visible-to-SAR: Test 6 to test 8 are composed of the visible and SAR images. Test 6 is a pair of images located in a suburban area with a medium resolution, and has rich geometrical structural features. Test 7 and test 8 are high resolution images covering an urban area with high buildings, resulting in obvious local distortions. Additionally, there is a temporal difference of fourteen months between the images of test 8, so some ground objects have changed during this period. These differences in this test make it very difficult to match the two images.
Image-to-Map: Test 9 and test 10 are two pairs of visible and points between the two data.
Category Image pair Size and GSD Data
Test 2 TM band1(visible) TM band4(NIR) 800×800, 30m 800×800, 30m 2005/10 2005/10
Li
Test 4 LiDAR intensity WorldView2 visible 621×617, 2m 621×621, 2m 2010/10 2011/10
Test 5 LiDAR depth
Test 10 Google Maps Google Maps 621×614, 1.5m 621×614, 1.5m unknown
Table 1 Descriptions of the test data
3.2 Implementation details and evaluation criterion
The block-based Harris operator (Ye and Shan 2014) is first used to detect the 200 evenly-distributed interest points in the reference image. Then NCC, MTM, MI and HOPC are applied to detect tie-points within the search region with a fixed size (-10 to (-10 pixels) of the sensed image using a template matching strategy, followed by fitting the similarity curves with quadratic polynomial to determine the subpixel position (Ma et al. 2010). The parameters of HOPC are set to 8 orientation bins, 3×3 cell blocks of 4×4 pixel cells and a half block width overlap The correct match rate (CMR) is chosen as the evaluation criterion. Where CMRCM C/ , the correct match (CM) is the number of correctly matched point pairs in the matching results, and the correspondence (C) is the total number of match point pairs. The CM number is determined by the following strategy. For each image pair, 40-60 evenly distributed points were selected as the check points. A transformation model T is then computed using the check points. The T used for test 2 and test
6 is the projective transform since these images are medium resolution images covering suburban areas. For the other test
image pairs covering urban areas, the cubic polynomial is employed because it is usually more suitable than other global transformation models such as projective and second-order polynomial models for pre-fitting non-rigid deformations between images (Ye and Shan 2014). The point pair with localization error less than Thre is regarded as the correct match. The value of Thre is set to 1.0 pixel for the medium
resolution images that have few local distortions (test 2 and test 6). For the high resolution images, the value of Threis set to 1.5 pixels for more flexibility since their rigorous geometric transformation relationships are usually unknown and cubic polynomial models can only pre-fit the geometric distortions. 3.3 Matching performance
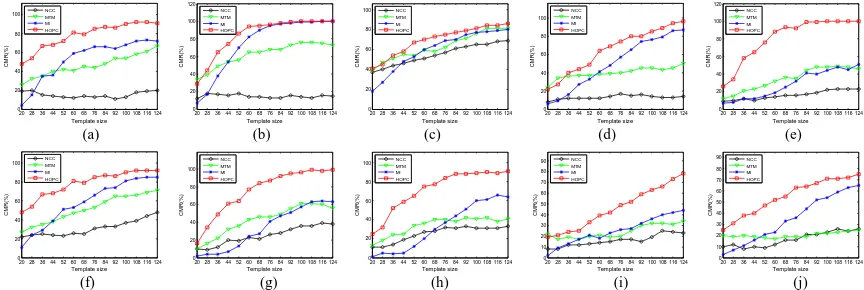
The matching performance of HOPC is evaluated by comparison with NCC, MTM and MI in terms of two aspects: the CMR value and the computational efficiency. In the matching process, template windows of different sizes (from 20×20 to 124×124 pixels) are used to detect tie-points to analyze the sensitivities of these similarity metrics with respect to changes in the template size.
3.3.1 Correct Match Ratio: Figure 11(a)-(b) show the CMRs between the visible and infrared images (test 1 and test 2). It can be seen that HOPC performs the best, followed by MI and MTM, while NCC achieves the lowest CMRs. This is because NCC is only invariant to linear radiometric differences and cannot handle complex radiometric changes between images. Additionally, the CMRs of HOPC are less affected by template sizes compared with MI, which is very sensitive to template size changes. The reason for this is that MI is required to compute the joint entropy between images, which is quite sensitive to the sample sizes (namely the template sizes)(Hel-Or et al, 2014). In addition, the HOPC's CMRs of test 2 decline slightly compared with test 1 in the same template sizes[Figure 11(b)]. This is because the images of this test contain relatively poor geometric structural information, resulting in that HOPC hardly extracts the distinguished structural features from a small template size. However, HOPC achieves the high CMRs in the larger template windows (more than 52×52 pixels).
Figure 11(c)-(e) show the CMRs between the LiDAR data and visible images (test 3-test 5). For test 3 and test 4, HOPC achieves relatively higher CMRs than the other similarity metrics despite significant radiometric differences and noise existing between the images. For test 5 where the LiDAR depth and visible images present very different intensity patterns, HOPC performs much better than the other similarity metrics
such as MI and MTM. As shown in Figure 11(e), the CMR of HOPC can reach almost 100%, while that of MTM and MI only achieve CMR of 50% in the large template sizes. This is largely attributed to the fact that the geometric structural characteristics are very similar (Figure 12(e)) despite the large radiometric differences between the images. Thus HOPC, representing the geometric structural similarity, has an obvious advantage over MTM and MI.
The CMRs between the visible and SAR images (test 6-test 8) are illustrated in Figure 11(f)-(h). HOPC achieves higher CMRs for al three tests. In addition, HOPC performs much better than the other similarity metrics such as MTM and MI, especially for test 7 and test 8 which consist of two pairs of high resolution rich geometric structures and contour information such as buildings and roads. This demonstrates that HOPC clearly outperforms the other similarity metrics for multi-modal images that include abundant structural features.
Test 9 and test 10 are two pairs of the visible images and the map data, where the map data have been rasterized. This is a challenging test because the two data hardly have any significant shared features apart from some similar boundaries of buildings and streets. Figure 12(i-j) shows the CMRs for the four similarity metrics. Similar to the previous tests, HOPC performs better than NCC, MTM and MI. The CMR of HOPC rises as the template size increases, and can respectively achieve the CMRs of 78% and 75% in the large template size such as 124×124 pixels, which is an acceptable CMR for multi-modal image matching.
Figure 12 shows the tie-points detected using HOPC with a template size of 100×100 pixels between the multi-modal images. In the enlarged subimages, it can be clearly observed that these tie-points are located in the correct positions precisely. It can be observed from the above experiments that HOPC outperforms almost all of the other similarity metrics in any template size for all the tests. MI achieves the second highest CMRs in most cases. Although the performance of MI is very sensitive to template sizes. In comparison, HOPC is more stable to changes in template sizes, can achieve a relatively considerable CMR even in a small template size.
20283644526068768492 100 108 116 124
Figure 12. The correct matching points of all the tests by HOPC in the template sizes of 100×100 pixels. (a) test 1. (b) test 2. (c) test 3. (d) test 4. (e) test 5. (f) test 6. (g) test 7. (h) test 8. (i) test 9. (j) test 10.
3.3.2 Computational Efficiency: As well as the CMR, the computational efficiency is another important indicator for evaluating the matching performance of similarity metrics. The experimental platform used is Inter Core i7-4710MQ 2.50GHz PC.
Figure 13 shows the run times of NCC, MTM, NCC and HOPC with increased template sizes. It can been seen that MTM spends the least time among these similarity metrics. This is because MTM is quickly calculated over the whole search region, avoiding to search correspondences pixel by pixel (Hel-Or et al. 2014). In contrast, MI is the most time-consuming because it needs to compute a joint histogram for every matched template window pair, which requires a certain amount of computation (Hel-Or et al. 2014). In addition, since HOPC needs to extract the HOPC descriptors and calculate the NCC between such descriptors, it takes more run time compared with MTM and NCC. However, the computational efficiency of HOPC is still better than that of MI within the range of template sizes (less than 124×124 pixels) used in our experiment. This is beneficial for practical application because the large template size increases the computation of image matching, and the CMRs of HOPC and MI do not usually increase substantially when the template size is more than a certain range such as 100
×100 pixels (Figure 12). In short, MI is most time-consuming, followed by HOPC, NCC and MTM
Figure 13. Run times of NCC, MTM, NCC and HOPC with increased template sizes
Based on the above experiments, it can be concluded that HOPC achieves the higher CMRs than the other similarity metrics, followed by MI, and is also less time-consuming than MI within a limited range of template sizes. Although HOPC requires more time than NCC and MTM, its CMR is much
(b) (a)
(c) (d)
(e) (f)
(g) (h)
(j)
(i) (j)
higher than these two similarity metrics that are both relatively vulnerable to non-linear radiometric differences. Therefore, taking the CMR and computational efficiency into consideration, HOPC is a more distinguished similarity metric for multi-modal image matching.
4. CONCLUSION
In this paper, a novel similarity metric (named HOPC) for multi-modal remote sensing image matching is proposed to address the issue of significant non-linear radiometric differences. First, the phase congruency model is extended to build its orientation representation. Then, the magnitude and orientation of phase congruency are used to construct HOPC, followed by a fast template matching scheme designed for this metric. HOPC aims to capture the geometric structural similarity between images, which can effectively handle complex radiometric variation. Thus this metric can robustly find tie-points in different modalities. HOPC has been evaluated against ten pairs of multi-modal images, and compared to the state-of-the-art similarity metrics such as NCC, MTM, and MI. The experimental results demonstrate that HOPC outperforms the other similarity metrics, especially for the image pairs containing rich geometric structure features. Moreover by designing a fast matching scheme, HOPC have a lower run time than MI that achieves the second highest correct match rate in most experiments. However, HOPC is still more time-consuming compared with NCC and MTM. The main reason is that HOPC requires a high-dimensional geometric structural feature descriptor to be calculated. In subsequent works, this issue will be resolved by reducing the dimensions of the descriptor using a dimension-reduction technique such as PCA. In addition, it is worth noting that the performance of HOPC may decline if the images include few structure or shape information because HOPC depends on geometric structural properties, In this case, an image enhancement approach can be applied to enhance shape or edge features, which may be helpful for image matching, A more thorough evaluation will be addressed in future using more multi-modal remote sensing images.
ACKNOWLEDGEMENTS
This paper is supported by the National Basic Research Program(973 program) of China (No. 2012CB719901), the National Natural Science Foundation of China (No.41401369 and No.41401374). The authors would like to thank Dr. Kovesi for the public MATLAB code of implementing phase congruency (Kovesi 2000).
REFERENCES
Cole-Rhodes, A. A., Johnson, K. L., LeMoigne, J., et al, 2003. Multiresolution registration of remote sensing imagery by optimization of mutual information using a stochastic gradient. IEEE Transactions on Image Processing, 12(12), pp. 1495-1511.
Dalal,N and Triggs B., 2005. Histograms of oriented gradients for human detection. Proc. IEEE Conf. Computer Vision and Pattern Recognition 2005, pp. 886-893
Gonçalves, H., Gonçalves, J. and Corte-Real, L., 2011. "HAIRIS: A method for automatic image registration through histogram-based image segmentation. Image Processing, IEEE Transactions on, 20(3), pp. 776-789.
Goncalves, H., Goncalves J. A. Corte-Real L., et al, 2012. CHAIR: automatic image registration based on correlation and Hough transform. International Journal of Remote Sensing, 33(24), pp. 7936-7968.
Han, Y., Choi, J., Byun, Y., et al, 2014. Parameter optimization for the extraction of matching points between high-resolution multisensor images in urban areas. Geoscience and Remote Sensing, IEEE Transactions on 52(9), pp. 5612-5621.
Hel-Or, Y., Hel-Or H., and David, E., 2014. Matching by tone mapping: photometric invariant template matching. Pattern Analysis and Machine Intelligence, IEEE Transactions on, 36(2), pp. 317-330.
Kovesi, P., 1999. Image features from phase congruency. Videre: Journal of Computer Vision Research, 1(3), pp. 1-26. Kovesi, P., 2000. MATLAB and Octave functions for computer vision and image processing,” Online: http://www.peterkovesi.com/matlabfns/.
Moreno, P., Bernardino, A. and Santos-Victor J., 2009. Improving the SIFT descriptor with smooth derivative filters. Pattern Recognition Letters 30(1), pp. 18-26
Ma, J. L., Chan, J. C. W. and Canters, F., 2010. Fully automatic subpixel image registration of multiangle CHRIS/Proba data. IEEE Transactions on Geoscience and Remote Sensing, 48(7), pp. 2829-2839.
Oppenheim, A. V. and Lim J. S., 1981. The importance of phase in signals. Proceedings of the IEEE, 69(5), pp. 529-541. Sedaghat, A. and Ebadi, H., 2015. Remote Sensing Image Matching Based on Adaptive Binning SIFT Descriptor. IEEE Transactions on Geoscience and Remote Sensing, 53(10), pp. 5283-5293
Sun, Y., Zhao, L., Huang, S., et al, 2015. Line matching based on planar homography for stereo aerial images. ISPRS Journal of Photogrammetry and Remote Sensing, 104(2015), pp. 1-17. Suri, S. and Reinartz, P., 2010. Mutual-information-based registration of TerraSAR-X and ikonos imagery in urban areas. IEEE Transactions on Geoscience and Remote Sensing, 48(2), pp. 939-949.
Ye, Y. and Shan J., 2014. A local descriptor based registration method for multispectral remote sensing images with non-linear intensity differences. ISPRS Journal of Photogrammetry and Remote Sensing, 90(2014), pp. 83-95.
Zitova, B. and Flusser J., 2003. Image registration methods: a survey. Image and Vision Computing, 21(11), pp. 977-1000