Framework 1994–99 on the Greek Economy
Nicos M. Christodoulakis, Athens University of Economics and Business, and CEPR
Sarantis Kalyvitis,Athens University of Economics and Business
The purpose of this paper in to provide anex anteassessment of the effects that the second Community Support Framework (CSF) is likely to have on the economy of Greece in the short and medium run by employing the projections of a four-sector annual macroeco-nometric model. The model is simulated under alternative assumptions accordingly to whether the effects are stemming from the demand side of the economy or incorporate the supply-side externalities that show the improvement of factor productivity by CSF actions. In the absence of externalities, output rises during the period of the CSF 1994–99, but then returns to the benchmark course without any lasting improvement. When external-ities are taken into account, total output in year 2010 will be higher than baseline by an impressive 9.5 percent, and will continue to grow at a rate faster by 0.26 percent per annum than would be otherwise. Over the period of simulation the output growth rate averages above the benchmark rate by 0.55 percent per annum, and employment expands by an average of 95,000 new jobs. This finding has serious implications for the alloca-tion, implementaalloca-tion, and monitoring of the Plan, because it calls for actions that ensure the maximum possible efficiency if a lasting improvement is to occur in the economy.
2000 Society for Policy Modeling. Published by Elsevier Science Inc.
Address correspondence to Professor Nicos Christodoulakis, Athens University of Eco-nomics and Business, Department of International and European Economic Studies, Patis-sion Str. 76, Athens 104 34, Greece.
Financial support by Contract JOU2-CT92-0257 of European Commission DG XII is gratefully acknowledged. The authors benefited from useful comments and discussions with project partners J. Bradley, J. Herce, L. Modesto, and S. Sosvilla-Rivero. They are also thankful to seminar participants in the University of York, Canada, and the Center of Economic Planning and Research, Athens, for interesting discussions on integration issues. The usual proviso applies.
Received March 1997; final draft accepted December 1997.
Journal of Policy Modeling22(5):611–624 (2000)
1. INTRODUCTION
The purpose of this paper is to provide an ex anteassessment of the effects that the second Community Support Framework (CSF) is likely to have on the economy of Greece in the short and medium run. The Greek CSF is designed to finance large scale development projects and investment in physical and human capital, aiming to gear the economy of Greece onto a sustainable path of economic growth and development. As for the other main recipient countries of European Union (Ireland, Portugal, and Spain), such an intervention has been deemed necessary to assist the less-developed members of the Union to modernize their economies, foster growth, and therefore, approach the welfare and efficiency of the most developed members of the Union. This process of real convergence is viewed as a prerequisite for the cohesion of EU and the sustainability of thenominalconvergence objective of the Maastricht Treaty in the way to Economic and Monetary Union (EMU) of Europe. The second CSF will be operational during 1994–99, and is going to be substantially more extensive in actions and far-reaching in impact than the first CSF implemented in 1989–93.
of economic activity are going to be substantial. Their assessment requires a careful quantification of the outcome it is likely to have on the industry-wide and macroeconomic level, taking into account both the demand and supply side effects.
A useful tool for such an analysis can be an estimated macroeco-nomic model that portrays the basic structure and interrelation-ships, and generates forecasts of the alternative course that the economy may take with and without such a type of interventions. Although macroeconomic models are frequently criticized for re-flecting the structure of the past and, therefore, are unable to capture possible breakthroughs in the future, they still provide a consistent and quantitative framework for analyzing plausible developments. Using a four-sector estimated model for the Greek economy, the present study attempts to assess the impact of CSF actions on the macroeconomy by constructing projections of main economic variables under the assumption of full utilization of the funds and then compare the outcome with the benchmark case of no intervention.1
The structure of the paper is the following: The modeling of CSF is described in Section 3. In Section 4, the model is simulated under alternative assumptions accordingly to whether the effects are stemming from the demand side of the economy or incorporate the supply response as well. After the analysis of results, conclu-sions and directions of future research are discussed in Section 5.
2. MACROECONOMIC ANALYSIS OF CSF
2A. Accounting for CSF
Each flow of CSF is characterized by two attributes: (1) the proportion, which is expected to be implemented in periodt, and, (2) the ratios of financial contribution from European Union, National Authorities, and the private sector. An amount of S Mecu that is allocated to a specific sector for the whole period will generate the following annual flow Ft in constant 1970 Drachma billion:
Ft5S*T*t(Xt/Pt)*(a1b1g). (1)
In Equation 1, Ttis the proportion to be allocated in periodt,
X is the prevailing nominal exchange rate in Drs/Ecu, P is the
1For a detailed presentation of the econometric specification of the model, the projection
Table 1: Intertemporal Absorption Ratios of CSF
1994 1995 1996 1997 1998 1999 2000 Sum
T 0.05 0.13 0.16 0.18 0.18 0.18 0.12 1.00
Notes: Figures are based on preliminary estimates of the CSF absorption rates.
GDP deflator normalized to have P(1970) 5 1, anda, b, andg
denote the cofinancing ratios of EU, Government, and private sectors, respectively, witha 1 b 1 g 51. For an analytical descrip-tion of the various cofinancing ratios that are calculated on the basis of the relative amounts by type of intervention, see Christo-doulakis and Kalyvitis (1995).
The time schedule depends crucially on the readiness of the economy to absorb the flows from the Union, and also on the availability of domestic financial resources. Both are expected to improve over time, and for this reason factorFtincreases during 1994–99. As has happened in the first CSF program, several proj-ects are completed with some delay, and final payments come after the planned horizon. To capture this predictable delay, the time factor is extended to year 2000 and the intertemporal alloca-tion is assumed to be as in Table 1.
Each flow is modeled in such a way as to reflect both the increase in the benchmark level of relevant investment and the consequential burden for the public and private sector. The equa-tions of the model that are modified to account for the CSF flows are listed below (Equations 2–12). The expression that appears in the rhs of each equation with the suffixbasedenotes the function of explanatory variables or the exogenous values that have been used in the benchmark forecasting. The notation of CSF flows uses the prefixF and the name of the corresponding variable.
Investment in agriculture:
QIA5QIAbase1FQIA, (2)
Investment in the traded sector:
QITR5QITRbase1FQITR, (3)
Investment in the non-traded sector:
QINT5QINTbase1FQIH1FQIS. (4)
Public investment:
QIG5QIGbase1(a1b)*FQIH1(a1b)*FQIS1 b*FQIA1 b*FQITR.
(5)
This equation assumes that the infrastructure investment will be of public property, regardless of whether it has been financed by community or national government funds. Public investment also includes the cofinancing of investment in agriculture and industry. Variable QIG is then used in the model to determine the accumu-lation of the new public capital stock.
Public deficit:
DEF5DEFbase1 b*FQIH1 b*FQIS1 b*FHUM1 b*FQIA1 b*FQITR.
(6)
Public deficit DEF increases by the amount of public cofinancing of all sorts of investment and also by the public contribution to the human capital training (note that the sums appearing in the deficit equation are different from those entering the public invest-ment flow).
Private investment:
QIP5QIA1QITR1QINT1QIPS2QIG. (7)
This equation determines the privately owned investment flows by subtracting from all sorts of investment those of the public sector. Variable QIP is then used in the model to determine the evolution of total private capital stock that enters in the definition of public sector wealth in the consumption function (see Christo-doulakis and Kalyvitis, 1994).
Private sector financial wealth:
DQFWP5(interest)1(savings)2 g*FQIA2 g*FQITR, (8)
QIP2QIPbase5(a 1 g)*FQIA1(a 1 g)*FQITR1 g*FQIH1 g*FQIS,
(9)
The disposable income that enters the consumption function is augmented by the amount FHUM spent on training either in the form of remuneration to trainees or a fee to the trainers.
Disposable income:
YDIS5YDISbase1FHUM. (10)
Additionally, to the above equations, we introduce two accumu-lation equations for the hard and soft infrastructure to assess the improvement of the capital stocks relative to the benchmark forecasting. Using the simple neoclassical accumulation process, we have:
QKH5(1-d)*QKH211QKIHbase1FQIH (11)
QKS5(1-d)*QKS211QKISbase1FQIS (12)
where QKH and QKS are the stocks for hard and soft infrastructure, respectively, anddis the depreciation rate.
2B. Modeling CSF Externalities
CSF actions are going to influence the economy through a multi-tude of supply-and-demand effects. Demand effects are captured by the appropriate rise in the components of domestic expenditure or personal income, as has been described in the previous subsec-tion. The supply side effects will come by the rise in sectoral productivity due to the improved infrastructure, the reduction of cost due to the better training of the labor force, and the increase in fixed capital formation in the productive sectors as community and public aid will induce private investment.
rate of output. His findings prompted further research on the U.S. economy and other countries.2
The role of public infrastructure is also examined in the context of endogenous growth models. For example, Barro (1990) consid-ers the flow of government expenditure on social infrastructure as a factor of production, and finds that the steady state growth rate in the economy increases with the national income share of investment in infrastructure. Aschauer (1993) developed an endogenous growth model with the stock of public capital as a production factor, and employs it to explain regional differences in the growth rates.
For the Greek economy, it has been shown that public infra-structure has a positive and strong impact on the productivity of large-scale manufacturing, and established3that public
infrastruc-ture can be treated as a factor of production (Christodoulakis and Kalyvitis, 1996). Using a cyclically adjusted capital stock to account for the changes of utilization over the business cycle, the long-run elasticity of output in the manufacturing sector with respect to public infrastructure was found to be 0.60. Similar results were found by estimating a translog production function for the same sector of large-scale manufacturing (Christodoulakis and Segoura, 1996).
Having established the positive impact of infrastucture on out-put, the next step is to calibrate some new parameters in the estimated model to study the economy-wide effects. In an econo-metric model, such as the one employed in this paper, the effect of infrastructure and human capital improvement can be analyzed by introducing a number of externalities in the estimated equations for output and production costs (Equations 13–21). Externalities are modeled in a way similar to that suggested by Bradley et al. (1995) for the Irish and Portuguese economies, so that results are directly comparable between various CSF recipient countries.
2Employing a Cobb–Douglas production function, Aschauer (1989b) had established
that the decline in U.S. productivity growth int he 1980s is associated with the neglect for public infrastructure over the same period. Similar results have been obtained by Garcia– Mila and McGuire (1992) and Costa de Silva, Ellson, and Martin (1987) for U.S. Bajo–Rubio and Sosvilla–Rivero (1993) for Spain, and Ford and Poret (1991) for the major OECD economies.
3Taking into account the criticism by Tatom (1991) against the aforementioned
Externality elasticities arecalibratedin such a way as to take into account the elasticities that have beenestimatedat the large-scale industry level. The supply side effects for the various types of CSF actions is described as follows.
Hard infrastructure:output in each of the four sectors is given by a production function of the form
Ys5Asfs(Ks,Ls,t), (13)
where suffixs (s 5 T,N,G,A) stands for the traded, non-traded, public, and agricultural sector respectively, Ks and Ls are the sectoral capital and labor inputs,tis technological progress,Asis a scale parameter. The bar indicates the estimated value used in the nonexternalities simulations. The infrastructure externality is modeled by endogenising the latter as:
As5As(QKH/QKH)h(s), (14)
where QKH is the accumulated stock of hard infrastructure, the bar indicates the stock in the no-externality case, andh(s) denotes the externality elasticity for each sector with respect to QKH. In logarithmic terms, the affected equations are written as follows:
LnYs5LnYs(.)base1 h(s)Ln(11 DQKH/QKH), (15)
whereY(.)basedenotes the function used in the non-CSF
simula-tions. Externality effects are assumed to vary across sectors. The traded sector is assumed to be the readiest to incorporate the improvement of hard infrastructure into production, by means of energy savings, better transport, communication, etc. The non-traded and public sectors also benefit from hard infrastructure, but to a lesser extent, reflecting the lower capital intensity. The agricultural sector is assumed to benefit the least, given its slow adaptation to new technologies. Parameter values were chosen to be 5 percent for the traded sector, 2.5 percent for the non-traded and public sectors, and 1 percent for agriculture. The capital stock of hard infrastructure accumulates according to the process de-scribed by Equation 11.
QULC5QULC(.)base(QKS/QKS)s(c), (16)
where QULC is real ULC, QKS is the capital stock of soft infra-structure, andscis the elasticity with respect to changes in QKS. QULCbase denotes the function of unit labor cost used in the
nonexternalities case and QKS denotes the capital stock without the CSF intervention. Elasticitys(c) is set equal to 22 percent.
To a considerable extent, actions of soft infrastructure involve the public sector. Thus, it is reasonable to assume that public employment will increase above the level assumed in the bench-mark scenario, as follows:
LPS5LPS(.)base(QKS/QKS)s(e). (17)
In the above expression, LPS is public sector employment, and
sE is the elasticity to changes in QKS. The increase in public employment will automatically raise public sector activity; thus, there is no need to add another elasticity for output. The elasticity
s(e) is set equal to 10 percent. The capital stock of soft infrastruc-ture accumulates according to the process described by Equa-tion 12.
Productive Investment: investment aid to manufacturing and agricultural sectors affect explicitly the capital stock and output in those sectors. Hence, there is no need to consider further supply side effects stemming from such actions.
Education and Training: The effect of human resources fund that is used for training activities is measured by the extent it raises the employment of skilled workers. To assess the number of skilled workers that will be added to the labor force we employ a calculation similar to that of Bradley et al. (1995). Each trainee is assumed to receive a fraction m of the wage rate in the non-traded sector (WNT), while instructors are remunerated the full rate, and each of them trains a group of M people. The annual bill is given by:
FHUM*P5NHUM*(m*WNT)1(NHUM/M)*WNT, (18)
where FHUM is the annual CSF intervention for training (ex-pressed in constant 1970 prices), P is the GDP deflator and NHUM is the number of trained workers per year. Inverting Equation 18 we obtain:
NHUM5FHUM*P/(m 11/M)*WNT. (19)
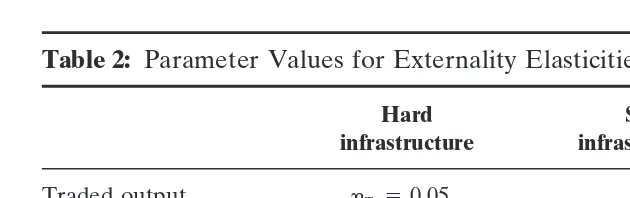
Table 2: Parameter Values for Externality Elasticities
Hard Soft Human
infrastructure infrastructure resources
Traded output hT 50.05
Non-traded output hN50.025
Public output hG50.025
Public employment s(e)50.10
Agricultural output hA50.01
Real unit labor cost s(c)5 20.02 u 5 20.03
Notes: hT,hNT,hG, andhAdenote the elasticities of the tradable, non-tradable, public,
and agricultural sector, respectively.
QHUM5(12 e)*QHUM211NHUM, (20a)
where e is a depreciation rate set equal to 5 percent annum. A data series for QHUM in the non-CSF simulations has been constructed by assuming that only half of existing employment is composed of skilled workers, that is:
QHUMbase5 j*(LA1LTR1LNT1LPS), (20b)
wherej is set equal to 0.50. The expected effect of the increase in skilled human resources is the improvement of labor productiv-ity. To model this externality, we assume that unit labor cost in real terms changes in a way similar to that for the soft infrastructure interventions:
QULC5QULC(.)base(QHUM/QHUM)u, (21)
whereuis the elasticity with respect to QHUM, and other defini-tions are similar to those in Equation 16. The parameter value was set equal to 23 percent. The externality elasticities to the various types of CSF intervention are summarized in Table 2.
3. ASSESSING THE MACROECONOMIC IMPACT OF CSF II
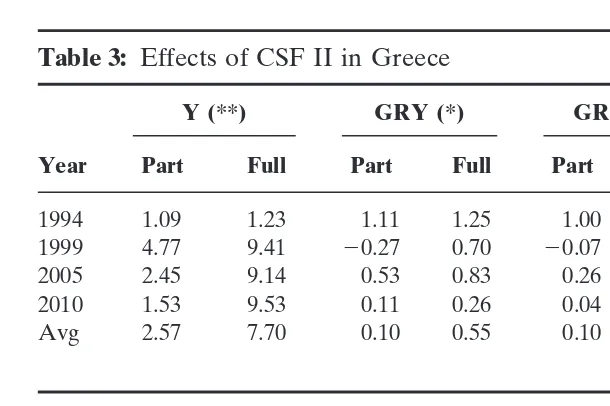
Table 3: Effects of CSF II in Greece
Y (**) GRY (*) GRPL (*) L (*)
Year Part Full Part Full Part Full Part Full
1994 1.09 1.23 1.11 1.25 1.00 1.02 4.00 8.2
1999 4.77 9.41 20.27 0.70 20.07 0.44 67.0 161.3
2005 2.45 9.14 0.53 0.83 0.26 0.68 23.7 100.8
2010 1.53 9.53 0.11 0.26 0.04 0.31 26.60 55.2
Avg 2.57 7.70 0.10 0.55 0.10 0.47 25.6 95.2
DY (*) LFNA (*) UUR (*) INFY (*)
Year Part Full Part Full Part Full Part Full
1994 0.37 0.38 1.91 2.20 20.07 20.19 20.82 20.96
1999 0.02 1.09 10.38 30.8 21.65 23.78 2.74 0.74
2005 1.11 1.04 6.06 62.0 20.49 21.03 21.06 23.00 2010 20.36 20.26 5.76 86.3 0.33 0.88 20.36 22.60 Avg 0.10 0.45 6.20 44.9 20.57 21.44 0.48 21.18
Notes: The column ‘‘part’’ displays simulation results without any externality effect, and column ‘‘full’’ the reslts with externalities taken into account.
An asterisk indicates difference from baseline, two proportional change. Y is output at factor cost, GRY the growth rate of output, GRPL the growth rate in labor productivity, L total employment in thousands, DY primary deficit as a percentage of GDP, LFNA is nonagricultural labor supply in thousands, UUR is the rate of urban unemployment, and INFY the inflation rate of GDP deflator.
“full” impact of CSF stemming from both the demand side and the externality effects.4The results are displayed in Table 3.
The overall CSF will affect the economy through the cumulative impact of the separate actions.5 In the absence of externalities,
output will rise by roughly 4.0 percent during the period of CSF
4It should be noted that besides the distinction between demand and supply-side effects,
another crucial assumption is made about the course of stabilization policy. As discussed in subsection 24, we assume that during the implementation of CSF the Convergence Plan continues unabated and achieves the same debt-to-output targets as projected in the benchmark scenario. This is ensured by employing a simple fiscal rule, according to which the direct tax rate is risen until a specified debt target is met in each period. Under this assumption, no change will occur in the debt burden or the gross public deficit as a consequence of CSF actions. The changes will appear now in the primary deficit that is upwards influenced by the cofinancing obligations of CSF and downwards by the increased revenues generated by the higher tax base.
actions, but then will improve by only 1.5 percent of benchmark levels, mainly due to the impact of productive investment. Growth rates of output and productivity will be returning to the base levels. The wage increases associated with the boom will have raised the participation rate, and at the same time some jobs will be gained. Unemployment rate may slightly rise after a period of containment in the years of CSF.
When all types of externalities are taken into account, total output in year 2010 will be higher than baseline by an impressive 9.5 percent and—more importantly—will continue to grow at a rate faster by 0.26 percent per annum. Over the period of simula-tion the output growth rate averages above baseline rate by 0.55 percent per annum. During 1994–99 the growth rate rises by around 1.2 percent higher than the rate projected by the official CSF Plan for the same period. Employment expands by an average of 95,000 new jobs, which is close to the figure officially expected.
4. CONCLUSIONS
Based on an estimated model of the Greek economy, the paper investigated the impact that interventions of the Community Sup-port Framework 1994–99 is likely to have on the economy of Greece. CSF actions were grouped according to whether they aim to (1) raise “hard” infrastructure, (2) finance “soft” infrastructure interventions, (3) support productive investment, and, (4) train the labor force into new skills and improve the civil service. The effects were analyzed first, assuming that CSF operates only through raising the components of income and aggregate demand, and then by incorporating externalities on the productivity of output in various sectors and the reduction in costs.
A similar picture emerges as a possible outcome for the second CSF if the effects are left to operate only through the demand side. However, if externalities are assumed to operate even at a moderate scale, the picture changes starkly. Total output will be rising for a long period of time, and 10 years after the end of CSF will still be 9.5 percent higher than baseline. The economy will still be growing at a rate faster by 0.26 per annum, after having achieved an incremental increase of 0.55 percent per annum in average for a period of 15 years. Productivity, employment, and the exporting capacity of the country will improve accordingly. This finding has far-reaching implications for the allocation, imple-mentation, and monitoring of the Plan, because it calls for actions that ensure the maximum possible efficiency if a lasting improve-ment is to occur in the economy. National and EU authorities should make sure that the following conditions are satisfied to achieve the effect of externalities envisaged in theex anteanalysis of CSF: (a) design, construction and operation of hard infrastruc-ture projects after a careful examination of the benefits that are going to accrue to the various sectors of economic activity. The hard infrastructure actions of the regional programs should be implemented in conjunction of the national-scale ones so that supplementarity rather than repetition is achieved. (b) The imple-mentation of soft infrastructure actions should take into account the demand that is likely to develop for such services (e.g., R&D, culture, health, etc). The concentration on top-down activities that cannot attract substantial demand from the production and service sector should be avoided. (c) Training and education should be geared to providing skills in current and future demand by the eco-nomic activities, so that their effect is felt on improving the produc-tivity of the human factor. (d) The implementation of the program should ensure that all envisaged cofinancing by the private sector is realized, so that the maximum impact on investment and infra-structure utilization is achieved.
a more precise evaluation of the externalities effects can be ob-tained.
REFERENCES
Alogoskoufis, G. (1995) The Two Faces of Janus: Institutions, Policy Regimes and Macro-economic Performance in Greece.Economic PolicyApril: 149–192.
Aschauer, D.A. (1989a) Public Investment and Productivity Growth in the Group of Seven:Economic Perspectives13:17–25.
Aschauer, D.A. (1989b) Is Public Expenditure Productive?Journal of Monetary Economics 23:177–200.
Aschauer, D.A. (1993) Public Capital, Productivity and Economic Growth, presented in the Int. Workshop on Infrastructure, Economic Growth and Regional Development, Jonkoping, Sweden, June 10–12.
Bajo-Rubio, O., and Sosvilla-Rivero, S. (1993) Does Public Capital Affect Private Sector Performance? An Analysis of the Spanish Case 1964–1988:Economic Modelling 10:179–185.
Barro, R. (1990) Government Spending in a Simple Model of Endogenous Growth:Journal of Political Economy98:103–125.
Bradley, J., Herce, J., and Modesto, L. (1995) The Macroeconomic Effects of the CSF 1994–99 in the EU Periphery: An Analysis Based on the HERMIN Model:Economic Modelling 12:323–333.
Christodoulakis, N., and Kalyvitis, S. (1994) A Four-Sector Macroeconometric Model for Greece’. AUEB Discussion Paper No. 94–13.
Christodoulakis, N., and Kalyvitis, S. (1995) Likely Effects of CSF 1994–99 on the Greek Economy: An Ex-Ante Assessment Using an Annual Four Sector Macroeconome-tric Model: KEPE Discussion Paper No. 46.
Christodoulakis, N., and Kalyvitis, S. (1996)The Effects of Structural Funds in Developing Economies: The Case of Greece. Athens.
Christodoulakis, N., and Segoura, I. (1996)Public Infrastructure and Private Productivity: An Empirical Investigation in Greek Manufacturing. Athens:Institute of Economic and Industrial Research.
Costa da Silva, J., Ellson, R., and Martin, R. (1987) Public Capital, Regional Output and Development: Some Empirical Evidence.Journal of Regional Science27:419–437. Ford, R., and Poret, P. (1991) Infrastructure and Private Sector Productivity:OECD
Economic Studies17:63–89.
Garcia-Mila, T., and McGuire, T.J. (1992) The Contribution of Publicly Provided Inputs to States’ Economies.Regional Science and Urban Economics22:229–241. Ministry of National Economy. (1994) CSF: A Synopsis of Development Axes for Greece
(in Greek).
Ratner, J. (1983) Government Capital and the Production Function for US Private Output: Economic Letters13:213–217.