Buletin Statistik Bulanan
Monthly Statistical Bulletin
Economic Indicators
INDIKATOR
EKONOMI
BADAN PUSAT STATISTIK
BPS-
Statistics Indonesia
BADAN PUSAT STATISTIK
Statistics Indonesia
Indeks Harga /
Price Indices
Keuangan / Finance
Perbankan / Banking
Penanaman Modal / Investment
Produksi /
Production
Neraca Pembayaran dan Perdagangan Luar Negeri /
Balance of Payments and International Trade
Perhubungan /
Transportation
Hotel dan Pariwisata / Hotel and Tourism
Pendapatan Nasional /
National Income
2016
November
November
November
November
2016
November /
November
2016
INDIKATOR
EKONOMI
Jl. dr. Sutomo No. 6-8 Jakarta 10710
Telp.: (021) 3841195, 3842508, 3810291-4, Fax.: (021) 3857046 Homepage: http://www.bps.go.id E-mail: [email protected]
Katalog/Catalog: 9201001
Economics Indicators Bulletins is a publication of BPS-Statistics Indonesia which
is published monthly. The first publication was established on January 1970 with
simple contains. In line with the current condition and data needed, this
publication was containing more various and actual data appropriate with the
demand.
Especially, this publication provide statistical that describe Indonesia Economic
Indicators. Economic aspect that is provide are; consumer price indices,
wholesale price indices, currency exchange, finances and banking, capital
investment, balance of payments, national income, export and import,
transportation, hotel and tourism, agriculture production and mineral production.
Indikator Ekonomi merupakan publikasi BPS yang diterbitkan setiap bulan.
Publikasi ini pertama kali terbit pada bulan Januari 1970 dengan isi yang masih
sederhana. Secara bertahap, seiring perkembangan keadaan dan kebutuhan,
publikasi ini menyajikan data yang semakin beragam untuk memenuhi tuntutan
yang ada.
Publikasi ini secara khusus menyajikan statistik yang merupakan indikator
ekonomi Indonesia. Aspek ekonomi yang disajikan antara lain: indeks harga
konsumen, indeks harga perdagangan besar, nilai tukar valuta, keuangan dan
perbankan, penanaman modal, neraca pembayaran, pendapatan nasional,
ekspor dan impor, perhubungan, perhotelan dan pariwisata, produksi pertanian,
serta produksi bahan tambang.
9 7 7 0 1 2 6 2 3 1 0 0 8
ISSN 0126-2319
h
tt
p
:/
/ w
w
w
. b
p
s.
g
o
Buletin Statistik Bulanan
Monthly Statistical Bulletin
Economic Indicators
INDIKATOR
EKONOMI
Indeks Harga /
Price Indices
Keuangan / Finance
Perbankan / Banking
Penanaman Modal / Investment
Produksi /
Production
Neraca Pembayaran dan Perdagangan Luar Negeri /
Balance of Payments and International Trade
Perhubungan /
Transportation
Hotel dan Pariwisata / Hotel and Tourism
Pendapatan Nasional /
National Income
2016
November
November
Januari /
January
2016
h
tt
p
:/
/ w
w
w
. b
p
s.
g
o
Buletin Statistik Bulanan
INDIKATOR EKONOMI
NOVEMBER 2016
Monthly Statistical Buletin
Economics Indikator
November 2016
ISSN.0126-2319
No. Publikasi
/
Publication Number
: 07330.1701
Katalog
/
Catalog
: 9201001
Ukuran Buku
/
Book Size
: 29 x 21 cm
Jumlah Halaman
/
Total Pages
:
xviii +
1
88
halaman /
pages
Naskah
/
Manuscript
:
Badan Pusat Statistik
BPS–Statistic
s
Indonesia
Penyunting
/
Editor
:
Subdirektorat Indikator Statistik
Subdirectorate of Statistics Indicator
Gambar Kulit
/
Cover Design
:
Subdirektorat Publikasi Statistik
Subdirectorate of Statistical Publication
Diterbitkan oleh
/
Published by
:
©
Badan Pusat Statistik
©
BPS–Statistic
s
Indonesia
Dicetak oleh
/
Printed by
:
Badan Pusat Statistik /
BPS-
Statistic
s
Indonesia
Dilarang mengumumkan, mengomunikasikan, dan/atau menggandakan sebagian atau seluruh isi buku ini untuk tujuan
komersial tanpa izin tertulis dari Badan Pusat Statistik
Prohibitted to announce, distribute, communicate, and/or copy part or all of this book for commercial purposes without permission
from
BPS-
Statistics Indonesia
h
tt
p
:/
/ w
w
w
. b
p
s.
g
o
KATA PENGANTAR
Publikasi INDIKATOR EKONOMI merupakan publikasi bulanan Badan Pusat Statistik (BPS) yang terbit sejak bulan Januari 1970, yang terus mengalami
penyempurnaan secara bertahap. Publikasi ini berisi tabel-tabel yang memuat statistik ekonomi yang dibutuhkan para pemakai data untuk berbagai keperluan pengamatan
dan analisa ekonomi.
Data statistik yang disajikan dalam INDIKATOR EKONOMI dihimpun dan disiapkan oleh unit kerja-unit kerja yang ada di BPS, namun beberapa statistik diperoleh
dari instansi lain, seperti Bank Indonesia, Badan Koordinasi Penanaman Modal (BKPM), dan lain-lain.
Setelah mulai edisi Maret 1993, INDIKATOR EKONOMI dilengkapi dengan ulasan singkat tentang beberapa indikator ekonomi yang dianggap cukup menonjol,
maka mulai edisi Januari 2006, ulasan singkat sudah mencakup hampir seluruh sub bab yang ada.
Akhirnya, penghargaan dan ucapan terima kasih disampaikan kepada semua pihak yang telah memungkinkan tersusunnya publikasi INDIKATOR EKONOMI.
Kepada para pemakai publikasi ini diharapkan kritik dan saran yang bersifat konstruktif untuk penyempurnaan publikasi INDIKATOR EKONOMI, agar lebih
memudahkan para pemakai data untuk memperoleh gambaran umum mengenai perkembangan ekonomi Indonesia.
KEPALA BADAN PUSAT STATISTIK
h
tt
p
:/
/ w
w
w
. b
p
s.
g
o
P R E F A C E
ECONOMIC INDICATORS is a monthly publication issued by BPS – Statistics Indonesia since 1970, which has undergone gradual improvement. This publication
contains statistical economic data in the form of tables needed for economic observations and analyses.
ECONOMIC INDICATORS presents the statistical economic data collected and prepared by several divisions at BPS and other institutions such as Bank
Indonesia and the Capital Investment Coordinating Board (BKPM).
Since the March 1993 edition, ECONOMIC INDICATORS has been completed with highlights for several important indicators. And then, starting with the January
2006 edition, the highlights have covered almost all indicators presented.
Finally, appreciation and thanks are conveyed to all parties involved in preparing this publication.
Constructive critiques and suggestions are welcomed to improve this publication, in order for users to be able to get a general picture of the development of the
Indonesian economy easily.
BPS – Statistics Indonesia
Chief Statistician
h
tt
p
:/
/ w
w
w
. b
p
s.
g
o
DAFTAR ISI
1.1
Indeks Harga Konsumen Gabungan 82 Kota di Indonesia
(2012 = 100 ) ... 4
1.2
Indeks Harga Konsumen Gabungan 82 Kota di Indonesia dan
Perubahannya (2012 = 100) ... 5 - 6
1.3
Laju Inflasi 82 Kota di Indonesia (2012 = 100) ... 7 - 10
1.4
Indeks Harga Konsumen di 82 Kota di Indonesia dan
Perubahannya (2012 = 100) ... 11 - 27
1.5.1 Rata-rata Harga Produsen Gabah Menurut Kualitas dan Observasi
Transaksi Tingkat Penggilingan di Indonesia ... 28
1.5.2 Indeks Harga Produsen dan Inflasi Harga Produsen Triwulanan
(2010=100) ... 29 - 32
1.6
Upah Nominal dan Riil Buruh Tani, Konstruksi, Potong Rambut Wanita
dan Pembantu Rumah Tangga di Indonesia, (Rupiah) (2007 =100) .... 33
1.7.1 Indeks Harga yang Diterima Petani (IT), Indeks Harga yang Dibayar
Petani (IB) dan Nilai Tukar Petani Tanaman Pangan (NTPP) Serta
Perubahannya (2012 = 100) ... 34
1.7.2 Indeks Harga yang Diterima Petani (IT), Indeks Harga yang Dibayar
Petani (IB) dan Nilai Tukar Petani Hortikultura (NTPH) Serta
Perubahannya (2012 = 100) ... 35
1.7.3 Indeks Harga yang Diterima Petani (IT), Indeks Harga yang Dibayar
Petani (IB) dan Nilai Tukar Petani Tanaman Perkebunan
Rakyat (NTPR) Serta Perubahannya (2012 = 100) ... 36
CONTENT
1.1
Composite Consumer Price Indices of 82 Cities in Indonesia
(2012 = 100) ... 4
1.2
Composite Consumer Price Indices of 82 Cities in Indonesia and
Their Changes (2012 = 100) ... 5 - 6
1.3
Inflation Rate of 82 Cities in Indonesia (2012 = 100) ... 7 - 10
1.4
Consumer Price Indices (CPI) for Each of the 82 Cities and Their
Changes (2012 = 100) ... . 11 - 27
1.5.1 Average Producer Price of Paddy by Quality and Number of
Transaction at Huller Level in Indonesia ... 28
1.5.2 Producer Price Indices and Inflation Quarterly (2010=100) ... 29 - 32
1.6
Real and Nominal Wage for Farmworker, Constraction Worker, Woman’s
Haircut and Household Servant in Indonesia, (Rupiahs) (2007 = 100) .. 33
1.7.1 Indices of Prices Received by Farmers, Indices of Prices Paid by
Farmers, and Food Crops Farmers’ Terms of Trade (FFTT) and Their
Changes, (2012 = 100) ... 34
1.7.2 Indices of Prices Received by Farmers, Indices of Prices Paid by
Farmers, and Horticulture Farmers’ Terms of Trade (HFTT) and Their
Changes, (2012 = 100) ... 35
1.7.3 Indices of Prices Received by Farmers, Indices of Prices Paid by
Farmers, and Smallholder Plantantion Estate Crops Farmers’ Terms of
Trade (SFTT) and Their Changes, (2012 = 100) ... 36
1.7.4 Indeks Harga yang Diterima Petani (IT), Indeks Harga yang Dibayar
Petani (IB) dan Nilai Tukar Petani Peternakan (NTPT) Serta
Perubahannya (2012 = 100) ... 37
1.7.5 Indeks Harga yang Diterima Nelayan/Pembudidaya Ikan (IT), Indeks
Harga yang Dibayar Nelayan/Pembudidaya Ikan (IB) dan Nilai Tukar
Nelayan/Pembudidaya Ikan (NTNP) Serta Perubahannya
(2012 = 100) ... 38
1.7.6 Indeks Harga Yang Diterima Nelayan (IT), Indeks Harga Yang Dibayar
Nelayan (IB) Dan Nilai Tukar Nelayan (NTN) Serta Perubahannya
(2012 = 100) ... 39
1.7.7 Indeks Harga yang Diterima Pembudidaya Ikan (IT), Indeks Harga yang
Dibayar Pembudidaya Ikan (IB) dan Nilai Tukar Pembudidaya Ikan
(NTPI) Serta Perubahannya (2012 = 100) ... 40
1.7.8 Indeks Harga yang Diterima Petani (It), Indeks Harga yang Dibayar Petani
(Ib) dan Nilai Tukar Petani (NTP) Serta Perubahannya (2012 = 100) .... 41
1.7.9 Indeks Harga yang Diterima Petani (IT), Indeks Harga yang Dibayar
Petani (IB) dan Nilai Tukar Petani (Ntp) Tanpa Perikanan Serta
Perubahannya (2012 = 100) ... 42
1.8.1 Indeks Harga yang Diterima Petani (IT), Indeks Harga yang Dibayar
Petani (IB) dan Nilai Tukar Petani Tanaman Pangan (NTPP) Menurut
Provinsi (2012 = 100) ... 43
1.8.2 Indeks Harga yang Diterima Petani (IT), Indeks Harga yang Dibayar
Petani (IB) dan Nilai Tukar Petani Hortikultura (NTPH) Menurut Provinsi
(2012 = 100) ... 44
1.8.3 Indeks Harga yang Diterima Petani (IT), Indeks Harga yang Dibayar
Petani (IB) dan Nilai Tukar Petani Tanaman Perkebunan
Rakyat (NTPR) Menurut Provinsi (2012 = 100) ... 45
1.8.4 Indeks Harga yang Diterima Petani (IT), Indeks Harga yang Dibayar
Petani (IB) dan Nilai Tukar Petani Peternakan (NTPT) Menurut Provinsi
(2012 = 100) ... 46
1.7.4 Indices of Prices Received by Farmers, Indices of Prices Paid by
Farmers, and Animal Husbandry Farmers’ Terms of Trade (AFTT) and
Their Changes, (2012 = 100) ... 37
1.7.5 Indices Of Prices Received yy Fishermen/Fish Farmers, Indices Of Prices
Paid by Fishermen/Fish Farmers and Fishermen/Fish Farmers Terms Of
Trade (FTT) And Their Changes, (2012 = 100) ... 38
1.7.6 Indices Of Prices Received by Fishermen, Indices Of Prices Paid by
Fishermen and Fishermen Terms Of Trade (FTT) and Their Changes,
(2012 = 100) ... 39
1.7.7 Indices Of Prices Received by Fish Farmers, Indices Of Prices Paid by
Fish Farmers and Fish Farmers Terms Of Trade (FTT) and Their Changes
(2012 = 100) ... 40
1.7.8 Indices Of Prices Received by Farmers, Indices Of Prices Paid by
Farmers and Farmers' Terms Of Trade (FTT) and Their Changes,
(2012 = 100) ... 41
1.7.9 Indices Of Prices Received by Farmers, Indices Of Prices Paid by
Farmers and Farmers' Terms Of Trade (Ftt) Without Fishery and Their
Changes (2012 = 100) ... 42
1.8.1 Indices of Prices Received by Farmers, Indices of Prices Paid by
Farmers, and Food Crops Farmers’ Terms of Trade (FFTT)
by Province, (2012 = 100) ... 43
1.8.2 Indices of Prices Received by Farmers, Indices of Prices Paid by
Farmers, and Horticulture Farmers’ Terms of Trade (HFTT)
by Province, (2012 = 100) ... 44
1.8.3 Indices of Prices Received by Farmers, Indices of Prices Paid by
Farmers, and Smallholder Plantantion Estate Crops Farmers’
Terms of Trade (SFTT) by Province, (2012 = 100) ... 45
1.8.4 Indices Of Prices Received by Livestock, Indices Of Prices Paid by Live
Stock and Animal Husbandry Farmers' Terms Of Trade (Aftt) by
1.8.5 Indeks Harga yang Diterima Nelayan/Pembudidaya Ikan (IT), Indeks
Harga yang Dibayar Nelayan/Pembudidaya Ikan (Ib) dan Nilai Tukar
Nelayan/Pembudidaya Ikan (NTNP) Menurut Provinsi (2012 = 100) ... 47
1.8.6 Indeks Harga yang Diterima Nelayan (IT), Indeks Harga yang Dibayar
Nelayan (IB) dan Nilai Tukar Nelayan (NTN) Menurut Provinsi
(2012 = 100) ... 48
1.8.7 Indeks Harga yang Diterima Pembudidaya Ikan (IT), Indeks Harga yang
Dibayar Pembudidaya Ikan (IB) dan Nilai Tukar Pembudidaya Ikan (NTPI)
Menurut Provinsi (2012 = 100) ... 49
1.8.8 Indeks Harga yang Diterima Petani (IT), Indeks Harga yang Dibayar
Petani (IB) dan Nilai Tukar Petani (NTP) Menurut Provinsi
(2012 = 100) ... 50
1.8.9 Indeks Harga yang Diterima Petani (IT), Indeks Harga yang Dibayar
Petani (IB) dan Nilai Tukar Petani (NTP) Tanpa Perikanan Menurut
Provinsi (2012 = 100) ... 51
1.9
Indeks Harga Perdagangan Besar, Sektor Pertanian,
Pertambangan dan Penggalian (2010=100) ... ………..52
1.10
Indeks Harga Perdagangan Besar, Sektor Industri
(2010=100) ... 53 - 56
1.11
Indeks Harga Perdagangan Besar Kelompok Barang Impor,
(2010=100) ... 57 - 60
1.12
Indeks Harga Perdagangan Besar Kelompok Barang Ekspor
(2010=100) ... 61 - 64
1.13
Indeks Harga Perdagangan Besar (2010=100) ... 65
1.14
Indeks Harga Perdagangan Besar Bahan Bangunan/Konstruksi
Menurut Jenis Konstruksi/Bangunan, (2010=100) ... 66
1.15
Indeks Harga Perdagangan Besar Bahan Bangunan/Konstruksi
Indonesia Menurut Kelompok Jenis Barang (2010=100) ... 67
1.8.5 Indices Of Prices Received by Fishermen/Fish Farmers, Indices Of Prices
Paid by Fishermen/Fish Farmers and Fishermen/Fish Farmers Terms Of
Trade (Ftt) by Province, (2012 = 100) ... 47
1.8.6 Indices Of Prices Received by Fishermen, Indices Of Prices Paid by
Fishermen and Fishermen Terms Of Trade (Ftt) by Province,
(2012 = 100) ... 48
1.8.7 Indices Of Prices Received by Fish Farmers, Indices Of Prices Paid by
Fish Farmers and Fish Farmers Terms Of Trade (Ftt) by Province,
(2012 = 100) ... 49
1.8.8 Indices Of Prices Received by Farmers, Indices Of Prices Paid by
Farmers and Farmers' Terms Of Trade (Ftt) by Province,
(2012 = 100) ... 50
1.8.9 Indices Of Prices Received by Farmers, Indices Of Prices Paid by
Farmers and Farmers' Terms Of Trade (Ftt) Without Fishery by Province,
(2012 = 100) ... 51
1.9
Wholesale Price Indices, of Agricultural, Mining and Quarrying
Sectors (2010=100) ... 52
1.10
Wholesale Price Indices of Manufacturing Sector (2010=100) ... 53 - 56
1.11
Wholesale Price Indices of Import Commodities Group
(2010=100) ... 57 - 60
1.12
Wholesale Price Indices of Export Commodities Group
(2010=100) ... 61 - 64
1.13
Wholesale Price Indices, (2010=100) ... 65
1.14
Wholesale Price Indices of Construction Materials by Type
of Construction, (2010=100) ... 66
1.15 Wholesale Price Indices of Construction Materials of Indonesia
By Group of Commodities, (2010=100) ... 67
h
tt
p
:/
/ w
w
w
. b
p
s.
g
o
1.16
Perkembangan Harga Rata-rata Valuta Asing dan Emasdi Pasaran
Jakarta ... 68
1.17
Perdagangan Saham di Bursa Efek Indonesia ... 69
II.
KEUANGAN
PENJELASAN TEKNIS ... 71
2.1
Realisasi Penerimaan Negara ... 72
2.2
Realisasi Pengeluaran Negara ... 73
III.
PERBANKAN
PENJELASAN TEKNIS ... 75 - 76
3.1
Uang Beredar ... 77
3.2
Posisi Kredit Perbankan dalam Rupiah dan Valuta Asing Menurut
Sektor Ekonomi ... 78 - 79
3.3
Pemberian Kredit oleh Bank Kredit Desa dan Pegadaian Negara. ... 80
3.4
Suku Bunga Kredit Rupiah Menurut Kelompok Bank ... 81
3.5
Posisi Kredit Investasi Perbankan dalam Rupiah dan Valuta Asing
Menurut Sektor Ekonomi ... 82
3.6
Suku Bunga Deposito Berjangka Bank Umum ... 83
IV.
PENANAMAN MODAL
PENJELASAN TEKNIS ... 85
4.1.1 Perkembangan Realisasi Investasi Penanaman Modal Dalam
Negeri Menurut Sektor Ekonomi ... 86
4.1.2 Perkembangan Realisasi Investasi Penanaman Modal Dalam Negeri
Menurut Lokasi ... 87
4.2.1 Perkembangan Realisasi Investasi Penanaman Modal Luar
Negeri Menurut Sektor Ekonomi ... 88
1.16
Average Prices of Foreign Currencies and Gold in Jakarta Market. ... 68
1.17
Share Trading at the Indonesia Stock Exchange ... 69
II.
FINANCE
TECHNICAL NOTES ... 71
2.1
Actual Government Revenues ... 72
2.2
Actual Government Expenditures ... 73
III.
BANKING
TECHNICAL NOTES ... 75 - 76
3.1
Money Supply ... 77
3.2
Outstanding Bank Credits in Rupiah and Foreign Exchange by
Economic Sectors ... 78 - 79
3.3
Outstanding Credits by Village Credit Institution and Government
Pawnshops ... 80
3.4
Rupiah Credit Interest Rates By Group of Banks ... 81
3.5
Banks’ Outstanding Investment Credits in Rupiah and Foreign
Exchange by Economic Sectors ... 82
3.6
Commercial Banks’Interest Rates on Time Deposit ... 83
IV.
INVESTMENT
TECHNICAL NOTES ... 85
4.1.1 Statistic of Domestic Direct Investment Realization by Economic
Sector ... 86
4.1.2 Statistic of Domestic Direct Investment Realization by Location ... 87
4.2.1 Statistic of Foreign Direct Investment Realization by Economic
Sector ... 88
h
tt
p
:/
/ w
w
w
. b
p
s.
g
o
4.2.2 Perkembangan Realisasi Investasi Penanaman Modal Luar Negeri
Menurut Lokasi ... 89
4.2.3 Perkembangan Realisasi Investasi Penanaman Modal Luar Negeri
Menurut Negara ... 90
V.
PRODUKSI
PENJELASAN TEKNIS ... 91 - 93
5.1
Produksi Tanaman Bahan Makanan ... 94
5.2
Produksi dan Persediaan Tanaman Perkebunan Besar ... 95
5.3.A Indeks Produksi Bulanan Industri Besar dan Sedang (2010=100) ... 96
5.3.B Indeks Produksi Triwulanan dari Kelompok Industri Besar dan
Sedang (2010=100) ... 97 - 98
5.4.1 Produksi Bulanan 8 Bahan Tambang di Indonesia ... 99
5.4.2 Indeks Produksi Bulanan 8 Bahan Tambang di Indonesia
(2010=100) ... 100
5.5
Produksi Minyak Mentah (Termasuk Kondensat) dan Gas ... 101
5.6.1 Indeks dan Pertumbuhan Pekerja Tetap, Hari Orang, Balas Jasa dan
Upah, serta Nilai Konstruksi yang Diselesaikan ... 102
5.6.2 Indeks dan Pertumbuhan Pekerja Tetap, Hari Orang, Balas Jasa dan
Upah, serta Nilai Konstruksi yang Diselesaikan Menurut Provinsi ... 103
VI.
NERACA PEMBAYARAN DAN PERDAGANGAN LUAR NEGERI
PENJELASAN TEKNIS ... 105 - 106
6.1
Neraca Pembayaran ... 107
6.2
Neraca Perdagangan Barang Migas dan Non Migas ... .108
6.3
Nilai Ekspor Menurut Golongan Barang SITC ... 109
4.2.2 Statistic of Foreign Direct Investment Realization by Location ... 89
4.2.3 Statistic of Foreign Direct Investment Realization by Country ... 90
V.
PRODUCTION
TECHNICAL NOTES ... 91 - 93
5.1
Production of Food Crops ... 94
5.2
Production and Stocks of Estate Crops ... 95
5.3.A Monthly Production Indices of Large and Medium Manufacturing
Industry (2010=100) ... 96
5.3.B Quarterly Production Indices of Large and Medium Manufacturing
Industry (2010=100) ... 97 - 98
5.4.1 Monthly Production of 8 Minerals in Indonesia ... 99
5.4.2 Monthly Production Indices of 8 Minerals in Indonesia(2010=100) .... 100
5.5
Crude Petroleum (Including Condensate) and Gas Production ... 101
5.6.1 Indices and Growth of Permanent Workers, Mandays, Compensation and
Wages, and Value of Construction Completed ... 102
5.6.2 Indices of Permanent Workers, Mandays, Compensation and Wages, and
Value of Construction Completed buy Province ... 103
VI.
BALANCE OF PAYMENTS AND INTERNATIONAL TRADE
TECHNICAL NOTES ... ..105 - 106
6.1
Balance of Payments ... .107
6.2
Balance of Trade of Oil & Gas and Non-Oil & Gas ... 108
6.3
Exports Value by SITC Commodity Groups ... 109
h
tt
p
:/
/ w
w
w
. b
p
s.
g
o
6.4.1 Ekspor Hasil Pertanian (nilai) ... 110 - 111
6.4.2 Ekspor Hasil Pertanian (berat bersih) ... 112 - 113
6.5.1 Ekspor Hasil Industri (nilai) ... 114 - 115
6.5.2 Ekspor Hasil Industri (berat bersih) ... 116 - 117
6.6.1 Ekspor Hasil Tambang, Tidak Termasuk Migas (nilai) ... 118
6.6.2 Ekspor Hasil Tambang, Tidak Termasuk Migas (berat bersih) ... 119
6.7
Ringkasan Ekspor Indonesia (nilai) ... 120
6.8.1 Ekspor Menurut Negara Tujuan ... 121
6.8.2 Nilai Ekspor Non Migas dan Migas Menurut Negara Tujuan ... 122 - 123
6.9.1 Ekspor Menurut Pelabuhan Penting ... 124
6.9.2 Ekspor Menurut Provinsi Asal Barang ... 125 - 126
6.10
Nilai Ekspor Menurut Kelompok Komoditi Primer dan Bukan
Primer ... 127-128
6.11
Nilai Impor Menurut Golongan Barang SITC ... 129
6.12.1 Nilai Impor Menurut Negara Asal ... 130
6.12.2 Nilai Impor Non Migas dan Migas Menurut Negara Asal ... 131 - 132
6.13.1 Nilai Impor Menurut Pelabuhan Penting ... 133
6.13.2 Nilai Impor Non Migas & Migas Menurut Pelabuhan Bongkar ... 134 -135
6.14
Nilai Impor Menurut Golongan Barang Ekonomi ... 136
6.15
Nilai Impor Barang Barang Konsumsi ... 137
6.4.1 Exports of Agricultural Products (value) ... 110 - 111
6.4.2 Exports of Agricultural Products (net weight) ... 112 - 113
6.5.1 Exports of Industrial Products (value) ... 114 - 115
6.5.2 Exports of Industrial Products (net weight) ... 116 - 117
6.6.1 Exports of Mining Products, Excluding Petroleum&Gas (value) ... 118
6.6.2 Exports of Mining Products, Excluding Petroleum and Gas
(net weight) ... 119
6.7
Summary of Indonesian Exports (value) ... 120
6.8.1 Exports Value by Country of Destination ... 121
6.8.2 Exports Value of Non Oil&Gas and Oil&Gas by Country of
Destination ... 122 - 123
6.9.1 Exports Value by Main Ports ... 124
6.9.2 Exports Value of Non Oil&Gas ann Oil&Gas by Main Ports ... 125 - 126
6.10
Exports Base On Province Of Origin ... 127-128
6.11
Imports Value by SITC Commodity Groups ... 129
6.12.1 Imports Value by Country of Origin ... 130
6.12.2 Imports Value of Non Oil&Gas and Oil&Gas by Country of
Origin ... 121 - 121
6.13.1 Imports Value by Main Ports ... 129
6.13.2 Imports Value of Non Oil&Gas and Oil&Gas by and Main Ports .. 130 - 131
6.14
Imports Value by Broad Economic Categories ... 136
6.15
Imports Value of Consumption Goods ... 137
h
tt
p
:/
/ w
w
w
. b
p
s.
g
o
6.16
Nilai Impor Bahan Baku dan Penolong ... 138
6.17
Nilai Impor Barang Barang Modal ... 139
VII.
PERHUBUNGAN
PENJELASAN TEKNIS ... 141
7.1.1 Bongkar/Muat Barang Angkutan Antar Pulau di 4 Pelabuhan
Utama ... 142
7.1.2 Bongkar/Muat Barang Angkutan Luar Negeri di 4 Pelabuhan
Utama ... 143
7.2.1 Lalu Lintas Penumpang Angkutan Udara Dalam Negeri di 5
Pelabuhan Udara Utama ... 144
7.2.2 Bongkar/Muat Barang Angkutan Udara Dalam Negeri di 5
Pelabuhan Udara Utama ... 145
7.2.3 Lalu Lintas Penumpang Angkutan Udara Luar Negeri di 4
Pelabuhan Udara Utama ... 146
7.2.4 Bongkar/Muat Barang Angkutan Udara Luar Negeri di 4
Pelabuhan Udara Utama ... 147
7.2.5 Lalu Lintas Udara Penerbangan Dalam Negeri ... 148
7.2.6 Lalu Lintas Udara Penerbangan Luar Negeri ... 149
7.3
Produksi Angkutan Kereta Api ... 150
7.4
Jumlah Penumpang dan Barang yang Diangkut Menurut Jenis
Angkutan Dalam Negeri ... 151
VIII.
HOTEL DAN PARIWISATA
PENJELASAN TEKNIS ... 153
8.1.1 Tingkat Penghunian Kamar pada Hotel Berbintangdi 27
Provinsi Daerah Tujuan Wisata, ... 154
6.16
Imports Value of Raw Materials and Auxiliary Goods ... 138
6.17
Imports Value of Capital Goods ... 139
VII.
TRANSPORTATION
TECHNICAL NOTES ... 141
7.1.1 Volume of Inter-Island Cargo Loaded/Unloaded at 4 MainSea
Ports ... 142
7.1.2 Volume of International Cargo Loaded/Unloaded at 4 MainSea
Ports ... 143
7.2.1 Domestic Aircraft Passengers Traffic at 5 Main Airports ... 144
7.2.2 Volume of Domestic Aircraft Cargo Loaded/Unloaded at 5 Main
Airports ... 145
7.2.3 International Aircraft Passengers Traffic at 4 Main Airports ... 146
7.2.4 Volume of International Aircraft Loaded/Unloaded at 4 Main
Airports ... 147
7.2.5 Domestic Aircraft Traffic ... 148
7.2.6 International Aircraft Traffic ... 149
7.3
Production of Railways ... 150
7.4
Number of Passenger and Freigth by Domestic Cargo ... 151
VIII.
HOTEL AND TOURISM
TECHNICAL NOTES ... 153
8.1.1 Room Occupancy Rate of Classified Hotels in 27 Provinces
of Main Tourist Destination , ... 154
h
tt
p
:/
/ w
w
w
. b
p
s.
g
o
8.1.2 Tingkat Penghunian Kamar pada Hotel Berbintangdi Provinsi
Lainnya ... 155
8.1.3 Tingkat Penghunian Kamar pada Hotel Tidak Berbintang ... 156
8.2.1 Rata rata Lama Menginap Tamu Asing dan Tamu Dalam Negeripada
Hotel Berbintang di 27 Provinsi Daerah TujuanWisata, ... 157
8.2.2 Rata rata Lama Menginap Tamu Asing dan Tamu DalamNegeri pada
Hotel Berbintang di Provinsi Lainnya ... 158
8.2.3 Rata rata Lama Menginap Tamu Asing dan Tamu DalamNegeri pada
Hotel Tidak Berbintang ... 159
8.3.1 Rata rata Lama Menginap Tamu Asing pada Hotel Berbintang
di 27 Provinsi Daerah Tujuan Wisata ... 160
8.3.2 Rata rata Lama Menginap Tamu Asing pada Hotel Berbintang
di Provinsi Lainnya ... 161
8.4
Jumlah Wisatawan Asing yang Datang Melalui 19 Pintu Masuk
Utama ... 162 - 163
IX. PENDAPATAN NASIONAL
9.1
Produk Domestik Bruto Triwulanan Atas Dasar HargaBerlaku
Menurut Lapangan Usaha ... 165 - 173
9.2
Produk Domestik Bruto Triwulanan Atas Dasar Harga
Konstan 2010 Menurut Lapangan Usaha ... 174 - 182
9.3
Produk Domestik Bruto Triwulanan Atas Dasar Harga Berlaku
Menurut Pengeluaran ... 183 - 185
9.4
Produk Domestik Bruto Triwulanan Atas Dasar Harga Konstan 2010
Menurut Pengeluaran ... 186 - 187
8.1.2 Room Occupancy Rate of Classified Hotels inOther Provinces ... 155
8.1.3 Room Occupancy Rate of Non Classified Hotels ... 156
8.2.1 Average Length of Stay of Foreign and Domestic Guest atClassified
Hotels in 27 Provinces of Main TouristDestination, ... 157
8.2.2 Average Length of Stay of Foreign and DomesticGuests at
Classified Hotels in Other Provinces ... 158
8.2.3 Average Length of Stay of Foreign and DomesticGuests at Non
Classified Hotels ... 159
8.3.1 Average Length of Stay of Foreign Guests at Classified Hotels
in 27 Provinces of Main Tourist Destination Provinces, ... 160
8.3.2 Average Length of Stay of Foreign Guests at ClassifiedHotels
in Other Provinces ... 161
8.4
Number of Foreign Tourist Arrivals Through 19 MainPort of
Entry ... 162 - 163
IX.
NATIONAL INCOME
9.1
Quarterly Gross Domestic Product At Current MarketPrices
By Industrial Origin ... 165 - 173
9.2
Quarterly Gross Domestic Product At 2010 Constant Market
Prices By Industrial Origin ... 174 - 182
9.3
Quarterly Gross Domestic Product At Current MarketPrices
By Type of Expenditure ... 183 - 185
9.4
Quarterly Gross Domestic Product At 2010 Constant Market
Prices By Type of Expenditure ... 186 - 187
h
tt
p
:/
/ w
w
w
. b
p
s.
g
o
PENJELASAN
Metrik ton = 0,98421 long ton = 1000 kg
Ounce (oz) = 28,31 gr
di pelabuhan tanjung priok untuk
angkutan antarpulau didominasi
muat barang
,
sebaliknya angkutan luar negeri didominasi
bongkar barang
Angkutan Luar negeri (TON)
muat = 441.472
bongkar =
1.316.675
Angkutan antarpulau (TON)
muat =
1.432.089
bongkar = 1.282.355
ikon: Madebyoliver
h
tt
p
:/
/ w
w
w
. b
p
s.
g
o
ULASAN SINGKAT INDIKATOR EKONOMI, NOVEMBER 2016
Pada November 2016 terjadi inflasi sebesar 0,47 persen. Sementara itu
pada November 2015 terjadi deflasi sebesar 0,21 persen. Pada bulan ini sebagian
besar kelompok mengalami inflasi. Kelompok yang mengalami inflasi antara lain
Kelompok Bahan Makanan (1,66 persen),
12,06 persen, penurunan sebesar 8,93 persen pada uang kartal dan penurunan
sebesar 15,07 persen pada uang giral.
Indeks Nilai Tukar Petani (NTP) sebagai perbandingan antara Indeks Harga
yang Diterima Petani dengan Indeks Harga yang Dibayar Petani. Mulai Desember
2013, NTP menggunakan Tahun Dasar 2012=100. Pada November 2016, dari 33
provinsi yang disurvei tercatat sebanyak 16 provinsi memiliki NTP di atas angka
100, sedangkan 17 provinsi memiliki NTP di bawah angka 100. NTP tertinggi
tercatat di Provinsi Sulawesi Barat dengan nilai NTP sebesar 108,6 sedangkan
NTP terendah berada di Provinsi Bengkulu dengan NTP sebesar 93,3.
Pada Triwulan I tahun 2016 ada 1.179 Proyek Penanaman Modal Dalam
Negeri (PMDN) yang telah direalisasikan dengan nilai investasi Rp 50,35 triliun.
Investasi PMDN tersebut sebagian besar terserap pada Sektor Perindustrian
ECONOMIC INDICATOR HIGHLIGHTS, NOVEMBER 2016
In November 2016 it was recorded inflation of 0.47 percent. Meanwhile in
November 2015, deflation was recorded at 0.21 percent. In this month most of groups
experienced an inflation. food Stuff Groups (1,66 percent), Health Groups (0.30 percent),
Prepared Food, Beverage, Cigarette And
60 percent in demand deposits. That amount
increased by 3.50 percent compared with the
supply experienced an increased 12.06 percent as a result of the increased of currency
outside banks 8.93 percent, and demand deposits increased 15.07 percent.
The Farmers’ Terms of Trade (FTT) index, is the comparison between the index of
Producer Prices Received by Farmers to the index of Consumer Prices Paid by Farmers.
Since December 2013, FTT index using base year 2012=100. In November 2016, among
33 provinces, 16 provinces have FTT index beyond 100, while 17 provinces with the FTT
index below 100. The highest FTT Index recorded at Sulawesi Barat (108.6), meanwhile
the lowest FTT Index recorded at Bengkulu (93.3).
In first Quarter 2016 there were 1,179 Domestic Investment Projects (DIP)
realizations with an investment value of Rp 50.35 trillion. This investment was dominated
by the Manufacturing Sector (50.56 percent), than followed by Agriculture, Hunting, Forestry
-0.6
Nov'15Des'15Jan'16Feb'16Mar'16Apr'16Mei'16Jun'16 Jul'16 Agt'16Sep'16Okt'16Nov'16
Grafik 1. Laju Inflasi di Indonesia
and Fisheries Sector (18.03 percent) and the Electricity, Gas and Water Sector
(10.18 percent). Meanwhile, in the same periode Foreign Investment Projects (FIP)
realizations were 3,888 projects with an investment value of 6.92 billion USD. This
investment totally dominated by the Manufacturing Sector (78.97 percent), then
followed by Financing, Insurance, Real Estate and Business Services Sector at
5.50 percent and Wholesale and Retail Trade, Restaurants and Hotels Sector at
3.41 percent.
Based on figures 2015, paddy
production in third subround 2015, was 16.56
million tons, with the composition of 99.30 percent
for wetland paddy and 0.70 percent for dryland
paddy. It increased by 0.23 percent by when
compared to third subround 2015. Meanwhile,
paddy production during 2015 was 75.40 million
tons or a higher 6.42 percent than paddy
production in 2014, which was 70.85 million tons.
The monthly Production Index of Large
and Medium Manufacturing Industry in September
2016 was estimated to have decreased by 2.81 percent from the previous month to
131.00. Meanwhile, this index increased by 0.53 percent compared to the monthly
production index in September 2015. While, quartery Production Index of Large
and Medium Manufacturing Industry in first quarter 2016 was estimated increased
by 0.89 percent compared with the previous quarter. This was caused by the
increased in the efficiency of some subsectors, especially Manufacture of computers,
electronic and optical products (6.77 percent), Manufacture of other non-metallic
mineral products (3.89 percent) and Manufacture of food products (3.21 percent) .
In addition, there are several sub-sectors experienced an increase in performance,
especially Manufacture of wood and of products of wood and cork, except furniture;
manufacture of articles of straw and plaiting materials, bamboo, rattan and the like
(50,56 persen); diikuti oleh Sektor Pertanian, Perburuan,Kehutanan dan Perikanan
serta Sektor Listrik, Gas dan Air masing-masing mampu menyerap sebesar yaitu
18,03 persen dan 10,18 persen. Sementara itu pada periode yang sama, proyek
Penanaman Modal Asing (PMA) yang direalisasikan berjumlah 3.888 proyek dengan
nilai investasi 6,92 miliar US dolar. Jika dilihat secara sektoral, PMA tersebut
didominasi oleh Sektor Perindustrian (78,97 persen), kemudian diikuti oleh Sektor
Lembaga Keuangan, Perasuransian, Real Estate serta Sektor Perdagangan Besar
dan Eceran, Restoran dan Hotel
masing-75,40 juta ton atau lebih tinggi 6,42 persen jika
dibanding produksi padi selama tahun 2014
sebesar 70,85 juta ton.
Indeks Produksi Bulanan Industri Besar
dan Sedang pada September 2016
diperkirakan turun 2,81 persen dari indeks bulan sebelumnya menjadi 131,00.
Jika dibanding Indeks produksi pada September 2015, indeks tersebut naik
sebesar 0,53 persen. Sementara Indeks Produksi Industri Besar dan Sedang
pada triwulan III-2016 diperkirakan naik 0,89 persen dibanding triwulan
sebelumnya. Hal ini disebabkah oleh meningkatnya kinerja sebagian besar
subsektor, terutama Industri Komputer, Barang Elektronik dan Optik (6,77 persen),
Industri Barang Galian Bukan Logam (3,89 persen) dan Industri Makanan (3,21
persen). Di samping itu ada beberapa subsektor yang mengalami kenaikan kinerja,
terutama Industri Kayu, Barang dari Kayu dan Gabus (Tidak Termasuk Furnitur)
dan Barang Anyaman dari Bambu, Rotan dan Sejenisnya (8,97 persen), Jasa
-1000000
Padi Jagung Kedelai Kacang Tanah Ubi Kayu Ubi Jalar
Jan - Apr 2015 Mei - Agt 2015 Sep - Des 2015
Rice MaizeMaizeMaizeMaizeMaizeMaizeMaizeMaizeMaizeMaizeMaizeMaizeMaizeMaizeMaizeMaizeMaizeMaizeMaizeMaizeMaizeMaizeMaizeMaizeMaizeMaizeMaizeMaize CassavaCassavaCassavaCassavaCassavaCassavaCassavaCassavaCassavaCassavaCassava Sweet PotatoesSweet Potatoes
Reparasi dan Pemasangan Mesin dan
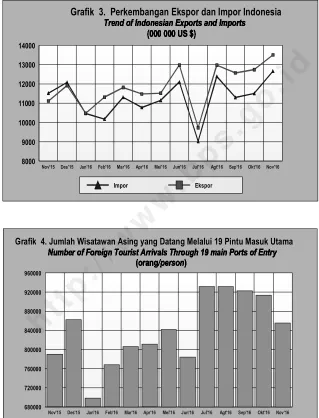
Impor Oktober 2016 masih didominasi oleh
impor bahan baku senilai 8,57 miliar US
dolar yang turun sekitar 3,66 persen
were 12.66 billion US dollars and 10.90 billion
US dollars (Chart 3). Therefore, the Balance of trade
for November 2016 including petroleum and gas
experienced a surplus 0.85 billion US dollars,
where as the value without petroleum and gas was
surplus of 1.50 billion US dollars. Compared with
the value of exports in November 2015, the value
of these exports with petroleum and gas increased
still dominated by raw materials at 8.57 billion US
dollars, which decreased by 3,66 percent
compared with the import of the same goods in
Octoberber 2015, which was 8.26 billion US
dollars.
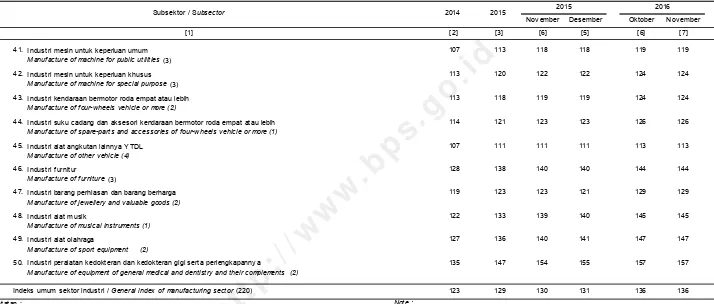
International tourists arrived via 19 main
entry ports in November 2016 were 855,545
people. This total decreased from the total entering
during the preceding month, which was
913,589
680000Nov'15 Des'15 Jan'16 Feb'16 Mar'16 Apr'16 Mei'16 Jun'16 Jul'16 Agt'16 Sep'16 Okt'16 Nov'16
Grafik 4. Jumlah Wisatawan Asing yang Datang Melalui 19 Pintu Masuk Utama
Number of Foreign Tourist Arrivals Through 19 main Ports of Entry
(orang
/person
)
Number of Foreign Tourist Arrivals Through 19 main Ports of Entry
(orang
/person
)
Number of Foreign Tourist Arrivals Through 19 main Ports of Entry
(orang
/person
)
Number of Foreign Tourist Arrivals Through 19 main Ports of Entry
(orang
/person
)
Number of Foreign Tourist Arrivals Through 19 main Ports of Entry
(orang
/person
)
Number of Foreign Tourist Arrivals Through 19 main Ports of Entry
(orang
/person
)
Number of Foreign Tourist Arrivals Through 19 main Ports of Entry
(orang
/person
)
Number of Foreign Tourist Arrivals Through 19 main Ports of Entry
(orang
/person
)
Number of Foreign Tourist Arrivals Through 19 main Ports of Entry
(orang
/person
)
Nov'15 Des'15 Jan'16 Feb'16 Mar'16 Apr'16 Mei'16 Jun'16 Jul'16 Agt'16 Sep'16 Okt'16 Nov'16
Impor Ekspor
Grafik 3. Perkembangan Ekspor dan Impor Indonesia
yang berjumlah 913.589 orang (Grafik 4). Peningkatan jumlah wisman terjadi di 8
pintu masuk utama. Sementara itu, jika dibandingkan dengan seluruh jumlah
wisman yang masuk pada November 2016 dibanding November 2015, terjadi
peningkatan sekitar 19,72 persen.
Tingkat Penghunian Kamar (TPK) pada hotel berbintang di 27 provinsi tujuan
wisata pada November 2016 naik di 15 provinsi dibandingkan bulan sebelumnya.
TPK pada bulan tersebut berkisar antara 41,2-72,7 persen dengan TPK tertinggi
tercatat di Sulawesi Utara. Dalam bulan yang sama, rata-rata lama menginap
tamu asing pada hotel berbintang berkisar antara 1,4-4,5 hari dengan lama
menginap tertinggi di Sulawesi Utara.
Produk Domestik Bruto (PDB) triwulan III-2016 atas dasar harga konstan
2010 mencapai Rp 2.428,72 triliun. PDB tersebut naik sekitar 5,02 persen
dibanding PDB atas dasar harga konstan 2010 pada triwulan yang sama tahun
2015 (y to y), dan secara q to q naik sebesar 3,20 persen. Secara q to q sektor
Transportasi dan Pergudangan merupakan sektor dengan pertumbuhan tertinggi
pada triwulan III-2016, yaitu sebesar 5,34 persen yang kedua adalah Sektor
Pertanian, Kehutanan, dan Perikanan sebesar 4,69 persen. Sementara itu, PDB
atas dasar harga berlaku triwulan III-2016 mencapai Rp.3.216,80 triliun dengan
sektor Industri Pengolahan sebagai penyumbang PDB terbesar (19,90 persen),
yang diikuti oleh Sektor Pertanian, Kehutanan dan Perikanan (14,42 persen) dan
Sektor Pertambangan dan Penggalian (6,94 persen). Dari sisi pengeluaran, PDB
triwulan III-2016 tersebut utamanya masih didominasi oleh konsumsi rumah tangga
dengan proporsi 57,19 persen, sedangkan untuk investasi proporsinya sekitar
33,07 persen. Bila dibandingkan dengan triwulan yang sama tahun 2015, atas
dasar harga konstan 2010, konsumsi rumah tangga naik 7,54 persen dan investasi
naik 6,03 persen.
people (Chart 4). The increase in international tourists who entered in that month
compared with the previous month occurred at 8 main ports of entry. While,
compared with the total entering international tourists in November 2016 compare
with November 2015, this total tourists increased by 19.72 percent.
The Room Occupancy Rate (ROR) of star-classified hotels in 27 tourist
destination provinces in November 2016 increased in 15 provinces. The ROR in
that month ranged between 41.2-72.7 percent, the highest ROR was in Sulawesi
Utara. In the same month, the average length of stay by foreign guests in
star-classified hotels ranged between 1.4-4.5 days with the longest length of stay in
Sulawesi Utara.
Gross Domestic Product (GDP) in third quarter 2016, at 2010 constant market
prices, reached Rp 2,428.72 trillion. The GDP increased around 5.02 percent
compared to GDP at 2010 constant market prices at the same quarter in 2015 (y to
y), and by q to q increase around 3.20 percent. By q to q sector with highest growth
during third quarter 2015 was Transportation and Warehousing (5.34 percent) and
second highest growth is Agriculture, Livestock, Forestry and Fishery (4.69 percent).
Meanwhile, at current market prices, the GDP in third quarter 2016 reached Rp
3,216.80 trillion with Manufacturing Industry Sector being the main contributor (19.90
percent) followed by Agriculture, Livestock, Forestry And Fishery Sector (14.42
percent) and Mining And Quarrying Sector (6.94 percent). In terms of expenditure,
GDP at third quarter 2016 was mainly dominated by private expenditure accounting
for a proportion of 57.19 percent, while the proportion made up by investment was
33.07 percent. However, compared to conditions at the same quarter in 2015, at
2010 constant market prices, the household expenditure increased by 7.54 percent
and investment increased by 6.03 percent respectively.
h
tt
p
:/
/ w
w
w
. b
p
s.
g
o
INDEKS HARGA
PRICE INDICES
PENJELASAN TEKNIS
1.
Mulai bulan Januari 2014, Indeks Harga Konsumen (IHK) mencakup sekitar
225-462 komoditas dihitung berdasarkan pola konsumsi hasil Survei Biaya Hidup
(SBH) di 82 kota tahun 2012.
2.
Sedangkan IHK dan laju inflasi sebelum bulan Januari 2014 masih mencakup
284-441 komoditas dengan menggunakan pola konsumsi hasil SBH di 66 ibukota
provinsi tahun 2007.
3.
IHK gabungan 82 kota merupakan hasil penghitungan dari gabungan indeks
masing-masing kota yang ditimbang dengan banyaknya rumahtangga di kota
bersangkutan.
4.
Dalam penyajian IHK pada metode baru jenis barang/jasa tersebut dikelompokkan
menjadi 7 kelompok yaitu
5.
a. Persentase (%) perubahan IHK (Laju inflasi/Deflasi) bulanan diperoleh dari :
dimana :
I
n= Indeks bulan n
I
n-1= Indeks bulan n-1
b. Persentase (%) perubahan IHK dalam satu tahun dihitung dengan
menggunakan metode point to point.
6.
IHK dihitung menggunakan formula Laspeyres yang dikembangkan, yaitu:
dimana :
1.
Since January 2014, the calculation of the Consumer Price Index (CPI) has been
based on a consumption pattern obtained from the 2012 Cost of Living Survey
(CLS) in 82 cities, covering 225-462 commodities.
2.
Before January 2014, the calculation of the CPI and inflation rate covered
284-441 commodities, and was based on a consumption pattern obtained from the
2007 CLS in 66 provincial capital cities.
3.
The CPI of Indonesia is a weighted composite index of the calculated CPI’s in 82
cities, using the total number of households in each city as the weighting factor.
4.
In the new method of CPI, commodities divided into 7 groups as follows :
-Foodstuff
- Health
- Prepared food, beverage,
- Education, recreation &
cigarette & tobacco
sports
- Housing
- Transportation &
- Clothing
Communication
5.
a. The percentage change of the monthly CPI (Inflation rate) is obtained from :
b. The percentage change of yearly CPI is calculate using point to point method.
INDEKS HARGA
PRICE INDICES
7.
Indeks Harga Produsen (IHP) dihitung berdasarkan survei harga produsen yang
dilakukan sejak 2010 di 33 provinsi di Indonesia. Data dikumpulkan oleh BPS
setiap bulan. Pemilihan responden dilakukan secara purposive.
8. Penghitungan IHP menggunakan tahun dasar 2010 (2010=100) yang mencakup
3 sektor, yaitu pertanian, pertambangan dan penggalian, dan industri pengolahan
yang terdiri dari 26 subsektor. IHP dihitung menggunakan Formula Laspeyres
yang dikembangkan. Pengelompokan komoditas dalam IHP didasarkan pada
Klasifikasi Baku Komoditi Indonesia (KBKI). IHP disajikan triwulanan pada tingkat
nasional dalam bentuk indeks umum, indeks sektor, dan indeks subsektor.
9.
Indeks Harga yang dibayar petani disusun berdasarkan data hasil survei bulanan
statistik harga konsumen di pasar pedesaan dengan memakai daftar HPI.
10. Indeks harga yang diterima petani sumbernya adalah dari hasil survei harga
produsen/farmgate yang dilaksanakan setiap bulan dengan memakai daftar HP2.1
dan HP2.2.
11. Sejak Desember 2013, Indeks Harga yang diterima dan dibayar petani serta nilai
tukarnya menggunakan tahun dasar 2012, sedangkan sebelum Desember 2013,
menggunakan tahun dasar 2007
12. Indeks harga yang diterima petani (IT) dan indeks yang dibayar petani (IB) dihitung
menggunakan formula Laspeyres yang dikembangkan.
13. Nilai tukar petani adalah merupakan ratio antara Indeks Harga yang diterima (IT)
dengan yang dibayar petani (IB) yang dinyatakan dalam persentase.
14. Data Harga Perdagangan Besar (HPB) dikumpulkan setiap bulan oleh BPS dari
sekitar 182 kota yaitu ibukota provinsi dan beberapa ibukota kabupaten yang ada
kegiatan Perdagangan Besar.
15. Penyajian hanya berupa angka nasional tanpa angka Provinsi atau Kabupaten.
7.
The Producer Price Index (PPIs) is calculated based on producer price survey
which is conducted since 2010 in 33 provinces in Indonesia. Producer Price data
are collected monthly by BPS. The respondents are selected purposively.
8.
The calculation of PPIs used the year 2010 as the base year (2010=100) covering
3 sectors, which are agriculture, mining and quarrying, and manufacturing, consist
of 26 subsectors. The PPI are calculated using a modified Laspeyres formula.
The grouping of commodities in PPIs is based on Central Product Classification
(CPC). The PPI is presented quarterly on national level in general index, sector
index, and sub-sector index.
9.
The index of price paid by farmers are compiled based on data obtained from the
monthly survey of consumer price statistics in rural markets using the HPI form.
10. The indices of prices received by farmers are calculated from the producer/
farmgate price survey conducted every month using the HP2.1 and HP2.2 forms.
11. Since December 2013, 2012 has been used as the base year for calculating the
indices of prices received, the prices paid by farmers, and the farmers’ terms of
trade, prior to December 2013 using 2007 as base year.
12. A modified Laspeyres formula has been used to calculate the index of prices
received by farmers (IT) and the index of prices paid by farmers (IB).
13. The terms of trade for farmers is computed as the ratio of the index of prices
received by farmers (IT) and the index of prices paid by farmers (IB) multiplied by
100 %.
14. Wholesale price data are collected through a monthly survey conducted by the
BPS Statistics Indonesia in 182 cities consisting of provincial capital cities and
several regency capital cities where wholesale trade activities are found.
15. The data in this specific chapter pertain only to national figures, and does not
h
tt
p
:/
/ w
w
w
. b
p
s.
g
o
INDEKS HARGA
PRICE INDICES
16. Indeks Harga Perdagangan Besar (IHPB) dihitung menggunakan formula
Laspeyres yang dikembangkan.
17. Indeks Umum Harga Perdagangan Besar dikelompokkan atas 5 sektor yaitu :
Pertanian, Pertambangan dan Penggalian, Industri, Impor dan Ekspor.
Masing-masing sektor terdiri dari sub sektor. Jumlah komoditas dari setiap sub sektor
dinyatakan dengan jumlah keseluruhannya 315 komoditas.
18. Indeks Harga Perdagangan Besar (IHPB) bahan bangunan/konstruksi didasarkan
atas perubahan harga 25 kelompok barang tertentu.
19. Penghitungan IHPB masing-masing jenis bahan bangunan serta indeks
umumnya menggunakan perubahan harga dari sejumlah kelompok barang yang
dinyatakan dengan angka dalam kurung.
20. Kurs Valuta Asing dikumpulkan setiap hari Selasa dan Kamis dari tempat
penukaran mata uang terpilih.
21. Harga emas juga dikumpulkan setiap hari Selasa dan Kamis dari toko penjual
emas terpilih. Harga emas yang dicatat adalah harga emas perhiasan tanpa
ongkos pembuatan.
22. Perdagangan saham :
a. Saham yang diperdagangkan adalah saham yang terdaftar pada Badan
Pelaksana Pasar Modal (Bapepam) dan tercatat pada Bursa Efek Indonesia,
dikurangi dengan jumlah saham masing-masing perusahaan yang dijadikan
jaminan untuk menerbitkan sertifikat PT. Danareksa.
b. Volume perdagangan saham adalah jumlah transaksi saham yang terjadi
setiap hari bursa di Bursa Efek Indonesia.
c. Rata-rata perdagangan saham adalah jumlah saham di perdagangkan dibagi
dengan hari bursa (Senin s/d Jum’at kecuali hari libur).
16. A modified Laspeyres formula has been used to calculate The Wholesale Price
Index (WPI)
17. The Wholesale Price Index (WPI) is disaggregated into five sectors: Agriculture,
Manufacturing, Mining, and Quarrying, Imports, and Exports, where each sector
consists of subsectors. The number of commodities in each sector is presented in
brackets. The total number of commodities is 315.
18. The Wholesale Price Index for Construction materials is based on price changes
of 25 groups of selected goods.
19. The WPI, for each type of Construction materials and the general index are
calculated based on price changes of several groups of goods indicated by the
number in bracket.
20. Foreign exchange rate data are collected every Tuesday and Thursday from
selected money changers.
21. Gold price data are collected every Tuesday and Thursday from selected gold
traders. The price of gold recorded is the price of golden ornament excluding the
cost of production.
22. Share Trade :
a. Shares traded are registered shares at the Capital Market Supervisory Agency
(Bapepam) and recorded at Indonesian stock exchange, excluding shares
withhold as guarantee for the issuance of PT.Danareksa Certificates.
b. The volume of shares trade is the volume of daily transaction at the Indonesian
stock exchange.
c. The average volume of shares trade is the total number of shares traded
divided by the number of transaction days (Monday through Friday except
holiday).
h
tt
p
:/
/ w
w
w
. b
p
s.
g
o
INDEKS HARGA
PRICE INDICES
TABEL: 1.1 INDEKS HARGA KONSUMEN GABUNGAN 82 KOTA DI INDONESIATABLE: COMPOSITE CONSUMER PRICE INDICES OF 82 CITIES IN INDONESIA
(2012 = 100) 1)
2013 Nov ember 178,36 156,85 135,47 143,22 128,69 134,13 126,79 146,04
Desember 179,77 157,99 136,07 143,46 128,90 134,21 127,50 146,84
2014 Januari 117,81 110,71 108,72 103,88 105,76 105,98 113,72 110,99
Februari 118,23 111,19 108,90 104,47 106,06 106,16 113,89 111,28
Maret 117,71 111,67 109,07 104,55 106,50 106,31 114,16 111,37
April 116,43 112,17 109,34 104,29 107,15 106,56 114,39 111,35
Mei 116,26 112,56 109,59 104,42 107,59 106,63 114,63 111,53
Juni 117,41 112,92 110,01 104,73 107,98 106,72 114,85 112,01
Juli 119,69 114,05 110,50 105,62 108,40 107,20 115,86 113,05
Agustus 120,12 114,64 111,31 105,86 108,76 108,89 115,72 113,58
September 119,92 115,23 112,17 105,68 109,07 109,63 115,44 113,89
Oktober 120,22 115,73 113,34 105,90 109,72 109,88 115,62 114,42
Nov ember 122,80 116,55 113,90 105,81 110,19 109,97 120,58 116,14
Desember 126,76 118,84 115,55 106,49 111,00 110,37 127,27 119,00
2015 Januari 127,52 119,61 116,48 107,39 111,73 110,66 122,13 118,71
Februari 125,65 120,15 116,96 107,95 112,17 110,81 120,26 118,28
Maret 124,73 120,88 117,30 107,86 112,89 110,92 121,19 118,48
April 123,75 121,48 117,56 108,12 113,32 110,98 123,37 118,91
Mei 125,47 122,09 117,80 108,37 113,70 111,05 123,62 119,50
Juni 127,48 122,76 118,07 108,67 114,06 111,13 123,75 120,14
Juli 130,06 123,39 118,22 109,09 114,47 111,51 125,90 121,26
Agustus 131,24 124,26 118,41 109,10 115,27 113,43 125,17 121,73
September 129,83 124,75 118,65 110,01 115,78 114,44 124,67 121,67
Oktober 128,46 125,25 118,76 110,29 116,11 114,62 124,69 121,57
Nov ember 128,89 125,84 118,94 110,04 116,62 114,68 124,76 121,82
Desember 133,01 126,47 119,41 110,14 116,90 114,75 125,32 122,99
2016 Januari 135,93 127,11 120,04 110,43 117,32 114,92 123,93 123,62
Februari 135,14 127,91 119,50 111,14 117,63 114,99 123,74 123,51
Maret 136,07 128,37 119,42 111,75 117,98 115,02 123,47 123,75
April 134,79 128,82 119,26 112,00 118,35 115,05 121,50 123,19
Mei 135,19 129,57 119,28 112,49 118,67 115,08 121,76 123,48
Juni 137,38 130,32 119,46 113,28 119,07 115,12 122,53 124,29
Juli 138,92 131,03 119,75 113,78 119,51 115,71 124,03 125,15
Agustus 137,98 131,57 120,24 114,24 119,98 117,07 122,76 125,13
September 137,88 132,02 120,59 114,39 120,38 117,68 122,99 125,41
Oktober 137,59 132,34 121,26 114,04 120,73 117,80 122,95 125,59
Nov ember 139,88 132,67 121,46 114,03 121,09 117,82 123,04 126,18
Catatan : 1) Sebelum tahun 2014 merupakan laju inf lasi 66 kota (2007=100) Note : 1) Prior to 2014, the inflation rate in 66 cities (2007=100)
INDEKS HARGA
PRICE INDICES
TABEL: 1.2 INDEKS HARGA KONSUMEN GABUNGAN 82 KOTA DI INDONESIA DAN PERUBAHANNYATABLE: COMPOSITE CONSUMER PRICE INDICES OF 82 CITIES IN INDONESIA AND THEIR CHANGES
(2012 = 100)
INDEKS UMUM / GENERAL INDEX 126,18 0,47 2,37 2,59 3,58
I. BAHAN MAKANAN / FOODSTUFF 139,88 1,66 1,68 5,17 8,53 A. Padi-padian, umbi-umbian dan hasilny a / Cereals, roots, and their products 127,66 0,24 7,35 0,38 0,96 B. Daging dan hasil-hasilny a / Meat and its products 131,11 -0,68 6,45 0,92 4,37 C. Ikan segar / Fresh fish 135,93 -0,14 4,63 1,48 2,66 D. Ikan diawetkan / Preserved fish 138,95 0,72 7,43 5,19 5,96 E. Telur, susu dan hasil-hasilny a / Eggs, milk and their products 124,05 -0,77 2,84 -2,51 0,32 F. Say ur-say uran / Vegetables 159,00 3,81 9,33 5,03 7,56 G. Kacang - kacangan / Beans and nuts 130,85 -0,18 4,31 0,50 0,53 H. Buah - buahan / Fruits 146,46 -0,35 4,93 2,89 4,35 I. Bumbu - bumbuan / Spices 219,57 12,68 -26,32 38,50 66,39 J. Lemak dan miny ak / Fats and oils 116,23 -0,20 -2,26 8,01 8,60 K. Bahan makanan lainny a / Other food items 128,60 -0,05 5,95 4,39 4,45
II. MAKANAN JADI, MINUMAN, ROKOK DAN TEMBAKAU 132,67 0,25 5,89 4,90 5,43
PREPARED FOOD, BEVERAGE, CIGARETTE AND TOBACCO
A. Makanan jadi / Prepared food 131,70 0,20 5,31 3,48 3,84 B. Minuman y ang tidak beralkohol / Non-alcoholic beverages 124,45 0,02 5,66 5,69 6,09 C. Tembakau dan minuman beralkohol / Tobacco products and alcoholic beverages 143,23 0,61 7,84 8,20 9,30
III. PERUMAHAN, AIR, LISTRIK, GAS DAN BAHAN BAKAR 121,46 0,16 2,93 1,72 2,12
HOUSING, WATER, ELECTRICITY, GAS AND FUEL
A. Biay a tempat tinggal / Cost of housing 115,84 0,13 2,39 1,78 1,96 B. Bahan bakar, penerangan dan air / Fuel, electricity and water 139,67 0,17 3,47 0,96 1,94 C. Perlengkapan rumahtangga / Household equipment 117,74 0,08 4,18 2,23 2,59 D. Peny elenggaraan rumahtangga / Household operation 119,11 0,31 3,59 2,74 3,04
[4]
[1] [2] [5]
Kelompok / Group
Perubahan/ Change (%)
Nov 2015 thd Des 2014 Nov 2015 to Dec 2014
[6] Nov ember 2016
[3]
Persentase Perubahan / Percentage Changes
Tahun Kalender / Calender Year Tahun ke Tahun / Year on Year Indeks /
Index
Nov 2016 thd Des 2015 Nov 2016 to Dec 2015
Nov 2016 thd Nov 2015 Nov 2016 to Nov 2015