THE APPLICATION OF DIGITAL LINE GRAPHS AND MAP
IN THE NETWORK ENVIRONMENT
Xincheng Guo a, Biao Zhang a, Jiye Yu a, Hua Ran a, Li Wang a
a School of Geology Engineering and Geomatics, Chang’an University, Xi’an, Shaanxi, China, [email protected]
KEY WORDS: DLGM, DLG, WebGIS, Map Symbol, SVG, Visualization
ABSTRACT:
WebGIS is an important research field in GIS. W3C organization established SVG standard, which laid a foundation for WebGIS based on vector data. In China, Digital Line Graphs(DLG) is a significant GIS product and it has been used in many medium and large WebGIS system. Geographic information- portrayal is the common method of DLG visualization. However, the inherent characteristics of Geographic information - portrayal may lead to a relatively higher data production input, still, the visualization effect is not ideal. We put forward a new product named Digital Line Graphs and Map(DLGM), which consists of DLG and DLG’s cartographic presentation data. It provides visualization data based on the cartographic standards. Due to the manufacture and management of DLGM data that are independent from software and platform, its data can be used in many fields. Network application is one of them. This paper is to use DLGM in the network applications. First it reveals the connotation and characteristics of DLGM then analyses the model that DLGM organizes, manages DLG and map symbol data. After that, combined with SVG standards, we put forward DLGM’s SVG encoding method without any information loss. Finally we provide a web map system based on local area network by using 1:10000 DLGM data of a certain area. Based on this study, we conclude that DLGM can be used in the network environment providing high quality DLG and cartographic data for WebGIS.
1. INTRODUCTION
WebGIS is an important research field in GIS. It organizes and manages the geographic information data. Those data can be extracted from database according to the users' request. After a certain processing, the results will be passed on to the users via internet. With the development of network and computer technology, the construction of WebGIS also tend to diversify. But, no matter how complex the model and architecture are, the essence of WebGIS is still about data management, data response and data transmission. Therefore, the ability of WebGIS service mainly depends on the ability of data which contains the capacity of data visualization and the capacity of spatial data expression. The former capacity serves people, providing intuitive map while the latter one serves the computers for its recognition and calculation which are mainly about spatial query and spatial analysis.
In the aspect of spatial data expression, DLG data shows its significant advantages. DLG is the most important data in China SDI[1]. Due to the characteristics of vector data itself and the advanced database technology, WebGIS based on DLG has more advantages than the one based on raster data in spatial query and analysis.
In the aspect of visualization, DLG data is relatively weak. So far, the solution is geographic information- portrayal[2]. It allows us access map symbol information from symbol library via a certain interface, then match them in the DLG data[3]. That means we have to design different symbol library for different usage in order to achieve geographic feature’s expression. Many system utilize this method which is relatively easy to realize[4]. Nevertheless, the visualization quality of geographic information-portrayal is not ideal. The problem mainly reflects in the irrational distribution of map symbol[5], which will even cause unreasonable coverage between symbols. Furthermore, there is a strong relationship between the symbol
library and the software, which will result in that the data can hardly be used on the other applications separated from its production software.
Map symbol is the language of map. If we use cartographic presentation as DLG’s visualization, and separate data application and data manufacture, the high capacity of spatial data expression and visualization will be ensured. DLGM (Digital Line Graphs and Map) correspond with that concept[6]. In this paper the characteristics of DLGM is analyzed. Then we expound the feasibility that DLGM used in network and provide a complete SVG encoding solution according to SVG standards and the specific symbols description method of DLGM[7]. Finally, this paper showed a web application using DLGM data, providing web map for the local government.
2. DLGM
DLGM(Digital Line Graphs and Map) is a vector dataset of map elements. It stores the relationship of spatial data, the attribute information of geographic features and the feature’s cartographic data. The collection of geographic features is a map.
2.1 The definition of DLGM
The dataset of DLGM can be expressed in the following equation:
DMs = { {DMi},R } (1)
symbols.
For the each feature in the dataset, it can be expressed as follows:
DM={G,A,S} (2)
In the equation above, G is for the geometry of features and A stands for the feature’s attribute. S for feature’s symbol, which consists of map symbol data, parameters of visualization rule and other described information.
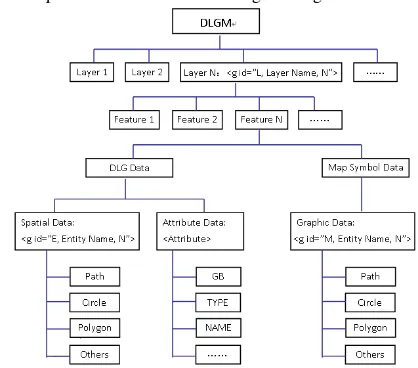
2.2 The Model of DLGM
The model of DLGM is as figure 1 shows.
Figure 1. The model of DLGM
DLGM manages its features by layers. Each feature consists of DLG data and map symbol data. DLG data consists of spatial data and attribute data, while map symbol data consists of several pieces of graphic data.
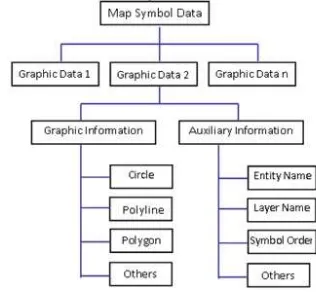
2.3 The map symbol data of DLGM
The map symbol data meets the requirements of China cartographic symbols for national fundamental scale maps. It is produced with DLG data of DLGM at the same time, but can be used independently. The structure of map symbol data is as figure 2 shows.
Figure 2. The structure of map symbol data.
The map symbol data of DLGM consists of several graphic data. Each of the graphic data consists of graphic information which contains circle, polyline, polygon and auxiliary
information which contains entity name, layer name, symbol order.
PostScript language is used to describe the map symbol data of DLGM. PostScript is an open format. The symbol it describes correspond with GKS standards[8]. The map symbol described by PostScript is as figure 3 shows.
Figure 3. The map symbol described by PostScript
2.4 The storage of DLGM
DLGM data can be stored in an extended DLG database to manage its data. As we know, the DLG data can be stored in a DLG database, for the map symbol data which is described by PostScript language, we can convert it into binary format, add a “SYMBOL” field in the table of database. The field's type is BLOB. We use this field to store the map symbol data and it does not change DLGM’s own structure. Figure 4 shows the structure of DLGM stored in extended DLG database.
Figure 4. The structure of DLGM in extended DLG database
2.5 The Characteristics of DLGM
DLGM has the following characteristics: 1.It ensures the quality of DLG requirements. 2.It ensures the quality of mapping requirements. 3.Its map symbol is independent, and the format is public. 4.It can be stored in DLG database.
3. DLGM IN THE NETWORK ENVIRONMENT
W3C launched SVG standards for the development of WebGIS and opened up a new way for vector data visualization on browsers. We studied it and found that we can get the data from the database by using SQL or other query languages then transform the vector data into SVG format directly.
controlling the database. In addition, the description of map symbol data is integrated, which means the users can transform the map symbol data into SVG description without any extra process.
3.1 The PostScrip description of map symbol data
In the PostScript description of map symbol data, each symbol contains one or several symbol elements. Symbol element is the minimum unit describing a map symbol. It contains the graphic description (such as polyline, point, circle, polygon, etc.) and the additional data about the layer name and the priority of visualization. The additional data also control the relationship and the structure among symbols, and the structure between symbol and symbol element.
Take a water well as an example, the well’s symbol contains four straight segments. Each of the segments is a symbol element. Figure 5 shows the symbol of the water well.
Figure 5. The symbol of the water well
The PostScript description of the water well is as follows:
%PSV_VAR:PSD_ENT_LAYER[HYDP]
In that description, the information begin with “%” represents additional information. For example, %@PSD_ORDER[215.5] means this symbol’s priority of visualization is 215.5. Those between “%@PSC_GRAPHB” and “%@PSC_GRAPHE” is the description of symbol element.
3.2 The SVG’s organization scheme of DLGM data
SVG (Scalable Vector Graphics) is an open extensible language that can describe two-dimensional vector and vector/grid mixed graphics. The key point that SVG’s organization of DLGM is to transform the DLG data and map symbol data into SVG without any information loss.
SVG has the following characteristics, which ensure DLGM
data can be transformed into SVG.
1. SVG meets the need of graphic expression. SVG provides some basic graphs and path object to satisfy the expression need of point, line, polygon features and so on. At the same time, it also meets the requirements of polyline symbol, arc symbol, and filling symbol in the map symbol data.
2. SVG supports graphics grouping. In the model of DLGM, there is a kind of relationship between each symbol, or between symbol and symbol element. This relationship is controlled by the additional information in PostScript. SVG provides an element <g> which is specially used to group graphic object. By using <g>, we can keep the data structure in SVG document according to the model of DLGM.
3. SVG can be extended. Based on XML standard, SVG has a good expansibility. It allows people define their own label to express the attribute data and other information.
3.3 The SVG encoding of DLGM
3.3.1 The encoding of DLG data in DLGM: DLG data contains spatial data and attribute data. For the spatial data of DLG, we can use the basic graphic elements of SVG to describe. Label <circle> for point. Label <path> ,<line> or <polyline> for polyline and <polygon> for area elements. Each element uses group object <g> to express. The attribute of “id” in <g> element stands for the identifier of the element. We formulate that “id” with the letter “E” (E for entity) as a prefix, “,” as a separator, after which the layer information is added. Then add another “,” and the element number in the layer.
For the attribute data of DLG, we customize a label <Attribute> to mark the attribute data. The field name and field value can be listed in the description of <Attribute>. Since <Attribute> is a customized label, SVG cannot recognize it. However , we can access the data in <Attribute> by creating a
3.3.2 The encoding of map symbol data in DLGM: We also use label <g> to encode the data of map symbol. The minimum group is the symbol element of a graphic feature. Several symbol elements form a map symbol. Thus, the structure of a map symbol is as follows:
<g>
<g> symbol element 1 </g> <g> symbol element 2 </g> ……
Like encoding spatial data of DLG, we use “id” with the letter “M” (M for map symbol) as a prefix to represent that this is map symbol description. “,” as a separator after which the layer information is added. Then add another “,” and the element number in the layer.
The SVG encoding of the water well’s map symbol is as follows:
<g id = "M,HYDP,1" >
<polyline points = "70,265 330,265 " fill = "none" stroke-width = "0.12" stroke-linejoin = "round" stroke = "rgb(0,168,235)" />
</g>
<g id = "M,HYDP,1">
<polyline points = "135,70 135,330 " fill = "none" stroke-width = "0.12" stroke-linejoin = "round" stroke = "rgb(0,168,235)" />
</g>
<g id = "M,HYDP,1">
<polyline points = "265,70 265,330 " fill = "none" stroke-width = "0.12" stroke-linejoin = "round" stroke = "rgb(0,168,235)" />
</g>
<g id = "M,HYDP,1">
<polyline points = "70,135 330,135 " fill = "none" stroke-width = "0.12" stroke-linejoin = "round" stroke = "rgb(0,168,235)" />
</g>
By using the unique format of “id”, we accomplish the connection between DLG and Map Symbol data. If we get the description of a map symbol with id=”M,HYDP,1”, we can also get its DLG data by searching the DOM tree with the id=”E,HYDP,1”.
The complete model of SVG encoding is as figure 6.
Figure 6. The model of DLGM’s SVG encoding
4. APPLICATION
Web map is a simple form of WebGIS. With the summary of DLG’s SVG encoding, we developed a concise web map application based on the local network. The application can be used by the local government.
The local government wants to browse and look up the 1:10000 map of a certain area online and inquire the attribute of the geographical features. There are 30 maps, each map is a DLGM dataset stored in MDB. According to those requirements, we developed the web map based on B/S structure. On the server side, we designed the system’s interface by CSS in a main html page then transformed the DLGM data into SVG and finally embed the SVG document in the main html page.
Users of the government can access to this web map application after inputting the URL in their browser. Figure 7 shows this application.
Figure 7. The web map based on DLGM
Since the map symbol data of DLGM is associated with its DLG, we can access the attribute information from operating the symbol data by using JavaScript. The specific methods are as follows:
1. Response the mouse clicks and find the feature being clicked on with its id information.
var g = evt.currentTarget;
var metadata = g.getElementByTagName(“id”); var contents = metadata.attributes;
2. Deal with the contents of the id label, change the letter “M” to “E” ,then we get a new id.
var newid = Convert(contents);
3.Traverse the SVG document to find the element of DLG data with the new id.
var entity = getElementById(newid);
4.Get the attribute information of the DLG data.
attribute = entity.getElementByTagName(“Attribute”); var text=attribute.attributes;
5. Show the attribute information.
var message=””;
for(var k=0;k<attribute.length;k++) {
var p=text.item(k);
alert(message);
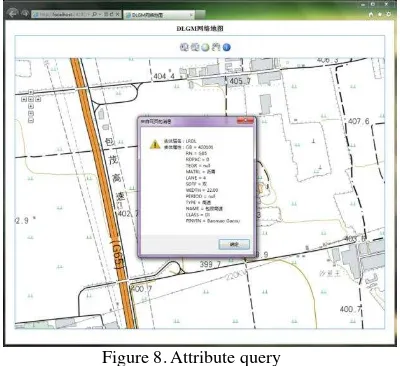
Figure 8 shows attribute query.
Figure 8. Attribute query
The application’s structure is simple and it is easy to realize. Each MDB of DLGM is about 30mb. It takes about 4 minutes to be converted into SVG format, its volume is about 12MB. Using local network, the speed of data transmission is relative fast which only takes a few time for the browser finishes data loading. For the application with data volume of 1:10000, the efficiency is high and the cost is low.
5. CONCLUSION
The paper analyzed the shortage of vector data in the current WebGIS application, introduced DLGM and its characteristics then indicated that DLGM can be used in the network environment. Based on the SVG standards, we provide
DLGM’s SVG encoding scheme. For applications based on local network or applications of small data volume, we can transport the map symbol data together with DLG data. This method allows some query or other interaction on the client, which will reduce the pressure of the server obviously. For applications with large data volume, we can just transport DLGM’s map symbol data, and leave the function of complex interaction, query and analysis on the server. Since DLGM data has such flexible data providing method in the network, it has opened up a new way for WebGIS.
REFERENCES
[1] United States Geological Survey. Standard for Digital Line Graphs. 1988. United States Geological Survey.
[2] Yin Z C, Li L. 2004 Based on network sharing portrayal model , International Conference on Geoinformatics and Modeling Geographical Systems & Fifth International Workshop on GIS.
[3] HARDY P, KRESSMANN T. 2005. Cartography , Database and GIS: Not Enemies, but Allies! , 22nd ICA Conference Proceedings.
[4] Chunju Liu. Dundun Shi. 2005. The Research and Realization of WebGIS Map Symbolization,”Bulletin of Surveying and Mapping.
[5] MacEachren, A. M. 1995. How maps work: Representation, visualization and design. New York, New York: Guilford Press.
[6] Wenzhong Wu, Xincheng Guo. 2011. An Introduction to National Fundamental Geographic Information Digital Product-Digital Line Graphs and Map. Bulletin of Surveying and Mapping, pp. 61-63.
[7] W3C SVG 1.1 Specification. 2011.
http://www.w3.org/TR/2011/REC-SVG11-20110816/. [8] ANS GKS X3H3/83-25r3. 1989. Computer Graphics,