WEB MAPPING FOR PROMOTING INTERACTION AND COLLABORATION IN
COMMUNITY LAND PLANNING
Bert Veenendaal a, Masego Dhliwayo a,b
a
Department of Spatial Sciences, Curtin University, Perth, Australia – [email protected]
bOkavango Research Institute, University of Botswana, Maun – [email protected]
Commission IV/5 – Web and Cloud Based Geospatial Services and Applications
KEY WORDS: Web mapping, Community planning, Spatial infrastructures, User interfaces, Online GIS, Collaborative mapping
ABSTRACT:
There is an inherent advantage of geographic information Systems (GIS) and mapping in facilitating dialogue between experts and non-experts during land use plan development. Combining visual mapping information and effective user interaction can result in considerable benefits for developing countries like Botswana. Although the adoption of information and communication technologies has lagged behind that for developed countries, initiatives by the Botswana government in providing suitable information infrastructures, including internet and web based communications, are enabling multiple users to interact and collaborate in community land planning. A web mapping application was developed for the Maun Development Plan (MDP) in the Okavango Delta region in Botswana. It was designed according to requirements of land planners and managers and implemented using ArcGIS Viewer for Flex. Land planners and managers from two organisations in Maun involved in the development of the MDP were asked to evaluate the web mapping tools. This paper describes the results of implementation and some preliminary results of the web mapping evaluation.
1. INTRODUCTION AND BACKGROUND
1.1 Introduction
Despite its often heralded benefits, the adoption of information and communications sytems, including geographic information systems (GIS) technology in developing countries like Botswana has been slower than that in developed countries (Nkambwe, 2002). Cavric et al. (2003) identified several factors responsible for what he called the inadequate diffusion of GIS technology, namely, lack of trained personnel, lack of or poor quality data, inappropriate use of or lack of technology, outdated or undeveloped infrastructure, complex institutional relationships and financial constraints. These factors, thus far, have curtailed the successful adoption and diffusion of GIS technology in land administration and land use planning.
The challenges for progressing land planning lie not only in the technology itself but also in the environment in which it is used. Visually mapping and displaying information and encouraging more effective interaction in a common environment can enhance development than would otherwise be possible using traditional consultation and communication methods (Appleton et al., 2002; Appleton & Lovett, 2003; Appleton & Lovett, 2005).
Technological changes in geospatial technology have evolved to make it easier to distribute large amounts of mapping data and information to users over the internet while allowing multi-sector collaboration to take place using applications with user friendly and easily customised interfaces. The following sections identify the user environment and technological challenges and then outline the research conducted in the Maun study region in Botswana to facilitate and enhance the land planning process.
1.2 User Environmental Factors
Environmental factors that have hampered the diffusion and adoption of information technology users include poor coordination and lack of collaboration resulting in duplication of services. This has been identified in the Botswana e-government strategy, a document that aims to, "accelerate Botswana's transition to a knowledge society, assuring the country's economic diversification and sustainable economic development", as the major cost drivers for government (Botswana Government, 2012). The strategy document has been described by Maleke (2013) as an important guide for government as it modernises the way it delivers services to citizens through the rolling out of major information technology initiatives.
It must be pointed out that although the e-government strategy document appears to be concerned with the state of information and communication technology in general, it still indirectly addresses the problems underlying the implementation of geospatial technologies in local and central government agencies especially in the administration of land and its planning.
For Botswana in particular, Nkambwe (2002) highlighted the fact that increasing population density and rapid developments in urban, peri-urban areas and large villages, is causing an intensive demand for land parcels. This high demand for land in turn places local authorities responsible for planning and controlling development under pressure for their services. Nkambwe (2002) further argued that in order to deal with this pressure, planners require spatial information and better land information systems to enable them to make appropriate decisions and resolve disputes.
International Archives of the Photogrammetry, Remote Sensing and Spatial Information Sciences, Volume XL-4/W2, 2013 ISPRS WebMGS 2013 & DMGIS 2013, 11 – 12 November 2013, Xuzhou, Jiangsu, China
Obermeyer & Pinto (2007) argue that, as a result of web- based technology, enhanced information sharing should lead to several desired outcomes that various organisations seek, which are efficiency, effectiveness and improved decision-making ability. They assert that greater internal efficiency of operations for each agency is realised when one organisation is able to make direct contact with another that possesses needed information, thereby reducing the likelihood of replication of efforts in creating databases.
When communities are actively engaged with collecting and accessing information about their local geographic region, they inherit a knowledge that exceeds the previously fragmented and incomplete view of their community. Mulalu & Veenendaal (2011) successfully implemented such an approach in a rural community in the Kalahari in Botswana for the purposes of community development.
1.3 Technological Factors
Modern web-based technology requires good internet connectivity in order to work seamlessly. The current Botswana government internet connectivity may generally be described as poor. The country is currently ranked 96th out of 144 economies in terms of networked readiness. The ranking is based on each country's capacity to exploit the opportunities offered by information and communication technologies (ICTs) for enhanced competitiveness and well-being (WEF, 2013). This low ranking is influenced by the insufficient level of infrastructure development and its lack of affordability among other factors. However, it is expected to improve in speed, reliability and become more affordable and easier for users to access web-based services as a direct outcome of the country's substantial investment in information technology infrastructure (BOPA, 2012; Tebogo, 2013).
The country has invested in multi-lateral under-sea cable laying initiatives such as the East Africa Submarine Cable System (EASSY, 2010) and the West Africa Cable System (WACS, 2010). Such initiatives provide an opportunity for developing countries to develop internet based services with the aim of improving the delivery and effectiveness of services to citizens. Additionally, the government recognises the shortcomings of its internal infrastructure and intends to specifically upgrade the Government Data Network (GDN) (Botswana Government, 2012).
Obermeyer and Pinto (2007) narrate a situation whereby they visited a government office and were shown a computer, on which a popular GIS product had been installed, set aside and gathering dust while members of the department continued to make zoning and public works decisions by using paper maps and old charts. The reason given for the non-use was that because the computer monitor was broken, the department had not much use for GIS. According to the authors, this was a perfect illustration of lack of system acceptance, and it is a scene that would most probably be replicated in many government physical planning and land administration offices in Botswana. It relates to the non-use of technology as a direct outcome of it not being adopted by the intended users.
Veenendaal and West (2011) outline a number of projects where improved knowledge and decision-making capacity resulted from better information and access via the web to data and services. However, it is not just data that adds value to the
decision-making process, but also better and timely interaction between relevant persons and communities at locations of interest.
Geospatial applications in the past tended to focus more on functionality and the user interfaces were complex and not user friendly. It is understood that interface design may influence technological acceptance and therefore improve productivity of users (Masó et. al., 2011). The lack of user friendly interfaces may also have played a part in intimidating users and curbing enthusiasm for wider adoption of the technology. Angelaccio et. al. (2009) have proposed adaptive user interfaces that "can satisfy the needs of different users, adapt to their level of knowledge of geographical information systems, and deliver the information in the form that is understandable and immediately usable by the user". This can be achieved by activating the required user interface with specific functionalities adapted to the specific requirements of use and the user.
Angelaccio et. al. (2009) criticise current user interfaces for being static and not adaptive, with complex structures that make the use of such systems a complex task requiring specific expert knowledge. Perhaps this is more clearly put by Goodchild (2011) who decries the desktop user interfaces currently in use for having, "...confusing functionality, poorly defined, and lacking in any conceptual framework or organisational structure."
1.4 Objectives of the Study
The overall aim of this study is to enhance the usability and collaboration among planners and managers for the purposes of land use planning. The target area chosen for this work was a geographic area within the Okavango Delta region in Botswana.
In order to enhance the land planning process in Botswana, this research focussed on developing an online web mapping tool that would assist stakeholders involved in the planning process to easier access data, interact with information and collaborate with each other.
The first step of this study was to understand the historic and current environment that has led to the planning process as it presently exists. The next step was to identify the needs and then design and develop a web mapping tool that multiple stakeholders can relate to and integrate in their respective workflows. Thirdly, this web mapping tool needs to be tested and evaluated in the context in which it is to be utilized in the land planning process.
In order to address the objectives of this study, a GIS application was developed and customised to accommodate the local government officers' activities. A preliminary survey of the users' experiences with the interface of the application and its tools was conducted and interpreted in order to investigate whether they experienced improved access to information, were able to operate the web map interface productively and whether there was improved potential for collaboration between users.
2. METHODS AND STUDY AREA
2.1 Approach to Integrate Information and Users
In preparation for designing and implementing the web mapping tool, the history and context of the existing process for
International Archives of the Photogrammetry, Remote Sensing and Spatial Information Sciences, Volume XL-4/W2, 2013 ISPRS WebMGS 2013 & DMGIS 2013, 11 – 12 November 2013, Xuzhou, Jiangsu, China
land planning needs to be understood. This then will inform the design and expected usage of the web mapping tool.
The following section outlines the nature and architecture of the Okavango Delta Information System (ODIS). The ODIS is the existing geospatial infrastructure that brings together information from a variety of sources into a GIS to be utilised by various users involved in the management, operations and planning for the Okavango Delta in Botswana. Maun is a town located towards the southern end of the Delta and was chosen as the study area for the web map and its use in the planning process; this is outlined in a following section.
2.2 ODIS System Architecture
In 1997, the Okavango Delta in Botswana was identified as a Ramsar Convention on Wetlands (or simply Ramsar) site and is currently considered the world’s largest Ramsar site (Kabii, 2013). Following its listing, a plan to manage the use of the delta in a sustainable manner was developed (Dea, 2008). It was during the preparation of the Okavango Delta Management Plan (ODMP) that a customised desktop-based GIS application called the Okavango Delta Information System (ODIS) was first established with the intention to provide access to key datasets of the Okavango Delta through a map interface (Scanagri, 2004).
ODIS was initially designed to be a spatial data infrastructure (SDI) tool (Thorn, 2005; Combs, 2012) bringing together information from stakeholders within one administrative district into a shared central repository. It was housed at the University of Botswana’s Okavango Research Institute (ORI) GIS lab from where it was then distributed or made available to other users.
The ODMP process dovetailed with the vision of ORI to establish a regional Okavango Basin Data Centre to serve as a repository and retrieval hub. The centre was to provide tools for documenting, storing, searching, and distributing scientific data and images to facilitate research and information sharing about the Okavango and its environs whilst being linked to other regional and global data repositories (Scanagri, 2004).
Through the use of maps, issues such as Human Wildlife Conflict (HWC) hotspots (for example, where farms had been located along pathways regularly used by elephants) were easily highlighted and there was some collaboration by central and local government institutions mandated to look after various resources in the district (Vanderpost & Oppenheimer, 2008). These institutions included non-government organisations (NGOs), community-based organisations (CBOs) and commercial interests who had a common interest in the continued thriving of the Okavango Delta. ODIS assisted in raising awareness about the need for the sharing of information amongst stakeholders of the Delta. However, this information pooling and culture did not continue as expected.
Although ODIS operated a very simple but efficient workflow in which data and information were received and shared using storage media such as compact discs and external storage drives, a significant amount of time was required in training users to be able to use it (Scanagri, 2004). Geospatial applications in the past tended to focus more on function and user interfaces, and were complex and not user friendly. The lack of user friendly interfaces may also have played a part in intimidating users and curbing enthusiasm for the wider adoption of the technology.
Further, if a government officer who had been involved and trained left their post, their replacement would require training in ODIS to rebuild the expertise that was lost. However, training was not always possible due to resource constraints. Hence, new officers taking up jobs in the district offices did not appreciate the on-going informal collaborative culture that had prevailed prior to their arrival.
2.3 The Maun Study Area
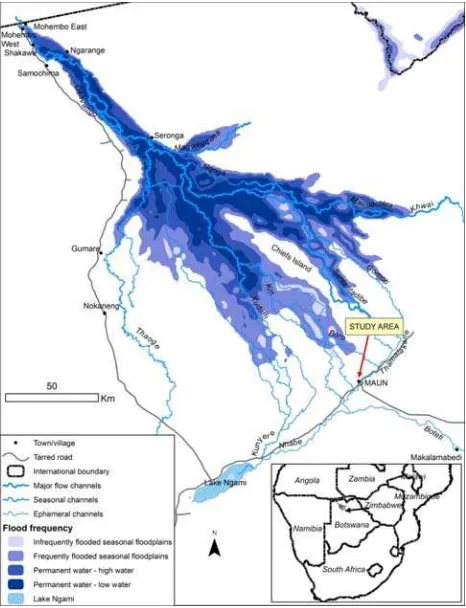
The study area chosen as the focus of this research was the town of Maun located at (E 23.3961, S 20.0467) decimal degrees in the North West administrative district of Botswana (Figure 1). The most recent population of Maun was 60,263 as at the 2011 census (CSO, 2011). This was a growth rate of 21% since the previous census reading of 49,822, a decade earlier.
Figure 1. Study area around Maun on southern end of Okavango Delta Basin
The main local authorities responsible for land planning, development and administration in Botswana are district councils and land boards. The Tawana Land Board (TLB) is primarily responsible for allocating and managing land in the Maun region and is overseen by the Department of Land Board Services (MLH, 2008). On the other hand, the North West District Council (NWDC) is tasked with the orderly development of land under the Town and Country Planning Act (TCPA) of 1977, and is responsible for land use planning and development control in Maun. The NWDC operates under the policy directions of a central government entity called the Department of Town and Regional Planning (DTRP) which is mandated to ensure the orderly spatial development of the whole country (MLH, 2008). Both are departments of the Ministry of Lands and Housing and are obliged to consult with
International Archives of the Photogrammetry, Remote Sensing and Spatial Information Sciences, Volume XL-4/W2, 2013 ISPRS WebMGS 2013 & DMGIS 2013, 11 – 12 November 2013, Xuzhou, Jiangsu, China
each other in their work by the laws controlling them (MLH, 2008).
For settlements that have been declared 'planning areas' by the relevant minister, the DTRP oversees the preparation of physical settlement development plans and their
implementation through application of instruments such as the Urban Development Standards and the TCPA as previously stated (MLH, 2008). The TLB on the other hand, administers land under Tribal Land Act of 1970, which also empowers it to perform some form of development control. In reality, the responsibilities of these bodies actually overlap and may give rise to power conflicts and duplication of services.
2.4 Renewing the collaborative process
Given the need to rebuild the collaborative culture and the developments in web mapping technology and infrastructures, a web mapping tool was designed and developed for use within the ODIS architecture (Figure 2). The Maun Development Plan (MDP) was selected as the focus of the web map. The development plan is essentially a blue print that guides existing and future developments in Maun and its implementation demands closer collaboration between multi-sectoral local government entities.
Figure 2. Proposed ODIS Architecture providing access to multiple external users via Internet browser web mapping
Following the recent the adoption of the revised Maun Development Plan (MDP) (1997-2021) by the TLB and NWDC, the only way the community of Maun could have access to the plan was by physically visiting the offices of the two local government offices and other designated display points. These two government departments are responsible for ensuring orderly spatial development of the town through implementation of the plan.
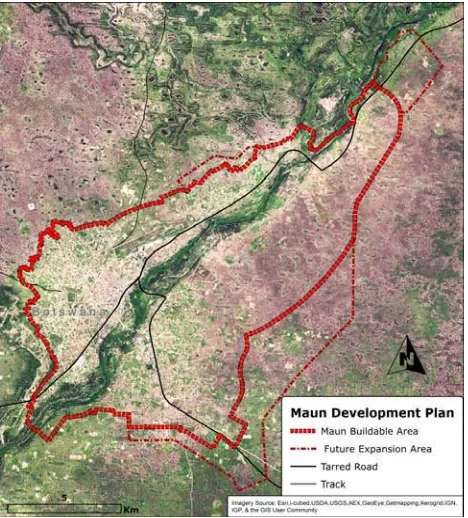
Prior to the adoption of the MDP, development proposals were displayed at designated public places for public comment and access to the development plan was limited for both the public and the officers responsible for implementing it. The current location and extent of the MDP is indicated in the map in Figure 3.
For this research, the two main organisations responsible for the MDP were selected as the stakeholders whose needs would guide the design of the web map. These stakeholders are also used to assist in evaluating the effects and impact of the web map to enhance collaboration regarding the planning process
for the MDP. This paper outlines particularly the design, development and some preliminary remarks regarding the evaluation of the web mapping tool.
Figure 3. Boundaries and extent of Maun Development Plan
3. WEB MAPPING DESIGN AND DEVELOPMENT
3.1 Web map design criteria
Noting the short attention spans and high expectations of web users, Buckley (2012) suggests that a web map should "not only display quickly, but its functions should respond rapidly and its purpose should be immediately understood". She argues that maps should possess a high level of graphic and information clarity so that the users can easily decide whether what they are viewing is of immediate and personal use to them.
Other design considerations include the size of the map on the primary delivery mode, for example, whether the map will be viewed on an LCD screen or mobile devices such as tablets and smart phones. One also needs to consider whether or not to restrict the geographic extent, use appropriate scale, symbols, fonts and colours for on screen viewing, as well as ensuring that the same coordinate systems are used for all datasets.
Finally, it is important to decide on the design of the map and its marginalia (titles, legends, scale bars and text, as well descriptive information about the map itself). The look-and-feel of the map should match the user experiences and expectations as much as possible, so that the information they are seeking or exploring is where they would expect it to be.
Veregin & Kennedy (2012) caution that, in the absence of training, web map users are expected to gain a certain level of self-sufficiency when using an online map application, since there is no human expert to assist them. Their argument was that if the users do not receive sufficient training, it may still be possible that "levels of user satisfaction and success in
International Archives of the Photogrammetry, Remote Sensing and Spatial Information Sciences, Volume XL-4/W2, 2013 ISPRS WebMGS 2013 & DMGIS 2013, 11 – 12 November 2013, Xuzhou, Jiangsu, China
information gathering will decline despite the power of the new technological means" (Veregin & Kennedy, 2012).
The map properties, layouts and structure of the maps currently used by land managers and planners at both the TLB and NWDC organisations in Maun were identified and used as a basis for the design and layout of the online web map. In this way, users would be familiar as much as possible with the online web mapping tool in comparison to the layout and structure of the paper and GIS maps which they were currently used to working with. At the same time, the web maps had to display only what information was necessary when and where needed as the users interact with it.
3.2 MDP Web Mapping Implementation
The Maun Development Plan online application was set up on a Dell 2950 PowerEdge application server after installation of the Adobe Integrated Runtime (AIR) application builder. The server is currently also being used to publicly serve the existing Okavango Delta Information System (ODIS). The Adobe Flex viewer deploys the Adobe Flash plug in that is already available in many clients' desktop computer browsers.
ArcGIS Viewer for Flex has been described as a ready to deploy and easily extensible viewer application that allows configuration and easy adding of data and tools without the need for extensive programming skills (Esri, 2013). The content for the viewer is maps and data that have been published into map and feature web services, as well as geoprocessing tasks.
A geodatabase was created and the MDP shapefiles were loaded into it using ArcGIS for Desktop. The resulting map was published into a map service using ArcGIS for Server without changing any symbology or editing the layers.
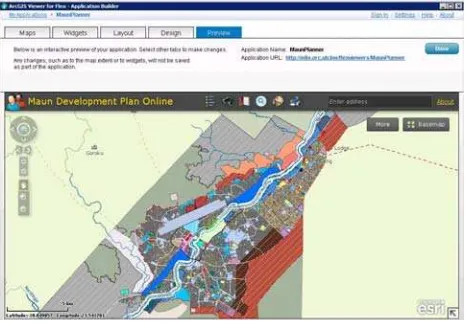
After installation of the application builder, it was configured in a 4 step process involving: 1) selection of base maps, 2) widget selection for map manipulation and processing functions, 3) choosing the layout and design of the interface, and 4) previewing and evaluating the final look and feel of the tool as a whole (Figure 4).
Figure 4. Web map implementation process
The application was then subjected to additional testing in order to ensure that it would function as expected. Some reconfiguration of widgets and refocusing of the map extents to show the full buildable and expansion areas was found to be
necessary. Further tests were done to check how the application would perform outside the University of Botswana network and this was found to be satisfactory.
3.3 User Evaluation
To provide some initial evaluation of the MDP web mapping tool, a number of users from both the TLB and NWDC organisations were exposed to the interface and requested to comment on its ease of use and functionality. This would then provide some preliminary analysis on the interface and functionality to enable the tool to be reviewed and revised as necessary.
4. RESULTS AND DISCUSSION
4.1 Developed web mapping interface and tool
The resulting MDP web mapping tool interface is illustrated in Figure 5. The map is representative of the paper-based and GIS-based maps that planners and managers have used in their respective TLB and NWDC organisations. The interface is relatively simple with the interaction and functionality icons displayed above the map portion of the window. The map manipulation tools involving zooming, panning, etc. are icons familiar to the land planners and managers, and the equivalent mouse-based (eg. point and click) functionality is commonly utilised in GIS and online mapping applications such as Bing Maps and Google Maps.
Figure 5. Online MDP web mapping interface
In keeping with the principle of having as simple an interface as possible, only six (6) widgets were included in the application tool, namely: generating a legend, searching by location or attribute, creating bookmarks, running a predefined query, drawing graphics on the map and printing a map. It was also decided to maintain the same colour scheme on the paper version of the development plan maps so that the intended users would spend less time trying to match symbols to a legend.
The configuration of the MDP Online viewer was found to be relatively straightforward and was completed without much troubleshooting required. This is partly due to the fact that some of the required components for the ArcGIS Viewer for Flex Application Builder were already installed and available on the ODIS server.
This tool was used to demonstrate that by sharing resources, the University of Botswana, which hosted the application, could
International Archives of the Photogrammetry, Remote Sensing and Spatial Information Sciences, Volume XL-4/W2, 2013 ISPRS WebMGS 2013 & DMGIS 2013, 11 – 12 November 2013, Xuzhou, Jiangsu, China
use significantly less resources than if multiple organisations had to achieve the same outcomes independently. By utilising the tool for the benefit of the TLB and NWDC, these two organisations could also benefit from the same resource, simply by accessing it via the web. Hence, a common information and mapping platform for the development of the MDP was achieved using a cloud-based geospatial infrastructure.
4.2 Evaluating the use of the web mapping MDP
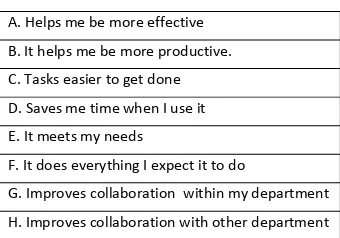
The MDP web mapping tool was evaluated by six (6) users from each of the TLB and NWDC. The users included both planners and managers within the two organisations. The participants used the tool in relation to queries and tasks that were familiar to them in their normal course of work. They were then asked to respond to their experiences in relation to eight (8) criteria used to evaluate their use of the web mapping tool (Table 1).
Table1. Evaluation criteria used for the MDP web mapping application
A. Helps me be more effective
B. It helps me be more productive.
C. Tasks easier to get done
D. Saves me time when I use it
E. It meets my needs
F. It does everything I expect it to do
G. Improves collaboration within my department
H. Improves collaboration with other department
The overall response of the users was very positive to the interface. All could utilise it to produce information and achieve outcomes regarding some relatively basic tasks. The majority of them, namely 90%, indicated that they found the application useful. Figure 6 indicates the responses for each of the criteria which they were asked to evaluate. Not only could they relatively easily use the tool to achieve tasks in a shorter period of time, but the majority indicated that they could use it to improve collaboration among colleagues within their department, and others that are involved in the land planning and use process within and external to their organisation.
Figure 6. User perceptions on usefulness of MDP web mapping application
It is interesting to note that one-third of users highlighted the fact that the web mapping application did not do everything
they expected it to. This is partly because not all functionality that they were accustomed to was implemented in the application at this point in the research stage. However, this also appears to indicate that the users felt confident with the use of the tool, were able to achieve known tasks more efficiently, and wanted to do more either according to or beyond existing tasks.
5. SUMMARY AND CONCLUSIONS
In order to enhance access, interaction and collaboration for the purposes of land use planning, a web mapping application was designed and implemented for land planners and managers across two organisations in Maun. A preliminary evaluation of its effectiveness was conducted to inform further directions and research.
A first design of the web mapping interface and functionality was successfully implemented. Planners and managers from the two organisations used in this study indicated their positive acceptance of the tool. Preliminary results indicate that the tool was easy to utilise and assisted in more efficiently carrying out tasks in their normal workflows.
The development of the web based mapping application in a cloud-based environment enabled land planners and managers across multiple organisations to obtain common access to the information and functionality required in the development of the MDP for Maun. In fact, a ‘mini’ spatial data infrastructure was achieved which arose out of the collaboration during the ODMP planning process and the original intentions underpinning the ODIS. As the preliminary user evaluation showed, this shared application provides a springboard for increased interaction and collaboration.
Further extensive surveys need to be conducted among users of the two organisations, to evaluate the use of the web mapping application in more detail. This will then inform the review and revision of the tool and its use within the organisations. This can then be expanded to include more organisations and workflows involving more data and GIS functionality in relation to the Okavango Delta Information System.
REFERENCES
Appleton, K. & Lovett, A., 2003. GIS-based visualisation of rural landscapes: defining ‘sufficient’ realism for environmental decision-making. Landscape and Urban Planning, 65, 117-131.
Appleton, K. & Lovett, A., 2005. GIS-based visualisation of development proposals: reactions from planning and related professionals. Computers, Environment and Urban Systems, 29, 321-339.
Appleton, K., Lovett, A., Sünnenberg, G. & Dockerty, T., 2002. Rural landscape visualisation from GIS databases: a comparison of approaches, options and problems. Computers, Environment and Urban Systems, 26, 141-162.
Angelaccio, M., Krek, A. & D’ambrogio, A., 2009. A Model-driven Approach for Designing Adaptive Web GIS Interfaces. In: Popovich, V., Claramunt, C., Schrenk, M. & Korolenko, K. (eds.), Information Fusion and Geographic Information Systems. Springer Berlin Heidelberg.
International Archives of the Photogrammetry, Remote Sensing and Spatial Information Sciences, Volume XL-4/W2, 2013 ISPRS WebMGS 2013 & DMGIS 2013, 11 – 12 November 2013, Xuzhou, Jiangsu, China
BOPA, 2012. Molefhi launches West Africa Cable System (WACS). BOPA.
Botswana Government, 2012. Botswana National E-Government Strategy 2011-2016. Ministry of Transport & Communications, Botswana.
Buckley, A., 2012. Designing Great Web Maps. Esri, http://www.esri.com/news/arcuser/0612/designing-great-web-maps.html (25 May 2013).
Cavric, B., Nedovic-Budic, Z. & Ikgopoleng, H. 2003. Diffusion of GIS technology in Botswana: Process and determinants. International Development Planning Review, 25, 195-219.
CSO, 2011. Botswana Population and Housing Census. Census Botswana 2011, Central Statistics Office, Botswana.
DEA, 2008. An introduction to The Okavango Delta Management Plan. Department of Environment Affairs, Maun, Botswana,
http://www.orc.ub.bw/downloads/ODMP_folder_English.pdf (26 Jun 2013).
EASSy, 2010. EASSy: Closing the final link. EASSy, Nairobi, Kenya, http://www.eassy.org/map.html (3 Jun 2013).
Esri, 2013. ArcGIS Resources: ArcGIS Viewer for Flex. ESRI, California, http://resources.arcgis.com/en/help/flex-viewer/concepts/index.html#//01m300000015000000 (15 Jul 2013).
Goodchild, M.F., 2011. Spatial Thinking and the GIS User Interface. Procedia - Social and Behavioral Sciences, 21, 3-9.
Kabii, Tom, 2013. Okavango – the world’s largest Ramsar site. The Ramsar Convention on Wetlands, Switzerland, http://www.ramsar.org/cda/en/ramsar-news-archives-1997-okavango-world/main/ramsar/1-26-45-92%5E17902_4000_0__ (6 Sep 2013).
Maleke, L., 2013. Molefhi bemoans low internet access. Mmegi Online, 12 Apr 2013.
Masó, J., Pons, X. & Zabala, A., 2011. Tuning the second-generation SDI: theoretical aspects and real use cases. International Journal of Geographical Information Science, 26, 983-1014.
MLH, 2008. Policies and Legislation. Ministry for Lands &
Housing, Botswana, http://www.mlh.gov.bw/index.php?option=com_revenue (26
Jun 2013).
Mulalu, M. & Veenendaal, B., 2011. PGIS Supported Knowledge Based Participation and Evidences of Empowered Community Members. Proceedings of ISDE 7th International Symposium on Digital Earth, Aug 23, 2011, Perth, Australia,
http://espace.library.curtin.edu.au/cgi-bin/espace.pdf?file=/2012/02/17/file_1/172463 (6 Sep 2013).
Nkambwe, M., 2002. Land information Systems Development and the National Spatial Data Infrastructure in Botswana. ISPRS Archives, ISPRS Commission VI Workshop - Developments and Technology Transfer in Geomatics for
Environmental and Resource Management, Dar es Salaam, Tanzania, 25-28 March.
Obermeyer, N.J. & Pinto, J.K., 2007. Managing Geographic Information Systems. New York, Guilford Press.
Scanagri, 2004. Requirements of the Okavango Delta Information System (ODIS). Scanagri Denmark A/S, prepared for Botswana Government.
Tebogo, T., 2013. BTC reduces internet products prices. Botswana Daily News, 27 Feb 2013.
Vanderpost, Cornelis & Oppenheimer, Harry, 2008. Integrated data for integrated planning of the Okavango Ramsar site: challenges and prospects. Okavango Research Center,
University of Botswana, http://www.aag.org/galleries/gdest/Van_der_Post.pdf (6 Sep
2013).
Veenendaal, Bert & West, Geoff, 2011. Transforming location intelligence through geospatial web-based technologies. 2nd ISPRS Workshop on Pervasive Web Mapping, Geoprocessing and Services: Our Complex World, 10 August, Simon Fraser University, British Columbia, Canada.
Veregin, H. & Kennedy, T., 2012. Online Information Dissemination at the Wisconsin State Cartographer’s Office Using Map Services and APIs. In: Peterson, M. P. (ed.), Online Maps with APIs and WebServices. Springer Berlin Heidelberg.
WACS, 2010. WACS: West Africa Cable System. Tata Communications Ltd, http://www.wacscable.com/index.jsp (3 Jun 2013).
WEF, 2013. The Global Information Technology Report 2013. In: Bilbao-Osorio, B., Dutta, S. & Lanvin, B. (eds.), World Economic Forum.
International Archives of the Photogrammetry, Remote Sensing and Spatial Information Sciences, Volume XL-4/W2, 2013 ISPRS WebMGS 2013 & DMGIS 2013, 11 – 12 November 2013, Xuzhou, Jiangsu, China