CONTRIBUTION OF THE NEW WORLDVIEW-2 SPECTRAL BANDS FOR URBAN
MAPPING IN COASTAL AREAS: CASE STUDY SÃO LUÍS ( MARANHÃO STATE,
BRAZIL)
Ulisses D. V. Souza a, Hermann. J. H. kux a,
a
INPE - National Institute for Space Research
, Avenida dos Astronautas, 1758 - Jardim da Granja, 12.227-010 São José dos Campos – SP, Brazil. ([email protected], [email protected])Commission IV/3: Mapping from High Resolution Data
KEY WORDS: WorldView-2; High resolution images; Urban areas; Coastal zone; São Luis; Maranhão State.
ABSTRACT:
The objective of this study is to verify the contribution of the spectral bands from the new WorldView-2 satellite for the extraction of urban targets aiming a detailed mapping from the city of São Luis, at the coastal zone of Maranhão State, Brazil. This satellite system has 3 bands in the visible portion of the spectrum and also the following 4 new bands: Coastal (400-450 nm), Yellow (585-625 nm), Red Edge (705-745 nm), and Near Infrared 2 (860-1040 nm). As for the methodology used, initially a fusion was made among the panchromatic and the multispectral bands, combining the spectral information of the multispectral bands with the geometric information of the panchromatic band. Following the ortho-rectification of the dataset was done, using ground control points (GCPs) obtained during field survey. The classification reached high values of Kappa indices. The use of the new bands Red Edge and Near Infrared 2, allowed the improvement of discriminations at tidal flats, mangrove and other vegetation types. The Yellow band improved the discrimination of bare soils – very important information for urban planning – and ceramic roofs. The Coastal band allowed to map the tidal channels which cross the urban area of São Luis, a typical feature of this coastal area. The functionalities of software GEODMA used, allowed an efficient attribute selection which improved the land cover classification from the test sites. The new WorldView-2 bands permit the identification and extraction of the features mentioned, because these bands are positioned at important parts of the electromagnetic spectrum, such as band Red Edge, which strongly improves the discrimination of vegetation conditions. Combining both higher spatial and spectral resolutions, WorldView-2 data allows an improvement on the discrimination of physical characteristics of the targets of interest, thus permitting a higher precision of land use/land cover maps, contributing to urban planning. The test sites of this study represent the main problem areas involving the city of São Luis and the entire region of the Maranhão Island.
1. INTRODUCTION
With the advancement of remote sensing technologies and the availability of sensor systems with improved spatial and spectral resolution new applications became possible (Ehlers, 2007).
After data from satellite WorldView-II, launched in October 2009, became available, detailed analysis of coastal urban areas are possible, considering the high spatial resolution (0.46m in the panchromatic band and 1.84m in the multispectral bands).
In order to work with these huge datasets, new methodologies were tested and applied. OBIA (Object-based image analysis) is a new paradigm considered for the classification of land cover in urban areas based on images with very high spatial resolution (BLASCHKE & KUX, 2007).
The area under study, located at the northern section of Maranhão Island presents a diversity of coastal habitats, such as: mangroves, cliffs, beaches and tidal flats (so-called “apicum”) which need a frequent monitoring because these are environmental protection areas sensitive to changes by human activities.
The objective of this work is to analyze and test the 8 multispectral bands of WorldView-II satellite to identify and extract typical features of this coastal and urban environment. This satellite system presents 3 bands in the visible spectrum and 2 in the near infrared, besides four new bands: Coastal
(400-450 nm), Yellow (585-625 nm), Red Edge (705-745 nm), Near Infrared 2 (860-1040 nm) (DIGITALGLOBE, 2010a). The four bands mentioned, located at specific sections of the electromagnetic spectrum, increase de discrimination capacity and the analysis of targets under study (Figure 1).
Figure 1 – Spectral response of Worldview II bands. Source: Digital Globe (2010b)
Souza et al., (2011) performed tests to improve the discrimination of vegetation types at coastal areas, such as mangroves and tidal flats (so-called “apicuns”) using the new WorldView-2 bands. Applications of these bands as well as proposals of methodologies for its analysis, including spatial data analysis and OBIA, are found in Kerr (2011) and Vaduva (2011).
1.1 Image fusion
The fusion of panchromatic with multispectral WorldView-2 scenes was done using the Principal Components method, resulting in an image with 0.50 m spatial resolution.
1.2 Orthorectification
The orthorectification was made using the 3D rational polynomial method (TOUTIN, 2004) and the software package PCI Geomatics v10.3.1, considering 55 GCPs for the entire area under study. The GCPs used for the geometric rectification were obtained during a field campaign in August 2011.
1.3 InterIMAGE
InterIMAGE is a knowledge-based free software for image interpretation. It was developed in the frame of a cooperation project between INPE, the Brazilian National Institute for Space Research, the Laboratory for Computer Vision of the Catholic University of Rio de Janeiro (PUC-RJ), and the Leibniz University of Hannover (Germany). According to COSTA et al. (2010), its knowledge structure, design and control mechanisms were inherited from the German system GeoAIDA (BÜCKNER et al., 2001), which consists of a further development from AIDA (Automatic Image Data Analyzer).
According to RIBEIRO (2010) the most important characteristics of InterIMAGE are its flexibility for the interpretation of multi-sensor images, the reduction of computer processing time and the load for the image analysis (Figure 2).
The most recent version of InterIMAGE can be downloaded at link http://www.lvc.ele.puc-rio.br/projects/interimage/. Among other operators for object extraction it contains: a segmenter from Baatz, the Checkerboard, a classifier by decision trees, an importer for vector files, topologic attributes which can be used at the decision rules of Top-Down and Bottom-Up operators (COSTA et al., 2010).
Figure 2- Components of the analysis process. Source: Adapted from RIBEIRO (2010)
2. AREA UNDER STUDY
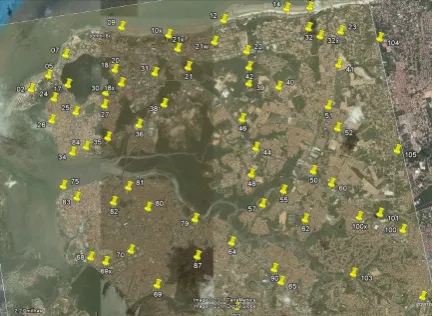
The area under study is part of the Maranhão Island, NE Brazil, encompassing 831.7 Km² (Figure 3).
At the northern section of São Luis municipality there are fragile geologic structures of Quaternary age, which eases landscape changes by relief modeling agents of climatic, hydrologic and oceanographic origin. A detailed description of this area is found in SOUZA & FEITOSA (2009) and GERCO (1998).
Figure 3 – Localization of test site
Source: Adapted from WorldView-2 image dated July 10th 2010.
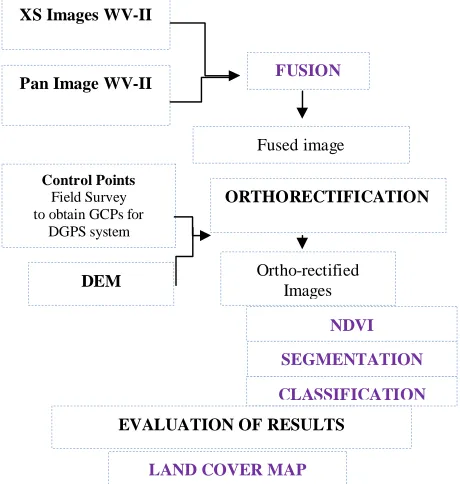
3. METHODOLOGY
The main methodological steps are presented in the flow diagram at Figure 4:
Figure 4 – Methodological steps XS Images WV-II
Pan Image WV-II FUSION
Fused image
ORTHORECTIFICATION
Ortho-rectified Images
Control Points
Field Survey to obtain GCPs for
DGPS system
DEM
NDVI
CLASSIFICATION
EVALUATION OF RESULTS
LAND COVER MAP XANALYSISANALYSISpat
SEGMENTATION
Materials used:
1) Scenes from WorldView-II sensor obtained in June 10th 2010, with off-nadir angle 16º and 11 bits radiometric resolution, delivered by DIGITALGLOBE.
2) Vector files of blocks in the databank of São Luis, from the city planning agency.
3) GCPs collected during Field survey in August 2011 with TOPCON Hiper L GPS geodetic equipment.
4) Contour lines in vector format, 1 m equidistance of contours, for the São Luis region.
The following software was used for image processing: ENVI 4.7 (ITT, 2009), for fusion and preparation of both test sites: PCI Geomatics V10.3.1 (PCI Geomatics, 2010) to work with the Digital Elevation Model and control points, followed by WorldView-2 image orthorectification, InterIMAGE v1.27 (InterIMAGE 2010) and GeoDMA for the exploratory analysis of image attributes and land cover classification.
Ortho-rectification was performed in order to correct for image distortions. In order to accomplish this task, Ground Control Points were collected using a DGPS (Differential Global Positioning System). The GCPs were collected on the entire scene (Figure 5).
The NDVI was used routinely to calculate the relation NIR - RED/NIR + RED for the determination of vegetation covered areas according to ROUSE et al (1974).
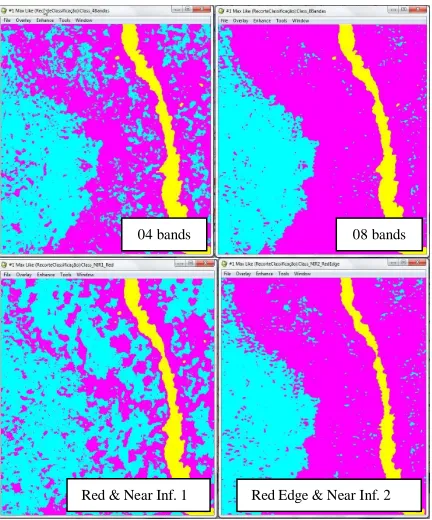
In order to evaluate the performance of the additional bands from WorldView-II, image classications were made with the following procedure:
Considering only the four bands corresponding to those found at most high resolution satellites, namely blue, green, red and near infrared;
Including all 8 bands of WorldView-II;
Using only bands Red and Near infrared 1 to demonstrate the capacity for vegetation discrimination of those bands available traditionally;
Inserting bands Red edge and Near infrared 2, to demonstrate the capacity for target discrimination at these new spectral bands;
Testing bands Coastal, Yellow and Red Edge on decision rules to improve class separability.
By visual classification, confusion matrices were tabulated for each of the above mentioned classifications, and the respective Kappa indices calculated.
Figure 5: Distribution of GCPs in the area under study.
4. RESULTS
One of the most important results indicates that Red Edge (705-745nm) band is sensitive to different spectral behaviour of vegetation types, which can be due to its localization on the electromagnetic spectrum corresponding to the end of absorption of wavelengths red and beginning of infrared by vegetation. So it is interesting to calculate the NDVI using this band instead of the red one, which is normally used.
Figure 6 shows the NDVI images from the area under study using both Red and Near infrared 1 bands as well as Red Edge and Near Infrared 2. Analyzing visually these images, enhanced by a color scale where the lowest NDVI values are in blue and the highest in red tones, one verifies the capacity of the new WorldView-II bands to differentiate vegetation types Semi-evergreen Tropical Forest (A) and mangrove (B). For further details see SOUZA et al. (2011).
Figure 6: NDVI images from area under study: (A) Semi-evergreen Tropical forest, (B) Mangrove.
An analysis was made to quantify the improvement by the new WorldView-II bands mentioned, based on four classifications in the area under study and considering the respective confusion matrices compared to a visual reference classification and the Kappa indices for each classification (Figure 7).
Red & Near Inf. 1 Red Edge & Near Inf. 2 International Archives of the Photogrammetry, Remote Sensing and Spatial Information Sciences, Volume XXXIX-B4, 2012
Figure 7: NDVI from the area under study.
At Figure 7 one perceives that the classifications with the eight WorldView-II bands and with the Red Edge and Near Infrared 2 bands improve the discrimination of targets, if comparing to the use of only bands red, green, blue and infrared common at other high spatial resolution systems or only using the red and near infrared bands, considered at the conventional NDVI calculation.
The quality improvement of classifications using WorldView-II data was quantified by the calculation of the Kappa indices of classification, according to Table 1.
TABLE 1: Kappa indices of classifications.
Classification Kappa (k) index
4 bands 0.6481
8 bands 0.8927
Red and Near infrared 1 0.3478
Red Edge and Near infrared 2 0.8471
According to the Kappa indices, the worst classifications are those using only bands Red and Near infrared (0.3478) as well as the four traditional bands (0.6481). The low performance of these classes can be due to the similar spectral response of vegetation types at these bands and to the improved performance of classifications with eight bands (0.8927) and with channels Red Edge and Near infrared 2 (0.8471).
The classification with Red Edge and Near infrared 2, although it presents a lower performance when compared with the 8 bands classification, is computationally much more faster, specially when large areas are mapped, taking into account that high resolution images demand much memory and processing capacity.
The use of attributes of the new WorldView-II spectral bands were implemented at the software package InterIMAGE, allowing the classification of large areas. The performance of bands Coastal and Yellow was highest for the discrimination of classes Tidal channels and Bare soils respectively. Band Yellow is also helpful for the identification of paleodunes.
After the analysis from the most robust attributes at the exploratory analysis, including the texture attributes implemented at InterIMAGE vl. 27, the scene classification was performed. In comparison to other classifications the results were improved due to the availability of the new bands Yellow and Red Edge, eliminating frequent confusions such as e.g. among Ceramic Roofs and Bare soil.
Another important aspect to be emphasized is the classification of tidal channels, which was facilitated by decision rules modeled at InterIMAGE, using attributes of band Coastal, and the classification of the Beach area, based on attributes from band Yellow, which was also important to characterize those areas with paleo-dunes and dunes (Figure 08).
Figure 8: Land Cover Map
CONCLUSION
The objective of this study was to analyze the performance of the new spectral bands from WorldView-II satellite to map important features of a coastal urban area in Maranhão State, emphasizing the possibilities of dircrimination for different types of vegetation.
It is concluded that the new bands available at WorldView-II sensor system, specially Red Edge, present the highest capacity for discrimination among Mangrove and Semi-evergreen Tropical Forests. The combination of spatial and spectral resolutions allows the improvement of separation among the physical characteristcs of targets to be mapped, resulting in higher detail and precision of land cover maps.
04 bands 08 bands
Red & Near Inf. 1 Red Edge & Near Inf. 2
Mangroves Ceramic roof
Metal roof
Tidal chanel
Blockhouses Bare soil
The use of InterIMAGE software for image classification, and GeoDMA to elaborate the decision tree enabled a fast classification from improved image attributes, using the texture algorithm implemented at InterIMAGE, allowing the separability of class mangrove. The very high spatial resolution of WorldView 2 images as well as the new spectral bands available also allowed the discrimination of different land cover classes.
Mapping of coastal urban areas is improved by the use of these very high resolution images considering OBIA.
References
BLASCHKE, T.; KUX, H. J. H. Sensoriamento remoto e SIG avançados - novos sistemas sensores: métodos inovadores. São Paulo: Oficina de Textos, 2007, 2ª ed., 303 p.
BÜCKNER, J.; STAHLHUT, O.; PAHL, M.; LIEDTKE., C.-E., 2001. GeoAIDA - A knowledge based automatic image data analyser for remote sensing data. In: INTERNATIONAL ICSC CONGRESS ON COMPUTATIONAL INTELLIGENCE: METHODS & APPLICATIONS, 2. Bangor, Wales, United Kingdom. Proceedings... Millet, Alberta: ICSC. p.19-22.
COSTA, G. A. O. P.; FEITOSA, R. Q.; FONSECA, L. M. G.; OLIVEIRA, D.; FERREIRA, R. S.; CASTEJON, E. F., 2010. Knowledge-based interpretation of remote sensing data with the InterIMAGE system: major characteristics and recent developments. In: GEOGRAPHIC OBJECT BASED IMAGE ANALYSIS (GEOBIA), 29 jun - 2 jul 2010, Ghent, Bélgica. International Archives of Photogrammetry, Remote Sensing and Spatial Information Sciences, vol. XXXVIII-4/C7. Ghent University. CD-ROM.
DIGITALGLOBE. WhitePaper – The benefits of the 8 Spectral Bands of WorldView-II. March 2010a. Available at: http://Worldview2.digitalglobe.com/docs/Worldview-2_8-Band_Applications_Whitepaper.pdf .
DIGITALGLOBE. Spectral Response for DigitalGlobe Worldview 1 and Worldview 2 Earth Imaging Instruments. 2010b. Available at: <http://www.digitalglobe.com
spacecraft/WV1_WV2_SpectralResponce.pdf>
EHLERS, M. Sensoriamento Remoto para usuários de SIG – Sistemas Sensores e métodos: entre as exigências do usuário e a realidade. In: Blaschke, T.; Kux, H. (Org.). Sensoriamento Remoto e SIG avançados – Novos sistemas sensores: métodos inovadores. São Paulo: Oficina de Textos, 2007. 2º ed.. 303 p. Cap.2, p. 19-38.
GEODMA – Geographical Data Mining Analysis. Developed
by Thales Korting. Available at:
http://www.dpi.inpe.br/geodma/?lingua=portugues, Nov. 2011).
GERCO. GOVERNO DO ESTADO DO MARANHÃO. SECRETARIA DE ESTADO DO MEIO AMBIENTE E RECURSOS HÍDRICOS, 1998. Macrozoneamento do Golfão Maranhense – diagnóstico ambiental da microrregião da aglomeração urbana de São Luís: estudo sócio-econômico e
cultural. São Luís: Coordenadoria de Programas Especiais/Programa Estadual de Gerenciamento Costeiro.
ITT Visual Information Solutions, 2009. ENVI 4.7, version 4.7. Boulder, Colorado, EUA.
KERR, J.M. Worldview-02 offers new capabilities for the monitoring of threatened coral reefs. In: Geospatial World Forum 2011 - Dimensions and Directions of Geospatial Industry,18-21 January 2011, Hyderabad, India. Available at: http://dgl.us.neolane.net/res/dgl/survey/_8bandchallenge_winn ers.jsp
KORTING, T. S.; FONSECA, L. M. G.; ESCADA, M. I. S.; CÂMARA, G. GeoDMA: um sistema para mineração de dados de sensoriamento remoto. In: SIMPÓSIO BRASILEIRO DE SENSORIAMENTO REMOTO, 14, 2009, Natal. Anais... São José dos Campos: INPE, 2009. p. 7813-7820. Available at: http://marte.dpi.inpe.br/col/dpi.inpe.br/sbsr@80/2008/11.17.21 .17/doc/7813-7820.pdf. (02 Nov. 2011).
PADWICK, C.; DESKEVICH, M.; PACIFICI, F. SMALLWOOD, Scott. Worldview-2 Pan Sharpening. In: Proceedings... ASPRS 2010 Annual Conference, San Diego, California. April 26-30.
PCI GEOMATICS ENTERPRISES INC, 2010. PCI Geomatica-10, version 10.3.1. Richmond Hill, Ontário, Canadá.
RIBEIRO, B.M.G., 2010. Avaliação de Imagens Worldview-II para o mapeamento da cobertura do solo urbano utilizando o sistema InterIMAGE. Dissertação (Mestrado em Sensoriamento Remoto). INPE – Instituto Nacional de Pesquisas Espaciais, São José dos Campos, available at: retrogradation of natural vegetation. Greenbelt: National Aeronautics and Space Administration – NASA, 1974. 371 p.
SOUZA, U.D.V.; FEITOSA, A.C. Ocupação e uso da zona costeira do Estado do Maranhão. In: Encontro de Geógrafos da América Latina (EGAL), 12.,2009, Montevidéu. Anais... XII EGAL, 2009. Trabalhos completos, p. 2415-2430. CD-ROM, On line. ISBN 78-14-00012-3. Available at: http://www.egal2009.com/ (10 Mar. 2012)
SOUZA, U.D.V.; ALFAYA, F.A.V.S.; KUX, H.J.H. Contribuição das novas bandas espectrais do satélite WorldView-II para a Classificação de Tipos Vegetais em Habitats Costeiros: Resultados Iniciais. In: XV Simpósio Brasileiro de Sensoriamento Remoto, SBSR, 30.04.11 – 05.05.11, Curitiba, Brasil, São José dos Campos: INPE, 2011. Available at: http://www.dsr.inpe.br/sbsr2011/files/p0824.pdf
TOUTIN, T.; Review article: geometric processing of remote sensing images: models, Algorithms and Methods. International Journal of Remote Sensing, v. 25, n. 10, p. 1893-1924, May 2004.
VADUVA, C. Latent Dirichlet Allocation for Spatial Analysis of Very High Resolution Satellite Images. Geospatial World Forum 2011 - Dimensions and Directions of Geospatial Industry,Jan. 18-21 2011, Hyderabad, India. Available
http://dgl.us.neolane.net/res/dgl/survey/_8bandchallenge_winn ers.jsp.
WITTEN, I.H.; FRANK, E., 2005. Data mining – practical machine learning tools and techniques (2.ed.). Morgan Kaufmann, San Francisco. 558 p. ISBN (0-12-088407-0).
Acknowledgements
We acknowledge company DIGITALGLOBE for the WorldView-II image used and Fundação de Amparo a Pesquisa do Maranhão, FAPEMA, for the scholarship granted to the first author.