FOREST STEM VOLUME CALCULATION USING AIRBORNE LIDAR DATA I. Büyüksaliha
, S. Bayburta, M. Schardtb,c, G. Büyüksalih a
a
BIMTAS, Istanbul, Turkey – [ismail.buyuksalih, serdar.bayburt, gurcan.buyuksalih]@bimtas.istanbul b
JOANNEUM Research, Digital, Steyrergasse 17, 8010 Graz / Austria –[email protected] c
Graz, TechnicalUniversity, Steyrergasse 31, 8010 Graz / Austria –[email protected] HRIGI – High-Resolution Earth Imaging for Geospatial Information, ISPRS WG I/2
KEY WORDS: aerial LiDAR, nDSM, tree height, canopy height,stand volume, Pleaides multispectral image
ABSTRACT:
Airborne LiDAR data have been collected for the city of Istanbul using Riegl laser scanner Q680i with 400kHz and an average flight height of 600m. The flight campaign was performed by a helicopter and covers an area of 5400km2. According to a flight speed of 80 knot a point density of more than 16 points/m2 and a laser footprint size of 30cm could be achieved. As a result of bundle adjustment, in total, approximately 17,000 LAS files with the file size of 500m by 700m have been generated for the whole city. The main object classes Ground, Building, Vegetation (medium, high) were derived from these LAS files using the macros in Terrasolid software. The forest area under investigation is located northwest of the city of Istanbul, main tree species occurring in the test site are pine (pinus pinaster), oak (quercus) and beech (fagus). In total, 120 LAS tiles covering the investigation area have been analysed using the software IMPACT of Joanneum Research Forschungsgesellschaft, Graz, Austria. First of all, the digital terrain model (DTM) and the digital surface models (DSM) were imported and converted into a raster file from the original laser point clouds with a spatial resolution of 50cm. Then, a normalized digital surface model (nDSM) was derived as the difference between DSM and the DTM. Tree top detection was performed by multi – resolution filter operations and tree crowns were segmented by a region growing algorithms develop specifically for this purpose. Breast Height Diameter (BHD) was calculated on the base of tree height and crown areas derived from image segmentation applying allometric functions found in literature. The assessment of stem volume was then calculated as a function of tree height and BHD. A comparison of timber volume estimated from the LiDAR data and field plots measured by the Forest Department of Istanbul showed R2 of 0.46. The low correlation might arise either from the low quality of the field plots or from the inadequacy of the allometric functions used for BHD and stem volume modelling. Further investigations therefore will concentrate both on improving the quality of field measurements and the adoption of the allometric functions to the specific site condition of the forests under investigation. Finally stand boundaries of the forest area made available by the forest department of Istanbul were superimposed to the LiDAR data and the single tree measurements aggregated to the stand level.
Aside from the LiDAR data, a Pleiades multispectral image characterized by four spectral bands (blue, green, red and near infrared) and a GSD of 2.8m has been used for the classification of different tree species. For this purpose the near infrared band covering the spectral range of 0.75µm to 0.90µm has been utilized and the IMPACT software used.
1. Introduction
Airborne lidar technology has become an effective tool for the use in applications of natural resources. In the field of forestry, the LIDAR measurements can provide high-quality data on three-dimensional characterizations of forest. A Lidar (Light Detection and Ranging) system is a laser system that calculates the 3D coordinates of
estimate forest parameters including tree height, crown width, diameter, volume, and canopy structure.
Lidar point clouds provide high accuracy in extracting the digital elevation models of forestry regions (Reutebuch et al., 2003). In addition, high quality data about the structural features of forest trees can be obtained (Maltamo et al., 2004). Additionally, analysing the characteristics of the stands, the development of forest fire models, the planning of the utilization of forest products and the determination of forest road routes are also a priority (Sessions et al., 2006).
In Schardt et al. (2002) and (2015), the forest inventory parameters like tree height, timber volume, tree species, tree age, stand boundary and basal area are determined for a sustainable forest management using the Lidar data and high resolution imagery. In these publications, after the generation of a normalized digital surface model and forest mask, the forest area was segmented into homogeneous polygons, tree tops were detected and various forest parameters were calculated by the in-house software IMPACT.
In this study, same workflow was applied in a quite different forestry area in Istanbul, Turkey using the combination of Lidar datasets and multispectral satellite imagery. Results show that such a data combination can provide satisfactory results on the calculation of forest parameters, but very much depend on the quality of field plots. This is a critical issue for a country, where one-third of its landscape is covered by forest.
2.
Test region and data
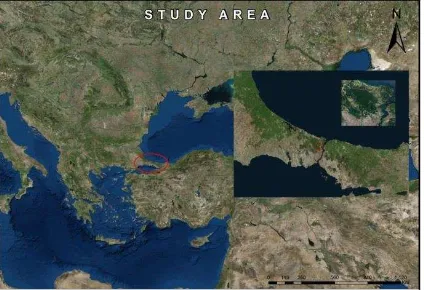
The study area covers approximately 16 km² forestry region located at the north-western part of Sarıyer district of Istanbul province (Figure 1). The geographic coordinates can be given as 41° 09' 18.14'', 41° 09' 19.39'' north latitudes and 41° 06' 44.69'', 41° 07' 05.98'' east longitudes.
Fig. 1. Location of test site in Istanbul.
The main dataset used in this study was the lidar point clouds obtained by Riegl Q680i scanner from a helicopter platform with the point density of 16 points per square meter. In total, 120 LAS tiles (tile size is 500x700m) resulted and they have been analysed using the software IMPACT of Joanneum Research Forschungsgesellschaft, Graz, Austria. As a first step of production line, the digital terrain model (DTM) and the digital surface models (DSM) were imported and converted into a raster file from the original laser point clouds with a spatial resolution of 50cm. Then, a normalized digital surface model (nDSM) was derived as the difference between DSM and the DTM. These products are the main layer will be used in later steps of IMPACT software to acquire the forest parameters. Aside from the LiDAR data, a Pleiades multispectral image characterized by four spectral bands (blue, green, red and near infrared) and a GSD of 2.8m has been used for the classification of different tree species. For forest type classification, especially the near infrared band covering the spectral range of 0.75µm to 0.90µm provides most significant information for the separation of different forest classes.
3. Derivation of forest parameters from LiDAR
and satellite data
An approach combining LiDAR and satellite data were applied to assess the forest parameters required in a cost-effective way. Three dimensional structural parameters, such as height, stem numbers and timber volume was derived from LiDAR data, whereas information on the distribution of forest types (species) has been assessed by means of optical satellite imagery.
3.1. Satellite image classification
Pléiades image with panchromatic band (GSD of 70 cm) and multispectral bands in blue, green, red and near infrared (GSD of 2.8m), acquired on July 2014 was used in this investigation. In the northern part of Istanbul where the test area is located, four main tree species (quercus, pinus pinea, pinus pinaster, pinus nigra) were identified. For this purpose reference data provided by the General Directorate of Forestry (OGM) were used as ground truth information. Pixel-based maximum likelihood classification method was applied. In regions where no ground truth data could be provided training areas were selected from aerial photographs or land use maps produced in the frame of other field studies. Image classification process of Pléiades image using Erdas Imagine software was started by calculating the statistics for eight classes. The accuracy of the Maximum
Likelihood classification is shown in Table 1 for these eight classes (pinus pinea, pinus nigra, pinus pinaster, quercs, road, asphalt road, built-up area, and barren ground). The accuracy analysis process was done in Erdas 2013 software by selecting automatically 109 points in the classified image in accordance with the ratio where percentage of each classes to the whole area. Every point was checked with ground truth information by manually visual interpretation, and then the accuracy analysis was performed. Overall classification accuracy and Kappa Statistics were obtained as 77% and 72% respectively.
Table 1. Accuracy assessment results
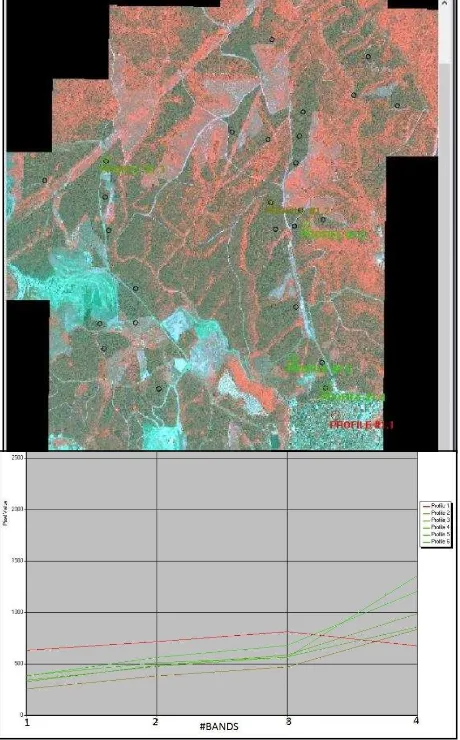
Fig. 2. Near band effect in different profile
When the values obtained in Table 1 are examined, the effect of the infrared band and the distinction between forest and non-forest areas are clearly revealed. Fig. 2 represents the spectral effect of the near infrared band in different profiles. X-axis is for the pixel value, while Y axis shows the band names 1, 2, 3, 4 respectively red, green, blue, near infrared. It can be clearly seen that the profile 1 which is in the non-forest area shows the weak spectral difference in NIR band than the other bands. On the other hand in the other profiles (2, 3, 4, 5, and 6) which are in the forest area, there are enough spectral differences between NIR and the other bands. One of the pine species, the Pinus pinaster was the best distinguished class with 88% accuracy. Since pinus pinaster and pinus nigra show very similar signatures, pinus pinaster class was obtained with an accuracy of only 55.82%. Due to the various reflection values of quercus species, they are mixed up with pinus pinaster and pinus nigra and have an accuracy value of 74.29%. Although the Pinus pinea is classified with an accuracy of 80%, it represents 1% of the investigation area, so the result can be discussed. After the accuracy analysis process, generalization was done by applying 5*5 median filtering in order to eliminate the pepper and salt structure (Fig. 3).
Fig.3. Results of pixel-based classification of Pleiades spectral bands.
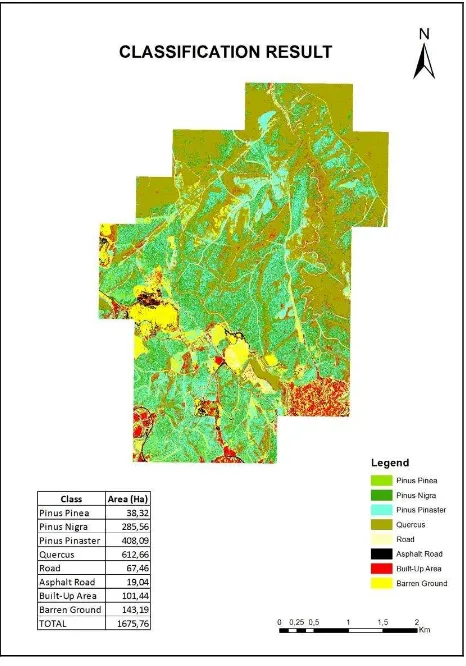
Based on the classification process thematic maps of the area can be produced with the related spatial calculations based on the raster to vector conversion (Fig. 4).
Fig. 4. Thematic classes
3.2. LiDAR Data Processing
A workflow starting from the raw LiDAR point cloud and ending with the resulting forest parameters is presented in Fig. 5. The most important processing steps are the detection of tree tops, the segmentation of homogeneous forest stands and finally the calculation of all forest parameters. The entire workflow is operated as an automated procedure implemented in the Joanneum Research in-house software package IMPACT as the “IMPACT LiDAR Toolbox”.
Fig. 5. Workflow of IMPACT Lidar toolbox.
The digital terrain model (DTM) and the digital surface Model (DSM) was converted into a raster file from the original point cloud data (available in * .LAS format) with spatial resolution of 50 cm. Then, a normalized digital surface Model (nDSM) was derived as the difference between the digital surface model and the digital elevation model. In a next step a forest mask is generated from the nDSM. The nDSM within the forest mask is then used for tree top detection, segmentation, forest volume calculations.
4. RESULTS
4.1. Generation of Forest Mask
The forest mask was derived using an automated approach of IMPACT software. The processing results were then revised by visual control due to ambiguous borders and areas. A quality control has been performed by random sampling using the 27 field plots of the ground truthing campaign (Fig. 6). The forest and non-forest areas were compared by visual interpretation of LiDAR and Pleaides satellite imagery and the most parts of the study area were correctly detected.
Fig. 6. Field plots on the forest mask.
4.2. Tree Top Detection
Fig. 7 show the result of the tree top detection in an area of forest stands with different growth classes. The Tree Top Detector automatically detects tree tops based on the LiDAR nDSM as input. The method uses a multi-scale Laplacian of Gauss (LoG) method, which is a combination of the Laplacian and Gauss filter (Gonzalez &Woods 2002).
Fig. 7. Tree tops
4.3. Derivation of Homogeneous Forest
Segments
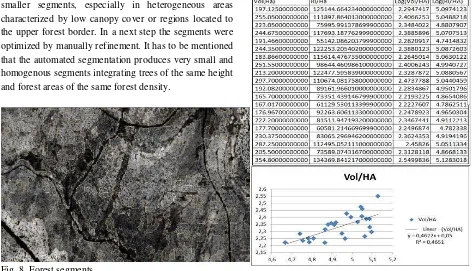
The forest area was divided into homogeneous forest patched by automatic segmentation according to tree height and stand density (Fig. 8). This process works as follows: First, the automated segmentation produces smaller segments, especially in heterogeneous areas characterized by low canopy cover or regions located to the upper forest border. In a next step the segments were optimized by manually refinement. It has to be mentioned that the automated segmentation produces very small and homogenous segments integrating trees of the same height and forest areas of the same forest density.
Fig. 8. Forest segments
4.4. Derivation of Forest Parameters
Firstly, The stem numbers per segment and per ha are calculated based on the tree top detections. Secondly, based on both the tree top detections and their respective tree heights within each segment, three different forest segment height values are calculated; height of upper layer (i.e. the mean height of 20% highest trees per segment), mean height (i.e. the mean height of all detected trees) and height of second layer, if existing (i.e. the mean height of the 20% highest trees of the second
layer, which are areas where the trees smaller than 2/3 of the height of the upper layer). Third, mean slope, main aspect and mean height above sea level are calculated for each segment. Finally, timber volume is calculated for each segment using parameter settings proposed by Hirschmugl et al. (2013).
In this investigation, timber volume was calculated per stand based on the canopy space integral and the field plot data. The canopy space integral is defined as the volume under the forest canopy, and thus, considers the height of the trees and forest density within each of the segments. From the altogether 26 field plots measured by the ground truth campaign were used for the validation and the analysis showed an R² of 0.46 (Fig. 9. X axis refers to timber volume per hectare while y axis refers to canopy space integral.
Fig. 9. Regression between timber volume and canopy space integral.
Fig.10. 26 Ground truthing areas overlaped on the segmentation
5. Conclusions
The results in the Istanbul test area show that the forest parameters can be derived using a combined approach of Lidar and satellite data, but it very much depends on the quality of the ground data. Even if it is the case, it is quite important that the usefulness of airborne Lidar data for the extraction of forest parameters and stem volume calculations. Right now, the main issue is to collect better reference dataset to apply the combined approach of IMPACT software to derive more accurate forest parameters.
Acknowledgements
We would like to thank to the General Directorate of Forestry for providing the reference datasets for this research.
References
Gonzalez, R.C., Woods, R. E., 2002: Digital Image Processing. Prentice Hall, Inc., Upper Saddle River, New Jersey, second edition, 793 p.
Hirschmugl, M., Gallaun, H., Wack, R., Granica, K., Schardt, M., 2013: EUFODOS: European Forest Downstream Services Improved Information on Forest Structure and Damage Int. Arch.
Photogramm. Remote Sens. Spatial Inf. Sci., XL-1/W1: 127-131.
Maltamo, M., K. Eerikainen, J. Pitkanen, J. Hyyppa, and M. Vehmas., 2004. Estimation of timber volume and stem density based on scanning laser altimetry and expected tree size distribution functions. Remote Sensing of Environment. 90: 319-330.
Schardt, M., Ziegler. M., Wimmer, A., Wack, R., Hyyppa, J. 2002: Assessment of forest parameters by mean of laser scanning. ISPRS Arch. Vol. 34(3), 304-312.
Schardt, M., Granca, K., Hirschmugl, M., Deutscher, J., Mollatz, M., Steinegger, M., Gallun, H., Wimmer, A., Linser, S., 2015: The assessment of forest parameters by combined LiDAR and satellite data over Alpine regions-EUFODO S Implementation in Austria Lesn. Cas. For. J. 61 (2015) 3–11.
Sessions, J., A. E. Akay, G. Murphy, W. Chung, and K. Aruga., 2006. Road and Harvesting Planning and Operations in Computer Applications in Sustainable Forest Management, Including Perspectives on Collaboration and Integration Series: Managing Forest Ecosystems, Vol. 11, Edited by Shao, Guofan and Reynolds, Keith M. Sipringer, Berlin. 2006, XXXII, 277 p. ISBN:978-1-4020-4305-5.
Reutebuch, S.E., R.J. McGauhey, H.E. Andersen, and W.W. Carson., 2003. Accuracy of high-resolution LIDAR terrain model under a conifer forest canopy. Canadian J. of Remote Sensing. 29(5):527-535. Wack, R., 2006. Assessment of Alpine Protection Forest
Parameters based on LIDAR Data ad SPOT V Satellite Imagery. Proceedings of th HMRSC Workshop Graz, Austria.