UNCERTAINTY ASSESSMENT AND WEIGHT MAP GENERATION FOR EFFICIENT
FUSION OF TANDEM-X AND CARTOSAT-1 DEMS
H. Bagheria, M. Schmitta, XX. Zhua,b a
Signal Processing in Earth Observation, Technical University of Munich, Arcisstr. 21, 80333 Munich, Germany-(hossein.bagheri, m.schmitt)@tum.de
bRemote Sensing Technology Institute (IMF), German Aerospace Center (DLR), Oberpfaffenhofen, 82234 Wessling, [email protected]
KEY WORDS: Accuracy assessment, Data fusion, Predicted weight map, Artificial Neural Network, TanDEM-X DEM, Cartosat-1 DEM
ABSTRACT:
Recently, with InSAR data provided by the German TanDEM-X mission, a new global, high-resolution Digital Elevation Model (DEM) has been produced by the German Aerospace Center (DLR) with unprecedented height accuracy. However, due to SAR-inherent sensor specifics, its quality decreases over urban areas, making additional improvement necessary. On the other hand, DEMs derived from optical remote sensing imagery, such as Cartosat-1 data, have an apparently greater resolution in urban areas, making their fusion with TanDEM-X elevation data a promising perspective. The objective of this paper is two-fold: First, the height accuracies of TanDEM-X and Cartosat-1 elevation data over different land types are empirically evaluated in order to analyze the potential of TanDEM-X-Cartosat-1 DEM data fusion. After the quality assessment, urban DEM fusion using weighted averaging is investigated. In this experiment, both weight maps derived from the height error maps delivered with the DEM data, as well as more sophisticated weight maps predicted by a procedure based on artificial neural networks (ANNs) are compared. The ANN framework employs several features that can describe the height residual performance to predict the weights used in the subsequent fusion step. The results demonstrate that especially the ANN-based framework is able to improve the quality of the final DEM through data fusion.
1. INTRODUCTION
Digital Elevation Models (DEMs) as a representation of terrain surface with different resolution and coverage are produced for diverse applications. Special interest lies in the generation of global DEMs, which provide homogeneous information about the worlds topography for (almost) the complete globe. One of the most recent and most prominent examples of global terrain datasets is the TanDEM-X DEM, which was produced by the Ger-man TanDEM-X mission, consisting of two SAR satellites flying in close orbit configuration. The mission goals aimed at a DEM of HRTI 3 standard, i.e. with a relative height accuracy better than 2 m for slopes lower than 20 % (Kriegeret al., 2007). How-ever, initial visual inspection of TanDEM-X DEM data demon-strates undesirable horizontal resolution and height accuracy in morphologically complex terrains like urban areas and in conse-quence the need for quality enhancement in these areas (Rossiet al., 2011). One possibility for improvement of TanDEM-X
eleva-tion data in problematic terrain is the fusion with other available elevation data which do not suffer from SAR-inherent imaging effects such as layover and shadowing. Examples for these alter-native data are DEMs derived from optical stereo imagery. Opti-cal DEMs generally reach HRTI-3 standard (with a relative height accuracy of 2-3 m) when they are produced using high-resolution optical imagery like acquired by Cartosat-1.
This paper first investigates the height accuracies and errors of both the TanDEM-X and the Cartosat-1 elevation data for differ-ent land types. The output of this assessmdiffer-ent illustrates the per-formance of each DEM for a specific land type and allows for an educated judgment about which DEM shows favourable accuracy for which land type, thus providing a basis for the consideration of DEM fusion. Afterwards, the results of a simple preliminary
TSX/Cartosat-1 DEM fusion are shown and discussed. In order to reach a better result, a more sophisticated approach for adap-tive weight map generation is proposed. It employs several fea-tures that can describe the height residual performance and uses them as input to an artificial neural network (ANN) to predict the weights used in the subsequent fusion step.
2. TANDEM-X AND CARTOSAT-1 DEM UNCERTAINTY ASSESSMENT
Because of the different vertical and horizontal datum of the test DEMs and the reference DEM, all data must first be transferred to one reference datum with identical pixel spacing. For the ex-periments in this paper, we chose to use UTM as joint reference system with heights measured above the WGS84 ellipsoid. All data were resampled to 3 m pixel spacing to preserve more de-tails in the high resolution DEM and to prevent the creation of an artificial vertical bias caused by lost building shape details.
areas demonstrates that the errors do not follow a normal distribu-tion, other robust metrics like normal median absolute deviation (NMAD) are recommended for error analysis (H¨ohle and H¨ohle, 2009). Section 4.2 summarizes the results of our accuracy as-sessment of TanDEM-X and Cartosat-1 DEM data over different urban and rural land types.
3. DEM FUSION OVER URBAN AREAS
As the results of the uncertainty assessment (see Section 4.2) will validate, the quality of the TanDEM-X DEM is not perfect in urban areas, especially when high buildings are present. As men-tioned in Section 1, a feasible solution for the improvement of TanDEM-X elevation data over urban areas is the fusion with Cartosat-1 DEM data, which were shown to provide much better accuracy in urban areas. Various methods have been formulated for DEM fusion (Crosettoet al. 1998; Reinartzet al. 2005; Pa-pasaikaet al. 2011; Kuschket al. 2016; Fusset al. 2016), an important application case of data fusion in the field of remote sensing (Schmitt and Zhu, 2016). Among the aforementioned methods, the simplest and most popular one is weighted aver-aging (WA) (Reinartzet al., 2005). The main issue of WA is to employ weights which are proportional to the expected height errors. In this paper two attempts are followed for generating weight maps which can describe the qualities of corresponding DEMs. First, the height error maps delivered with the TanDEM X data and the standard deviation maps of the Cartosat 1 stereo matching are used as weight maps in the WA-based fusion. Sec-ondly, more sophisticated weight maps are generated using an ANN-based approach in order to predict more accurate weights based on spatial features extracted from the DEMs.
3.1 DEM Fusion Using HEM-based Weight Maps
The TanDEM-X DEM comes with a height error map (HEM), which is derived from the coherence estimates, the number of looks, and the baseline configuration. For the Cartosat-1 DEM, the standard deviation of the stereo matching process, including consideration of the number of stereo matched points can be used to produce a similar HEM.
Before application of the fusion process, the Cartosat-1 DEM must be aligned to the TanDEM-X DEM, which again is carried out using the ICP algorithm. After that, TanDEM-X and Cartosat-1 are fused together by using the acquired weight maps based on the simple weighted averaging.
3.2 DEM Fusion Using ANN-Predicted Weight Maps
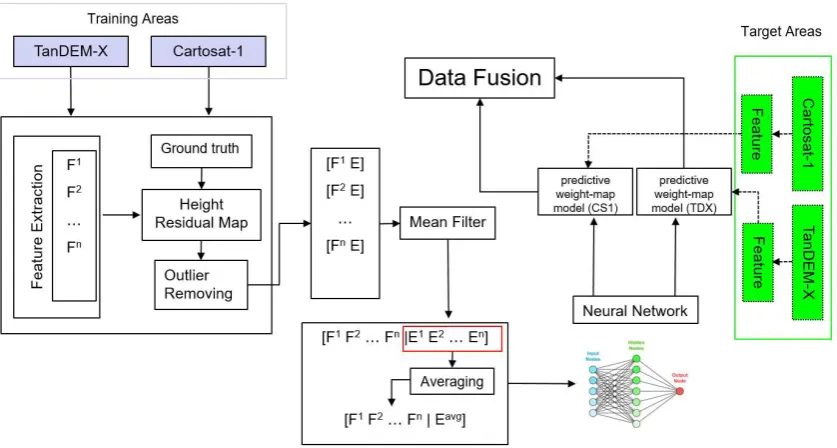
As will be shown in Section 4.3.1, DEM fusion over urban ar-eas using simple weighted averaging with weight maps derived from the height error maps delivered with the DEM products does not result in a DEM accuracy exceeding the Cartosat-1 DEM accuracy. Therefore, a more sophisticated approach for adap-tive weight map generation is proposed. It employs several fea-tures that can describe the height residual performance and uses them as input to an artificial neural network (ANN) to predict the weights used in the subsequent fusion step. The framework of the proposed method is shown in Fig. 1. It consists of three main steps that are: 1) feature extraction and height residual computa-tion, 2) data preprocessing and finally 3) training of an artificial neural network to generate a suitable weight predictor. The out-put of the network is a model that can approximately predict the height residuals in the target areas where two DEMs are supposed to be fused.
3.2.1 Feature Extraction and Data Preprocessing: For the training of the ANN training data representing different relevant land types are used. From those, features such as slope, aspect, edginess, different types of roughness, anisotropic coefficient of variation (ACV) and height error map (HEM) are extracted (Olaya, Gruber and Peckham, 2009). In addition, height residual maps are calculated from the corresponding DEM patches and LiDAR ground truth data.
Before building the ANN structure, pre-processing the height residuals related to feature values is essential to remove outliers and reduce the noise influence. For this purpose, a two-step mean filtering process is carried out. The significant characteristic of this pre-processing step is to bin feature values by a statistical-empirical binning approach. The feature values and their corre-sponding height residuals are binned by Freedman-Diaconis rule (Birg´e and Rozenholc, 2006): the bin width.IQRis the interquartile range andnis the number of measurements.
The mean filter is bin-wisely performed for each bin to smooth height residual values. This process should be carried out for each feature. Then corresponding to each pixel, the new outcomes of the previous step as smoothed height residual are averaged again to give a height residual for every pixel. After pre-processing, the data used to train the ANN for weight map prediction.
3.2.2 ANN for Weight Map Prediction: The filtered inputs from Section 3.2.1 are then used to train a classical artificial neu-ral network. The final output of the trained ANN is a predic-tive weight map model that can be used for arbitrary parts of DEMs in order to anticipate the height residuals just based on measured features. The explained framework is implemented for both kinds of DEMs to generate an individual weight map for each DEM separately. The predicted residual maps can then be used as weight maps associated with each kind of DEMs in the fusion process.
For training the NN, training data representing versatile land types, e.g. inner city area (densely packed, relatively high ings), residential areas (single family homes and detached build-ings), agricultural areas, and forested areas are used in order to ensure generalizability. After feature extraction, height residual computation and preprocessing based on the pipeline described in Section 3.2.1, the output is input into to the NN. The NN is trained using the filtered feature vectors as inputs and the mod-ified height residuals as outputs. 70% of the data are allocated for training, 15% for validation, while the rest is devoted as test-ing data to monitor the performance of the network durtest-ing the training.
4. EXPERIMENTS AND RESULTS
4.1 Study Area and DEMs
Figure 1. The proposed framework for ANN-based weight map model generation for fusion of TanDEM-X and Cartosat-1 DEMs
Figure 2. Depictions and locations of study subsets
angle of 31◦and a resolution of 2.5 m. It is specifically designed
for high-resolution DEM generation with relatively large areal coverage. The Cartosat-1 DEM used in this study has been pro-duced by the XDibias image processing system of DLR, using the pipeline described in (d’Angeloet al., 2010). It has a nominal pixel spacing of 5 m. On the other hand, TanDEM-X is a Ger-man SAR interferometry mission aiming at mapping the worlds topography on global scale with a grid size of 0.4 arc seconds and height accuracy of HRTI-3 (Kriegeret al., 2007). The TanDEM-X raw DEM used in this study was produced by DLRs Integrated TanDEM-X Processor (ITP) from data with an incidence angle of about 38◦and a height of ambiguity of about 46 m and has a
pixel size of 0.2 arc seconds.
For height accuracy evaluation, six subsets of different land types are selected:
1. Industrial area (Sub A). This land type is characterized by flat, simple and rectangular buildings which often are not very high.
2. Inner city area (Sub B). This land type includes many dense buildings and possibly also some higher buildings. 3. High buildings (Sub C) are skyscrapers and other high rise
buildings.
4. Residential area (Sub D). This type contains many small one-family homes
5. Forested and agricultural area (Sub E). 6. Agricultural areas and lake (Sub F).
cloud (with a density of 1 point per m) provided by the Bavarian surveying administration is available as reference.
4.2 Accuracy Assessment Results
Figure 3 shows the vertical offset of the TanDEM-X and the Cartosat-1 DEM in comparison to the reference DEM in each subset. The vertical bias of Cartosat-1 depends on the absolute vertical accuracy of the external DEM that is used for RPC re-finement because the Cartosat-1 RPCs originally only provide an accuracy in the order of several hundred meters. On average, the vertical offset of the Cartosat-1 elevation data over the differ-ent test areas is 1.327 m. The vertical offset of the TanDEM-X DEM depends on the accuracy of determining phase offset. For this task, the initial radargrametric DEM of coarse accuracy is produced by TanDEM-X bistatic images and orbital information. Then, this DEM is employed as an external DEM in phase un-wrapping process. The phase offset is calculated from the mean of the most probable values in the phase difference histogram (histogram of radargrammetric and unwrapped phase difference), whereas layover and shadow areas are disregarded (Rossiet al., 2012). In consequence, for areas affected by layover or shadow-ing, such as subset C (high buildings), the vertical offset is higher than in the other test subsets because they are discarded for phase offset estimation and the vertical offset estimate is not valid for these areas. The mean height offset of the TanDEM-X DEM over all subsets is found to be -0.794 m. In contrast, the height off-set of the TanDEM-X DEM calibrated with ICESat data is even lower (Gruberet al., 2012).
The uncertainty assessment results over urban and non-urban ar-eas after vertical bias removal are collected in Tab. 1. The height residual maps for TanDEM-X and Cartosat-1 DEM in study areas are also displayed in Figs. 4-9. It has to be noted that all figures and mean heights are derived by comparing the DEMs and the LiDAR reference data after vertical bias correction.
Figure 3. Vertical offsets of TanDEM-X and Cartosat-1 in study areas
Figure 4. Height residual maps of industrial area: TanDEM-X DEM (Left) and Cartosat-1 DEM (Right)
Figure 5. Height residual maps of inner city area: TanDEM-X DEM (Left) and Cartosat-1 DEM (Right)
Figure 6. Height residual map for high building: TanDEM-X DEM (Left) and Cartosat-1 DEM (Right)
Figure 7. Height residual map for residential area: TanDEM-X DEM (Left) and Cartosat-1 DEM (Right)
4.3 DEM Fusion Results
Areas Cartosat-1 TanDEM-X
STD NMAD LE90 STD NMAD LE90
Urban
Industrial 3.638 1.698 1.993 4.714 2.552 2.830
Inner city 5.657 4.561 4.075 7.453 6.395 5.390
High building 12.638 3.243 4.957 18.271 6.689 8.652 Residential 3.036 2.631 2.407 3.966 3.501 2.992
Non-Urban
Forested 4.296 4.193 3.474 4.563 4.386 3.567
Agricultural (sub E) 1.675 1.337 1.227 1.221 1.122 0.953 Agricultural (sub F) 2.527 0.881 0.993 2.443 1.171 1.285
Lake 2.273 1.819 1.736 12.481 10.012 10.486
Table 1. Height accuracy (in meter) of TanDEM-X and Cartosat-1 over different areas
Figure 8. Height residual maps for agricultural and forested area: TanDEM-X DEM (Top) and Cartosat-1 DEM (Bottom)
Figure 9. Height residual maps for agricultural and lake area: TanDEM-X DEM (Left) and Cartosat-1 DEM (Right)
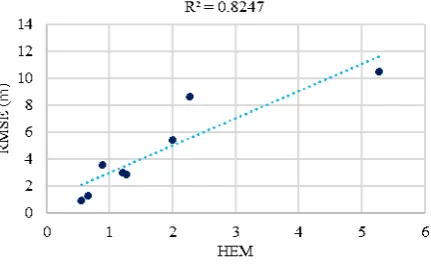
RMSE of the high building subset deviates from the trend line because strong height changes appear in this subset.
The main problem of using the matching standard deviation as HEM for optical DEMs like Cartosat-1 is that it is not computed comprehensively for urban subsets and thus is only available in a rather sparse distribution. Thus, the Cartosat-1 HEM was pixel-wisely calculated based on the mean standard deviation of the available values derived from the dense matching step propor-tional to the number of pair-rays in each cell in urban areas. Un-fortunately, the TanDEM-X HEM does not consider the layover effect, and as a result the mean of TanDEM-X HEM is lower than mean of the Cartosat-1 HEM, while, using prior knowledge of DEM qualities from the previous uncertainty assessment, it is known that Cartosat-1 is more accurate than the TanDEM-X DEM for urban areas on average. The assessments reveal the variance of TanDEM-X HEM is higher than Cartosat 1 HEM. Thus, the 3σof HEM values can be used as appropriate ratio for normalized weight map generation from the HEMs. The fusion was just carried out in urban areas in subset A, B, C, and D be-cause the standard deviation of matching was not available for non-urban areas. The results of fusion are summarized in Tab. 2.
Figure 10. TanDEM-X height errors: Correlation between RMSE of height residuals and mean HEM value in different
subsets
Figure 11. Cartosat-1 height errors: Correlation between RMSE of height residuals and mean value of standard deviation of
stereo matching in different subsets
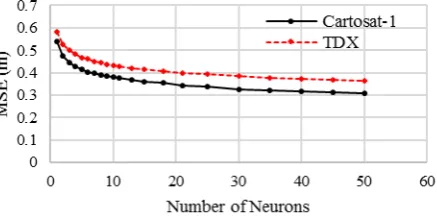
4.3.2 ANN-based Fusion Results: The size of data for train-ing the networks of Cartosat-1 and TanDEM-X DEM was 91272 and 89574 pixels, respectively, taken from three considered sub-sets (B, D, E). Figures 12 and 13 demonstrate the performance of the neural networkss for an increasing number of neurons in the first layer, as well as with an added hidden layer. The result shows that increasing the number of neurons in the first layer is more ef-fective than deepening the networks. After successfully setting networks and the training, the predictive models were created.
pixel-Subset A:Industrial area B: Inner city area C: High buildings D: Residential areas
DEM STD NMAD RMSE STD NMAD RMSE STD NMAD RMSE STD NMAD RMSE
TanDEM-X 5.12 2.95 5.12 8.38 7.93 8.39 19.78 7.29 20.44 4.49 3.97 4.51
Cartosat-1 4.04 1.85 4.04 6.76 5.81 6.77 14.09 3.49 14.34 3.94 3.33 4.02
Fused DEM 3.91 1.84 3.91 6.66 6.03 6.66 14.01 3.80 14.31 3.93 3.33 4.00
Table 2. Accuracies of TanDEM-X and Cartosat-1 DEM fusion based on HEM-weighted averaging (accuracies in meter).
DEM Median RMSE MAE NMAD
Cartosat-1 0.212 4.041 2.407 1.847
TanDEM-X 0.337 5.122 3.412 2.950
Fused DEM
Averaging 0.291 3.768 2.539 2.258
HEM-WA 0.200 3.912 2.357 1.844
ANN-WA 0.263 3.534 2.253 1.815
Table 3. Results of fusion of TanDEM-X and Cartosat-1 DEM (in meter) by using weight maps generated from different methods
Figure 12. The performance of the NNs with increasing the number of Neurons in first layer
Figure 13. The performance of the NNs with adding the hidden layer and increasing the number of Neurons in the hidden layer
wise weighted averaging algorithm using the obtained height er-ror maps as weights of the input DEMs. In Table 3, the results of the fusion by adopting the proposed framework for weight map generation based on the neural network are compared with other methods like HEMs as weights and also just using the simple av-eraging without using weights.
5. DISCUSSION
The results of accuracy assessment of TanDEM-X and Cartosat-1 DEM collected in Table Cartosat-1 show that the Cartosat-Cartosat-1 DEM has a higher height accuracy than the TanDEM-X DEM in urban areas. The difference of two DEMs is lowest in residential areas and maximal in the high building subset. The main source of errors in the TanDEM-X DEM come from the layover effect that causes a phase ramp (sometimes referred to as front porch effect (Thiele et al.2007)), which leads to wrong height reconstructions. Since the amount of layover depends on the height of the buildings and
the incidence angle of SAR sensor, its effect is less for lower residential and industrial buildings and increases for inner city areas with more high buildings, while being maximal for areas with skyscrapers. The layover causes the height of the left side of building facing the SAR sensors to be lower than they should actually be, while they are overestimated around the right side of the building. This layover-caused over- and underestimation, respectively, can be found in all urban areas on the right and left sides of the buildings as depicted in the residual maps (Fig. 4-7).
In contrast, the TanDEM-X and the Cartosat-1 DEMs have al-most identical height accuracy in agricultural and forested ar-eas. In forested areas, the mean height of the TanDEM-X DEM is 584.396 m, while the mean height of the Cartosat-1 DEM is 581.528 m, respectively. In comparison, the mean first-pulse Li-DAR height is 583.312 m. This indicates that the mean canopy height is slightly overestimated by TanDEM-X, which is proba-bly caused by the location of the X-band SAR phase scattering center in the upper part of the vegetation volume (Fig. 8). In con-trast, the Cartosat-1 mean height is lower than the first-pulse Li-DAR height. In the agricultural areas, the opposite phenomenon appears: Here, 91% of the first pulse and second pulse heights differ by less than 5 cm (i.e. the first and last pulse almost coin-cide with height of 577.575 m) while the mean height of Cartosat-1 and TanDEM-X DEM are 578.0Cartosat-18 m and 577.484 m respec-tively. Last, but not least, as shown in Fig. 9, Cartosat-1 defi-nitely estimates the height of the lake area better than TanDEM-X which is due to the low coherence because of specular reflection and temporal decoration.
Generally, the results of fusion based on height error maps deliv-ered with the TanDEM X data and the standard deviation maps of the Cartosat 1 stereo matching confirm the improvement of TanDEM-X in all subsets. The quality of the fused DEM is even slightly better than the Cartosat-1 DEM accuracy. Neverthe-less, the results demonstrate that using appropriate weight maps, which can precisely identify the quality of the InSAR and the op-tical DEM will lead to a better fusion result. Therefore, a more sophisticated approach which is be able to estimate the height residuals based on pre-extracted spatial DEM features and using NN was proposed for weight map prediction in the target area where two DEMs would be fused together.
quality of Cartosat-1 DEM in the target area, the weight maps derived from the output model of NN can significantly increase the quality of both input DEMs. Besides RMSE and MAE, a decreasing NMAD value as robust metric is evident for this im-provement.
6. CONCLUSION AND OUTLOOK
The uncertainty assessment confirmed that the Cartosat-1 DEM provides higher accuracy than the TanDEM-X DEM over urban areas, while in non-urban subsets both DEMs have almost iden-tical quality. The results of the fusion experiments illustrate that the implemented framework to produce the weight maps of in-put DEMs can effectively improve the fusion process. In this case of multi-sensor data fusion, where each input dataset comes with different inherent specifications, the weight maps can assist the fusion algorithm to feasibly regard the individual inputs. The strategy of recognizing patterns on the DEMs based on suitable spatial features and corresponding height residual errors in se-lected subsets as typical areas with different land types makes a general model as predictive weight map for the whole of DEM. The neural network can be employed to explore the patterns and relationships between the features and height residual map to properly construct predictive weight map model for each DEM.
In the future, we will combine weight map prediction along with more sophisticated DEM fusion approaches like Total Variation-regularized DEM fusion.
ACKNOWLEDGEMENTS
The authors would like to thank Prof. Reinartz and Dr. dAngelo of DLR for providing the Cartosat-1 DEM; Dr. Fritz of DLR for providing the TanDEM-X raw DEM; and the Bavarian Surveying Administration for providing the LiDAR data.
REFERENCES
Birg´e, L. and Rozenholc, Y., 2006. How many bins should be put in a regular histogram, ESAIM: Probability and Statistics. EDP Sciences, 10, pp. 2445.
Crosetto, M., Crippa, B., Sez, D. and Politecnico, R., 1998. Op-tical and radar data fusion for DEM generation, 32, pp. 128134.
d’Angelo, P., Uttenthaler, A., Carl, S., Barner, F. and Reinartz, P., 2010. Automatic Generation of High Quality DSM Based on IRS-P5 Cartosat-1 Stereo Data, in ESA Living Planet Sympo-sium, pp. 37.
Fuss, C. E., Berg, A. A. and Lindsay, J. B., 2016. DEM Fu-sion using a modified k -means clustering algorithm, Interna-tional Journal of Digital Earth, 9(12), pp. 12421255. doi: 10.1080/17538947.2016.1208685.
German Aerosapce Center (DLR), 2016. TanDEM-X Ground Segment DEM Products Specification Document. Available at: https://tandemx-science.dlr.de/pdfs/TD-GS-PS-0021 DEM-Product-Specification v3.1.pdf.
Gruber, A., Wessel, B., Huber, M. and Roth, A., 2012. Oper-ational TanDEM-X DEM calibration and first validation result,
ISPRS Journal of Photogrammetry and Remote Sensing. Inter-national Society for Photogrammetry and Remote Sensing, Inc. (ISPRS), 73, pp. 3949. doi: 10.1016/j.isprsjprs.2012.06.002.
H¨ohle, J. and H¨ohle, M., 2009. Accuracy assessment of digital elevation models by means of robust statistical methods, ISPRS Journal of Photogrammetry and Remote Sensing. Elsevier B.V., 64(4), pp. 398406. doi: 10.1016/j.isprsjprs.2009.02.003.
Krieger, G., Moreira, A., Fiedler, H., Hajnsek, I., Werner, M., Younis, M. and Zink, M., 2007. TanDEM-X: A Satellite Forma-tion for High-ResoluForma-tion SAR Interferometry, IEEE TransacForma-tions on Geoscience and Remote Sensing, 45(11), pp. 33173341. doi: 10.1109/TGRS.2007.900693.
Kuschk, G., d’Angelo, P., Gaudrie, D., Reinartz, P. and Cremers, D., 2016. Spatially Regularized Fusion of Multiresolution Digital Surface Models, IEEE Transactions on Geoscience and Remote Sensing, pp. 112. doi: 10.1109/TGRS.2016.2625040.
Olaya, V., Gruber, S. and Peckham, S., 2009. Basic Land-Surface Parameters, in Hengl, T. & Reuter, H. I. (ed.) Geomor-phometry. Concepts, Software, Applications, pp. 141169. doi: 10.1016/S0166-2481(08)00006-8.
Papasaika, H., Kokiopoulou, E., Baltsavias, E., Schindler, K. and Kressner, D., 2011. Fusion of Digital Elevation Models Using Sparse Representations, pp. 171184.
Ravanbakhsh, M. and Fraser, C. S., 2013. A comparative study of DEM registration approaches, Journal of Spatial Science, 58(1), pp. 7989. doi: 10.1080/14498596.2012.759091.
Reinartz, P., M¨uller, R., Hoja, D., Lehner, M. and Schroeder, M., 2005. Comparison and fusion of DEM derived from SPOT-5 HRS and SRTM data and estimation of forest heights, Proc. EARSeL Workshop on 3D-Remote Sensing, 1. Available at: http://m.www.eproceedings.org/SIG/3D/Dati/Porto/Reinartz.pdf.
Rossi, C., Fritz, T., Breit, H. and Eineder, M., 2011. First urban TanDEM-X RawDEMs analysis, in 2011 Joint Ur-ban Remote Sensing Event. IEEE, pp. 6568. doi: 10.1109/JURSE.2011.5764720.
Rossi, C., Rodriguez Gonzalez, F., Fritz, T., Yague-Martinez, N. and Eineder, M., 2012. TanDEM-X calibrated Raw DEM gen-eration, ISPRS Journal of Photogrammetry and Remote Sensing, 73, pp. 1220. doi: 10.1016/j.isprsjprs.2012.05.014.
Schmitt, M. and Zhu, XX., 2016. Data Fusion and Re-mote Sensing: An ever-growing relationship, IEEE Geo-science and Remote Sensing Magazine, 4(4), pp. 623. doi: 10.1109/MGRS.2016.2561021.