SWUP
Classifying the poor household using neural network
Maria F.V. Ruslau* and Brodjol Sutijo S. Ulama
Department of Statistics, Sepuluh Nopember Institute of Technology, Surabaya, Indonesia
Abstract
The issue of poverty has recently been brought to the public’s attention. The picture of Indonesian development reveals many families are not benefiting from national economic growth. Many families were still poor and hovering below the poverty line. The classification of the individual or of poor households in a class or poverty status can be a good instrument to focus on the living conditions of the poor. In this study, back propagation algorithm was used to build models of neural networks that can classify each poor household appropriate their poverty status. Network is built using the weights of the selection of the best network. The best networks have been training on the sub-sub smaller dataset. Classification is done by replication 10-fold cross validation. Average accuracy of classification in the training data is 58.89 percent while the testing data of 56.42 percent.
Keywords back propagation, classification, neural network, poverty
1.
Introduction
Classification is one of the most frequently encountered decision making tasks of human activity and application areas of neural networks. A classification problem occurs when an object needs to be assigned into a predefined group or class based on a number of observed attributes related to that object. Many problems in business, science, industry, and medicine can be treated as classification problems. Examples include bankruptcy prediction, credit scoring, medical diagnosis, quality control, handwritten character recognition, and speech recognition (TNP2K, 2013a).
Many social studies analyze attitude responses using regression models. The classification and recognition of individual characteristics and behaviours constitute a preliminary step and is an important objective in the behavioural sciences (TNP2K, 2013b). Current statistical methods do not always give satisfactory results. Neural network are an alternative method for classification can work with large numbers of qualitative variables such as behaviours, provided that they can be coded, and they are able to use non-linear linked variables. A methodology based on one of the principles of artificial neural networks, the backpropagation, can improve performance in this area (Boonkiatpong & Sinthupinyo, 2011).
This research focus on the analysis with large data of poor household by applying backpropagation neural networks. Measurement and analysis of poverty is necessary to identify individuals and households in need of government assistance and aid. Cases in this study was a multi-class classification for ordinal response or target. To analyze these data we
adopt the techniques introduced by Boonkiatpong & Sinthupinyo (2011). Classification accuracy is not increased significantly. However, the network integration method, simply helping to reduce errors and improve accuracy, especially for large and heterogeneous data sets.
2.
Materials and methods
2.1 Back propagation model
Back propagation is a learning technique that adjusts weights in the neural network by propagating weight changes. It is simply a gradient descent method to minimize the total square error of the output computed by the network (Cherkassky & Mulier, 2007). The back propagation is one of the simplest and most general methods for supervised training of multilayer neural networks, in which neurons connect each other with weighted connection. Back propagation has become popular to classification problem in recent years. Back propagation algorithm can be developed to multi classification problem. Multi classification problem has similarities to binary classification, which makes the network structure then randomize the weight and calculate the output unit. The difference lies in the calculation process for the case multi category output where the output will work in accordance with the classification process, namely calculation of output is processed through back propagation learning algorithm with binary numbers, if the output goes into classification class, then the class contains a value of 1, whereas a class apart It contains the value 0.
Figure 1. Backpropagation architecture for multi classification category.
The architecture consists of one input layer, one hidden layer and one output layer. In thus case, Xi is the i-th input variable, Wik is the weight of the i-th input node to node k-th in the hidden layer. Zk is k-th node in the hidden layer. Yj is the j-th output node, the number of
categories and Vkj is the weight of node k-th in the hidden layer to the j-th node in the output
layer.
2.2 Implementation procedure
In this study, we are predicting the class (classification) of an outcome variable. Response in this study consisted of four categories. The response variable was the poverty status. This situation is identical to the multi classification learning process, its means the binary process n times. The predictors and response variables will be scaled to [0,1] scale before entering them into the network.
Xi
Yj Zk
Wik
Vkj
Input Layer
Hidden Layer
SWUP Our experiment work with a large dataset of poor household, 65.658 households with 16 predictor variables. Consists of one ordinal variables, three interval variables, and nominals. Thus, we divide the original training set (N0) into nsub data sets, namely N1to Nn. Each sub dataset will be trained by the same Back propagation network structure with a single hidden layer. The number of nodes in hidden layer was selected by training with different number of hidden layer. The result shown in Figure 2. and we were collected the weight from each node in the lowest error network and use these weights as weight to training networks in original dataset with the same structure.
3.
Results and discussion
We started working with determines the number of nodes in hidden layer which is appropriate for this case. According to Figure 2, we can see that, increasing the number of nodes in the hidden layer increases the accuracy of the training data, however, large number of nodes were not always improved the accuracy of testing data, it is shown in Figure 3.
Figure 2. Accuracy levels of training and testing dataset based on number of node in hidden layer.
Figure 3. Mean square error based on number of node in hidden layers.
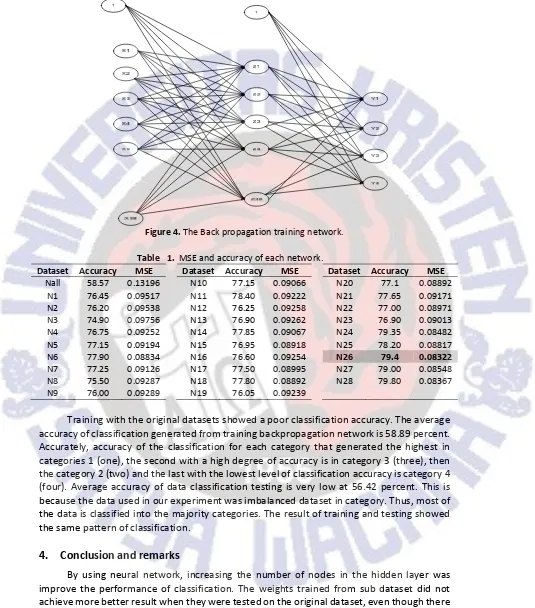
Based on the results in Figure 2 and Figure 3, the neural network model used for training in this case was consist of an input layer with 38 nodes, one hidden layer with 35 nodes and 4 nodes in the output layer. The architecture is shown in Figure 4.
The accuracy of sub datasets from the datasets is shown in Table 1. The N26 is the best
network of data. Furthermore, the weights of N26 used to training the network by using
Figure 4. The Back propagation training network.
Table 1. MSE and accuracy of each network.
Dataset Accuracy MSE Dataset Accuracy MSE Dataset Accuracy MSE Nall 58.57 0.13196 N10 77.15 0.09066 N20 77.1 0.08892
N1 76.45 0.09517 N11 78.40 0.09222 N21 77.65 0.09171 N2 76.20 0.09538 N12 76.25 0.09258 N22 77.00 0.08971 N3 74.90 0.09756 N13 76.90 0.09262 N23 76.90 0.09013 N4 76.75 0.09252 N14 77.85 0.09067 N24 79.35 0.08482 N5 77.15 0.09194 N15 76.95 0.08918 N25 78.20 0.08817 N6 77.90 0.08834 N16 76.60 0.09254 N26 79.4 0.08322 N7 77.25 0.09126 N17 77.50 0.08995 N27 79.00 0.08548 N8 75.50 0.09287 N18 77.80 0.08892 N28 79.80 0.08367 N9 76.00 0.09289 N19 76.05 0.09239
Training with the original datasets showed a poor classification accuracy. The average accuracy of classification generated from training backpropagation network is 58.89 percent. Accurately, accuracy of the classification for each category that generated the highest in categories 1 (one), the second with a high degree of accuracy is in category 3 (three), then the category 2 (two) and the last with the lowest level of classification accuracy is category 4 (four). Average accuracy of data classification testing is very low at 56.42 percent. This is because the data used in our experiment was imbalanced dataset in category. Thus, most of the data is classified into the majority categories. The result of training and testing showed the same pattern of classification.
4.
Conclusion and remarks
SWUP highly variations of dataset and for imbalanced dataset. A technique is needed to handling imbalanced dataset and manage large variations in input before it is inserted into the network to trained.
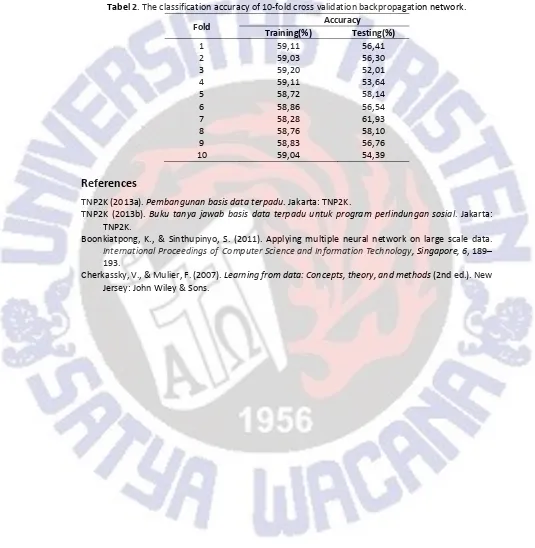
Tabel 2. The classification accuracy of 10-fold cross validation backpropagation network.
Fold Accuracy
Training(%) Testing(%)
1 59,11 56,41
2 59,03 56,30
3 59,20 52,01
4 59,11 53,64
5 58,72 58,14
6 58,86 56,54
7 58,28 61,93
8 58,76 58,10
9 58,83 56,76
10 59,04 54,39
References
TNP2K (2013a). Pembangunan basis data terpadu. Jakarta: TNP2K.
TNP2K (2013b). Buku tanya jawab basis data terpadu untuk program perlindungan sosial. Jakarta: TNP2K.
Boonkiatpong, K., & Sinthupinyo, S. (2011). Applying multiple neural network on large scale data.
International Proceedings of Computer Science and Information Technology, Singapore, 6, 189– 193.