EARLY VALIDATION OF PROBA-V GEOV1 LAI, FAPAR AND FCOVER PRODUCTS
FOR THE CONTINUITY OF THE COPERNICUS GLOBAL LAND SERVICE
J. Sánchez a, *, F. Camacho a, R. Lacaze b, B. Smets c a
EOLAB, Parc Científic Universitat de València, Catedrático José Beltrán, 2. 46980 Paterna (Valencia), Spain - [email protected]
b
HYGEOS, Toulouse, France - [email protected] c
VITO, Belgium - [email protected]
KEY WORDS: Copernicus Global Land, PROBA-V, LAI, FAPAR, FCover, validation
ABSTRACT:
This study investigates the scientific quality of the GEOV1 Leaf Area Index (LAI), Fraction of Absorbed Photosynthetically Active Radiation (FAPAR) and Fraction of Vegetation Cover (FCover) products based on PROBA-V observations. The procedure follows, as much as possible, the guidelines, protocols and metrics defined by the Land Product Validation (LPV) group of the Committee on Earth Observation Satellite (CEOS) for the validation of satellite-derived land products. This study is focused on the consistency of SPOT/VGT and PROBA-V GEOV1 products developed in the framework of the Copernicus Global Land Services, providing an early validation of PROBA-V GEOV1 products using data from November 2013 to May 2014, during the overlap period (November 2013-May 2014). The first natural year of PROBA-V GEOV1 products (2014) was considered for the rest of the quality assessment including comparisons with MODIS C5. Several criteria of performance were evaluated including product completeness, spatial consistency, temporal consistency, intra-annual precision and accuracy. Firstly, and inter-comparison with both spatial and temporal consistency were evaluated with reference satellite products (SPOT/VGT GEOV1 and MODIS C5) are presented over a network of sites (BELMANIP2.1). Secondly, the accuracy of PROBA-V GEOV1 products was evaluated against a number of concomitant agricultural sites is presented. The ground data was collected and up-scaled using high resolution imagery in the context of the FP7 ImagineS project in support of the evolution of Copernicus Land Service. Our results demonstrate that GEOV1 PROBA-V products were found spatially and temporally consistent with similar products (SPOT/VGT, MODISC5), and good agreement with limited ground truth data with an accuracy (RMSE) of 0.52 for LAI, 0.11 for FAPAR and 0.14 for FCover, showing a slight bias for FCover for higher values.
* Corresponding author. This is useful to know for communication with the appropriate person in cases with more than one author. 1. INTRODUCTION
From 1st January 2013, the Copernicus Global Land Service is operational, providing in near real time a set of biophysical variables over the whole globe. Leaf Area Index (LAI), Fraction of Absorbed Photosynthetically Active Radiation (FAPAR) and Fraction of Vegetation Cover (FCover) are delivered at 1 km resolution and 10-days frequency. These vegetation biophysical variables play a key role in several surface processes, including photosynthesis, respiration and transpiration. The first version of LAI, FAPAR and FCover variables, called GEOV1, was based on SPOT/VGT observation until the end of the mission in May 2014 (Baret et al., 2013). A SPOT/VGT GEOV1 archive of 15 years is now available (1999-2014) at the Global Land service. The continuity of the GEOV1 products is based on PROBA-V observations at 1 km. To provide continuity of the variables at 1km, the processing chains are to be updated towards the new PROBA-V mission which started its lifetime in November, 2013. Although the sensor of the latter mission is very compatible with the former mission, a spectral correction is to be performed to continue the 15-year time series at 1km resolution in a consistent manner. Therefore a pre-processing module is developed that performs next to the spectral correction a transformation of the new PROBA-V input data into SPOT-VGT compatible input data. Validation of PROBA-V GEOPROBA-V1 is thus mandatory before delivering the products to the users.
This paper describes the main results of the early scientific quality assessment of PROBA-V GEOV1 LAI, FAPAR, FCover products. This preliminary validation is focused on the consistency with SPOT/VGT GEOV1 products during the
overlap period (November 2013 - May 2014). MODIS C5 LAI/FPAR products are also considered for the intercomparison The procedure follows the guidelines and metrics defined by the Land Product Validation (LPV) group of the Committee on Earth Observation Satellite (CEOS) for the validation of satellite-derived land products. Several criteria of performance were evaluated including product completeness, spatial consistency, temporal consistency, intra-annual precision and accuracy.
The accuracy of PROBA-V GEOV1 products was evaluated against a number of agricultural sites. The ground data was collected in the context of the FP7 ImagineS project (http://fp7-imagines.eu) in support of the evolution of Copernicus Land Service (Camacho et al. 2014).
The quality assessment method is briefly described in Section 2. Section 3 shows the main results; conclusions are provided en Section 4.
2. QUALITY ASSESSMENT METHOD
ground reference maps to quantify the overall uncertainties of the products.
2.1 Intercomparison Approach
The reference global satellite products used are: GEOV1 based on SPOT/VGT observations (Baret et al., 2013) and Terra MODIS LAI/FAPAR (MOD15A2) collection 5 (Knyazikhin et al., 1998).
The products were intercompared over the BELMANIP2.1 (Weiss et al., 2014) network of sites that was designed to represent globally the variability of land surface types. Furthermore, the products are analysed for 6 generic classes, namely: Evergreen Broadleaf Forest, Evergreen Deciduous Forest, Needle-leaf Forest, Croplands, Herbaceous and Shrub/Sparse/Bare Areas. The different products must be compared over a similar spatial support area and temporal support period. The intercomparison was conducted using an average value over 3x3 pixels to reduce coregistration errors between products and differences in their sensor Point Spread Function (PSF) which determines the actual footprint of the data. The temporal support period for the quantitative assessment is 10-days with monthly composites. The original temporal sampling was used for compute missing values, histograms and the smoothness.
The following criteria of performance and metrics are assessed: Product Completeness: corresponds to the absence of spatial
and temporal gaps in the data. Temporal variations of GEOV1 missing values for SPOT/VGT and PROBA-V LAI products have been computed over the whole images.
Spatial Consistency: can be quantitatively assessed by comparing the spatial distribution of a reference validated product with the product under study. Global histograms of residuals at a monthly basis were analyzed. This analysis is complemented by the analysis of Probability Density Function (PDFs) of retrievals per biomes.
Temporal Consistency: The consistency of temporal variations of the vegetation variables are qualitatively analyzed as compared to reference validated products. Intra-annual precision (smoothness): corresponds to temporal
noise assumed to have no serial correlation within a season. In this case, the anomaly of a product LAI value from the linear estimate based on its neighbors can be used as an indication of intra-annual precision or smoothness. It can be characterized as suggested by Weiss et al., (2014): for each triplet of consecutive observations, the absolute value of the difference between the center P(dn+1) and the corresponding linear interpolation between the two extremes P(dn) and P(dn+2) was computed:
(1) Histograms of the smoothness are presented adjusted to a negative exponential function. The exponential decay constant is used as quantitative indicator of the typical smoothness value.
Relative Uncertainties: The inter-comparison of products offers an indirect means of assessing uncertainties (systematic or random) between products. The global statistical analysis is performed over BELMANIP2.1 sites considering all the dates available.
2.2 Direct Validation
The accuracy assessment was performed against ground truth data processed according to CEOS LPV guidelines for validation of LAI products. The data set used to validate is the ground data collected in the framework of the ImagineS project over agricultural sites for the period under study. Up-scaling of ground data was achieved with high-resolution satellite image using an empirical transfer function (Camacho et al., 2014). Eight sites were made available for the accuracy assessment for 2014 coming from FP7 ImagineS (Table 1).
Site
Table 1: Characteristics of the validation sites from ImagineS project for 2014 and associated ground biophysical values.
Due to the limited number of concomitant ground measurements, the number of ground reference maps was increased by using data from a different year from Camacho et al., 2013, and available at CEOS OLIVE Cal/Val portal (http://calvalportal.ceos.org/). These sites have been filtered by analyzing the inter-annual stability of the MODIS C5 FAPAR products, as MODIS time series expands from 2000 till the most recent dates. Only stable forest and grassland sites have been used: a maximum difference of ±0.05 in the MODIS FAPAR value between the concomitant date and the equivalent day of the current year was allowed. A total of 20 additional sites were finally considered, their main characteristics are presented in the Appendix.
3. RESULTS 3.1 Product Completeness
Figure 1 shows the temporal evolution of the fraction of missing values for SPOT/VGT and PROBA-V GEOV1 products. Over the six months overlap period, SPOT/VGT and PROBA-V provided consistent results, with SPOT/VGT showing a slightly better fraction of valid observations (around 5%), which could be partly explained due to the different overpass time between PROBA-V (10:45 am) and SPOT/VGT satellites (currently around 45 minutes before, GIOGL1-ATBD-PROBA2VGT).
around 60% of gaps corresponding to one missing observation. This could be partly explained by the richer spectral information of MODIS as compared to SPOT/VGT or PROBA-V which is more suitable for cloud screening.
Figure 1: Temporal variations of missing values for SPOT/VGT (blue dashed line) and PROBA-V (purple solid line) GEOV1
products during the November2013-December2014 period.
Figure 2: Distribution of the temporal lenght of the missing values over BELMANIP2.1 sites during the Nov13-May14 period for PROBA-V GEOV1, SPOT/VGT GEOV1 and
MODIS C5 products.
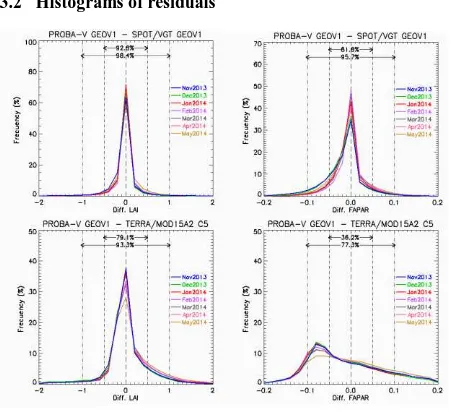
3.2 Histograms of residuals
Figure 3: Distribution of differences between PROBA-V and SPOT/VGT GEOV1 (Top) and between PROBA-V GEOV1 and MODIS C5 (Bottom) for LAI (Left side) and FAPAR (right
side) products.
Histograms of diferences among the global products under study were analyzed monthly (Figure 3). For LAI differences, above 93% of values (in average) are within ±0.5 LAI units for all the dates evaluated, which corresponds with a good spatial consistency, and 98% of difference values lies between ±1 LAI units between both GEOV1 products (PROBA-V and SPOT/VGT). PROBA-V GEOV1 and MODIS C5 LAI
differences are lager with a 79% of values between ±0.5 and 93% between ±1 LAI units. For FAPAR, a good agreement is found between PROBA-V and SPOT/VGT GEOV1 products with a percentage around 82% of differences within ±0.05 and up to 96% for the ±0.1 interval, which means also quite good consistency, but showing an asymmetric histogram with a slight negative bias (i.e. larger FAPAR values from SPOT/VGT observations). The histogram of residuals for FAPAR between PROBA-V and MODIS shows the inconsistency between both products. Only 36% of the pixels are within 0.05, with the peak located around -0.08 (higher values of MODIS). These results are similar to that found between SPOT/VGT GEOV1 and MODIS C5 FAPAR products for the 2003-2005 period (Camacho et al., 2013), but differences seems to be even larger between PROBA-V and MODIS mainly over DBF areas for the studied period.
3.3 Distributions of retrievals
Figure 4 shows the statistical distributions of LAI retrieved values per biomes for the several satellite products under study. Very similar distributions were found for both GEOV1 products (PROBA-V and SPOT/VGT) for all biome type. As compared with MODIS C5, the main discrepancies were found for evergreen broadleaf forest. Larger values for MODIS C5 over herbaceous and shrubs and bare areas are found, as well as a negative bias over needle-leaf forest.
Figure 4: Distribution of LAI values of each product for the BELMANIP2.1 sites during Nov13-May14 period for each
biome type.
Figure 5: Distribution of FAPAR values of each product for the BELMANIP2.1 sites during Nov13-May14 period for each
biome type.
herbaceous,shrubs and bare areas, in agreement with previous validation exersices (Camacho et al., 2013).
Figure 6 shows the FCover histograms, where PROBA-V and SPOT/VGT GEOV1 retrievals display consistent results for all biome type except for evergreen broadlef forest and needle-leaf forest, with slight larger values of PROBA-V products.
Figure 6: Distribution of FCover values of each product for the BELMANIP2.1 sites during Nov13-May14 period for each
biome type.
3.4 Intra-Annual Precision
The smoothness of PROBA-V GEOV1 products is almost identical to that of SPOT/VGT similar products (Figure 7). The GEOV1 products are very smooth, indicating a high intra-annual precision. MODIS products are noisier, as can be observed in the distribution of the smoothness values, which quantifies what it is clearly visible on the temporal profiles (see section 3.5).
Figure 7: Histograms of the delta function (smoothness) for LAI, and FAPAR products for BELMANIP2.1 sites during the November2013-May2014 period. The curves are adjusted to an exponential function and the exponential decay constant is
presented in the figure.
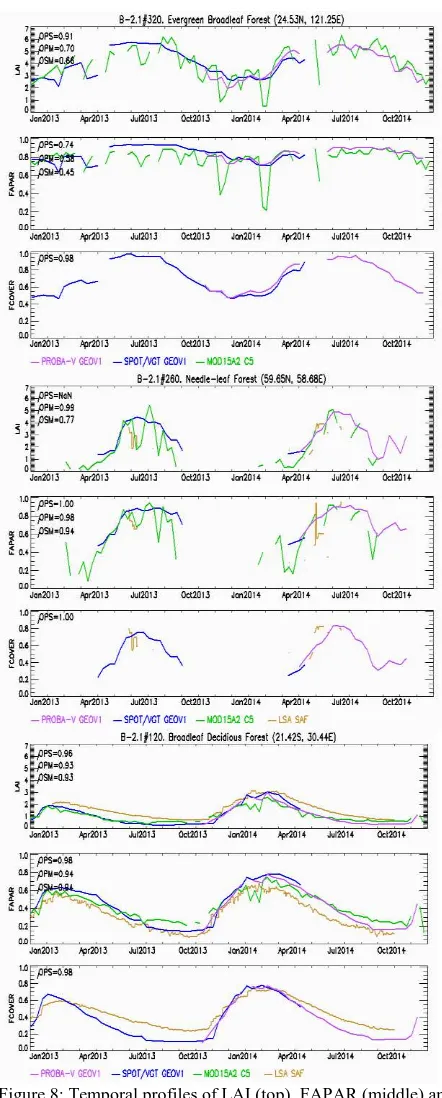
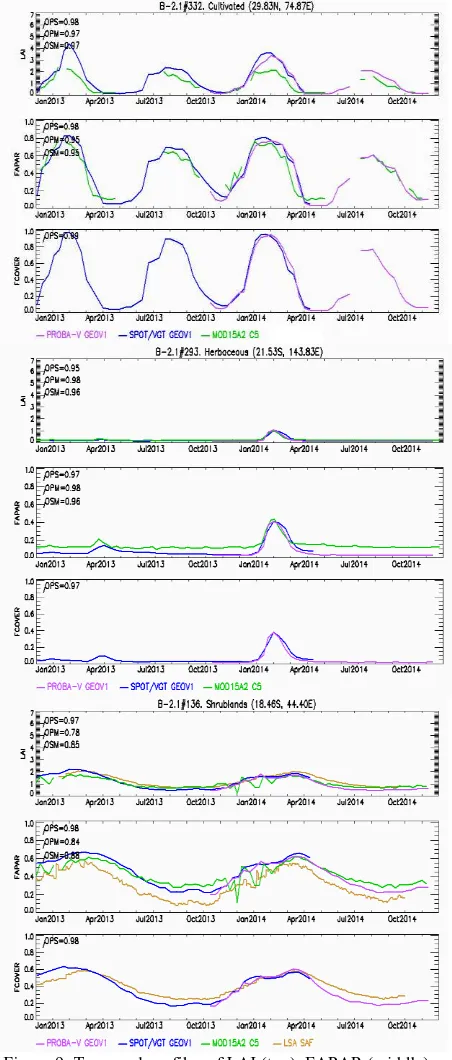
3.5 Temporal Consistency
The consistency of PROBA-V GEOV1 temporal variations, as compared to SPOT/VGT GEOV1 and MODIS C5 products, was assessed over the BELMANIP2.1 network of sites. A good consistency of PROBA-V GEOV1 temporal variations for this time period was found for all the different biomes over the globe (see Figures 8 and 9). It is noticeable the good continuity achieved in GEOV1 products using PROBA-V data.
Note, however, that the SPOT/VGT GEOV1 FCover product showed over some desertic sites unexpected seasonal variations with a maximum up to 0.2.
Figure 8: Temporal profiles of LAI (top), FAPAR (middle) and FCover (bottom) values of each product (PROBA-V GEOV1,
Figure 9: Temporal profiles of LAI (top), FAPAR (middle) and FCover (bottom) values of each product (PROBA-V GEOV1, SPOT/VGT GEOV1, MODIS C5 and LSA SAF) for selected
sites of each biome type.
3.6 Relative Uncertainties
The consistency of PROBA-V GEOV1 with the reference global products was evaluated over BELMANIP2.1 sites at 10-days frequency during the November 2013 to May 2014 period.
Scatter-plots between GEOV1 (PROBA-V vs SPOT/VGT) products (Figure 10) show the optimal consistency between both products, with overall correlations higher than 0.96, no bias (note the perfect fit with slope 1.0 and offset 0.0), and
overall discrepancies (RMSE) of around 0.3, 0.03 and 0.04 for LAI, FAPAR and FCover respectively.
Overall discrepancies between PROBA-V and MODIS for the overlap period (November 2013 to May 2014) are larger (Figure 11), with some scattering observed for LAI products, and both scattering and bias (mainly for low values) for the FAPAR. The overall discrepancies between PROBA-V and MODIS are around 0.7 and 0.09 for LAI and FAPAR respectively.
Figure 10: LAI, FAPAR and FCover PROBA-V GEOV1 versus SPOT/VGT GEOV1 products scatter-plots over all BELMANIP-2.1 sites for the November 2103 - May 2014 period. The terms B and S represent the mean and the standard
deviation of the difference.
Figure 11: LAI and FAPAR PROBA-V GEOV1 versus MODIS C5 products scatter-plots over all BELMANIP-2.1 sites for the
November 2103 - May 2014 period. The terms B and S represent the mean and the standard deviation of the difference.
3.7 Direct Validation
A robust regression method was used to compute the accuracy (RMSE_W) in addition to the ordinary least square algorithm to reduce the outlier effects. The algorithm uses an iteratively reweighted least square with a bisquare weighting function and provides a weight associated to each sample. Samples with associated weight lower than 0.3 were considered outliers and not considered for accuracy estimation (RMSE). The closest satellite date to the ground data is used for the accuracy assessment.
fields in La Albufera site (rows #8 #11, Table 1) and a non-concomitant forest sample. The large discrepancies over La Albufera were observed end of June, when the rice crops were growing very rapidly, and at the end of August, before to start the harvest, which indicates that discrepancies could be partly attributed to the impact of the compositing period (30 days) of the satellite estimates. MODIS presents also similar accuracy (RMSE= 0.69) for the different biome types, but slightly degraded precision probably due to the reported instability over short time periods (Figure 9). Opposite to GEOV1, MODIS tends to underestimate the concomitant data provided by ImagineS over cropland sites, except in La Albufera site for the growing period. This can be explained as the composite period of MODIS is 8-days after the date of the product (future observations).
For the FAPAR, PROBA-V GEOV1 product shows also a quite good accuracy (RMSE=0.11, RMSE_W=0.1) with a slight positive bias (0.05) and very good correlations (Figure 13). For concomitant ground values over cropland sites (Table 2), no outliers were removed but a clear overestimation was observed again over La Albufera, (rows #7, #8, #9 in Table1) during the rapid growing stage of the rice. MODIS shows also quite good accuracy (RMSE=0.1) except for low values where a positive bias was observed. The agreement with ImagineS concomitant sites is better than GEOV1, with almost all points within the uncertainty level of ±0.1.
Finally, for FCover the accuracy (RMSE) obtained is 0.14 (0.1 for the weighted RMSE) with a positive bias of 0.1. The larger discrepancies are observed over forest sites, which was not observed for SPOT/VGT GEOV1 products, and should be confirmed with concomitant data when available. For concomitant data over some croplands sites of 25Mayo (#1), LaReina (#3) and Psenichne (#13) a large overestimation was observed (samples not identified as outliers). These results seems to indicate that the FCover product tend to overestimate the ground references, even if the dataset considered is still very limited.
Figure 12: Comparison of satellite LAI product with the ground-based maps. Left side: PROBA-V GEOV1. Right side:
MODIS C5. Filled symbols correspond to concomitant values of 2014 from ImagineS and unfilled symbols to a different year.
Forest stands for Broadleaf Evergreen, Broadleaf Deciduous and Needle-leaf Forests, Crops stands for Cultivated and Grass refers to Herbaceous, Shrubs, Sparse and Bare Areas. Numbers identify the ground data (Table 1). Crosses identify outliers
(weight<0.3).
Figure 13: As in Figure 12 for FAPAR.
Figure 14: As in Figure 54 for FCover
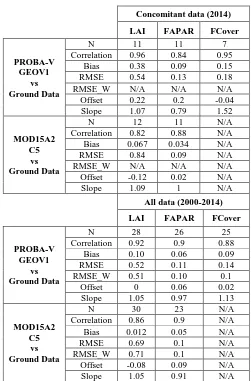
Concomitant data (2014)
Table 2: Performance of PROBA-V GEOV1 and MOD15A2 C5 products against reference ground based maps. RMSE_W
stands for weighted RMSE.
4. CONCLUSIONS
GEOV1 LAI, FAPAR and FCover estimates from PROBA-V data were found consistent with that of GEOV1 based on SPOT/VGT observations. The completeness of PROBA-V GEOV1 products is similar to that of SPOT/VGT GEOV1 products (around 5% lower).
Both PROBA-V and SPOT/VGT shows consistent spatial distribution of retrievals, whereas discrepancies between PROBA-V and MODIS are larger, mainly for the FAPAR product (large discrepancies). The temporal variations of PROBA-V were found also consistent with that of SPOT/VGT GEOV1 products.
The overall consistency between SPOT/VGT and PROBA-V evaluated in term of RMSE over BELMANIP-2 is better than the CEOS requirements on accuracy (0.5 for LAI, 0.05 for FAPAR), which demonstrates the good consistency between both products.
The direct validation shows that the accuracy of PROBA-V GEOV1 LAI product was very close to CEOS requirement on accuracy using limited concomitant data (RMSE=0.54) or using additional non-concomitant references (RMSE=0.51). For the FAPAR the accuracy is also quite good (0.11 for all data), but a slight overestimation was observed mainly as compared to concomitant data (bias=0.09). The FCover shows the worst performance, with a systematic positive bias observed for mainly for forest and cropland sites (up to 0.15 for concomitant data) and overall error of 0.14. PROBA-V shows similar performances than MODIS for both LAI and FAPAR products. In summary, these validation results of the PROBA-V GEOV1 products over one year (2014) period shows very good spatial and consistency with the SPOT/VGT GEOV1 products for the overlap period. However, a positive bias as compared to SPOT/VGT has been detected for the FCover mainly for values larger than 0.5. This bias seems to be confirmed by the limited ground observations available. All the criteria evaluated including accuracy assessment shows positive results. The main drawback of the product is the completeness which is slightly lower than in SPOT/VGT GEOV1 products.
REFERENCES
Baret, F., M. Weiss, R. Lacaze, F. Camacho, H. Makhmara, P. Pacholcyzk, B. Smets, 2013. GEOV1: LAI and FAPAR essential climate variables and FCOVER global time series capitalizing over existing products. Part1: Principles of development and production. Remote Sensing of Environment 137: 299–309.
Camacho, F., Cernicharo, J., Lacaze, R., Baret, F., and Weiss, M.,2013. GEOV1: LAI, FAPAR Essential Climate Variables and FCover global time series capitalizing over existing products. Part 2: Validation and intercomparison with reference products. Remote Sensing of Environment 137: 310–329.
Camacho, F., C. Latorre, R. Lacaze, F. Baret, F. De la Cruz, V. Demarez, C. Di Bella, H. Fang, J. García-Haro, M. P. Gonzalez, N. Kussul, E. López-Baeza, C. Mattar, E. Nestola, E. Pattey, I. Piccard, C. Rudiger, I. Savin, A. Sanchez - Azofeifa, M. Boschetti, D. Bossio, M. Weiss, A. Castrignano, M. Zribi (2014). "A Network of Sites for Ground Biophysical Measurements in support of Copernicus Global Land Product Validation". Proceedings of the IV RAQRS conference, Valencia, Spain, 22-26 September 2014. http://ipl.uv.es/raqrs/?q=content/4th-international-symposium-raqrs.
Fernandes, R., Plummer, S., Nightingale, J., et al., 2014. "Global Leaf Area Index Product Validation Good Practices". CEOS Working Group on Calibration and Validation - Land Product Validation Sub-Group.Version 2.0: Public version made available on LPV website. http://lpvs.gsfc.nasa.gov/.
Knyazikhin, Y., Martonchik, J. V., Myneni, R. B., Diner, D. J., & Running, S. W. (1998). Synergetic algorithm for estimating vegetation canopy leaf area index and fractionof absorbed photosynthetically active radiation from MODIS and MISR data. Journalof Geophysical Research, 103(D24), 32,257– 32,275.
Weiss, M., Baret, F., Block, T. et al., (2014). On Line Validation Exercise (OLIVE): A Web Based Service for the Validation of Medium Resolution Land Products. Application to FAPAR products.Remote Sensing: 2014. 6(5):4190-4216.
APPENDIX
Dahra Norht Senegal
15.43 -15.4
Shrubs
07/2001-08/2001
N/A
0.02-0.03 N/A
Tessekre South Kenya
15.819 -15.06
Herb. 07/2001 N/A 0.03 N/A
Budongo8 Uganda
1.77 31.61
Evergreen
F. 11/2007 0.87 N/A 0.26
Harth Forest France
47.81 7.45
Deciduous
F. 06/2013-09/2013 3.8-4.58 0.85-0.86 N/A
More information and full list of validation sites can be
found on the CEOS cal/val site