February 2010
Consumer Confidence Index (CCI) in February 2010 dropped 5.2
points against previous month to 105.3. The downward index
was due to lower respondent’s optimism toward future macro
economic condition which was likely related to the
government’s plan to raise LPG price.
Respondents expected that pressure on price in the next 3
months will be relatively stable with the index stands at 160.2,
while pressure on inflation for 6 months ahead was predicted
to increase as shown by 3.1 points rising index to 164.3.
Consumer Confidence Index
Consumers were still optimistic on economic condition although
the confidence turns down over previous month.
Consumer Survey on
February 2010 indicated that Consumer Confidence Index (CCI) felt down 5.2
points over previous month to 105.3. The declining CCI was mainly driven by
consumers pessimism over next 6 months economic condition considering
government’s plan to raise LPG tariff. Specifically, lower respondents’
optimism toward current economic condition (CECI) by 3.7 points and over
the next 6 months economic condition (CEI) by 6.7 points has influenced the
CCI slightly deeper although still at optimistic level.
Graph 1. Consumer Confidence Index
60.0 70.0 80.0 90.0 100.0 110.0 120.0 130.0 140.0
12 1 2 3 4 5 6 7 8 9 10 11 12 1 2 3 4 5 6 7 8 9 10 11 12 1 2
2007 2008 2009 2010
(Index)
Current Economic Condition Index Consumer Expectation Index Consumer Confidence Index
Optimistic
Pesimistic
CONSUMER SURVEY
Consumer
Confidence Index
remains at
optimistic area
Methodology
Consumers showed a better expectation toward economic
condition.
CCI in this period survey mounted 8.9 points, although stayed at
the lower level than previous month. Compared with the same period of
previous year, consumers assessed a more expanded economic condition in
current and for the next 6 months, as the indexes climbed by 12.0 and 5.9
points respectively.
Compared to the previous month, respondents were more
pessimistic on current economic condition.
The lowering consumer’s
optimism as indicated by 3.7 points downturn index to 94.7 was triggered by
easing current job availability index of 6.5 points that eventually pushed the
respondent’s optimism on current income index to be lower 6.9 points against
previous month.
On the same period of previous year, respondents deemed that
current economic condition are better off.
Current Economic Condition
Index (CECI) is stubbornly higher than previous year. CECI added by 12.0
points due to respondent’s perception on job availability which grew by 13.2
points. Inexplicitly, the conditions may influence the increasing index on
current income and appropriate time to consume durable goods by 4.0 and
18.7 points each.
Graph 2. Current Economic Condition Index (CECI)
0.0 20.0 40.0 60.0 80.0 100.0 120.0 140.0
12 1 2 3 4 5 6 7 8 9 10 11 12 1 2 3 4 5 6 7 8 9 10 11 12 1 2
2007 2008 2009 2010
Current Economic Conditions Index Buying Durable Goods Conditions Job Availability Current Incomes
(Index)
Respondents were seemingly straight optimistic over future
economic condition.
The Consumer Survey in February 2010 showed that
consumer’s expectation was still optimistic although it 6.7 points lower
against previous month. The declining expectation was derived by less
made the expectation index on job availability and income weakened by 3.0
and 8.6 points respectively.
Compared to the previous year, respondent’s optimism in the
forthcoming economic condition is increased.
In this period, survey also
denoted that consumers showed a higher optimism as the index rose by 5.9
points in annual term. The upgrading index was attributed by improvements
in all CEI components such as income expectation index climbed by 1.2
points, economic expectation index increased by 0.8 point, and job availability
expectation index inclined by 15.7 points.
Graph 3. Consumer Expectation Index (CEI)
0.0 20.0 40.0 60.0 80.0 100.0 120.0 140.0 160.0
12 1 2 3 4 5 6 7 8 9 10 11 12 1 2 3 4 5 6 7 8 9 10 11 12 1 2
2007 2008 2009 2010
Consumer Expectation Index Incomes Expectation Economic Expectation Job Availability Expectation
(Index)
Income Expectations
Respondents still expected that their income will increase in the
next 6 months.
Although the expectation level is 8.6 points lower than
previous month, but most of respondents were still optimistic that their
income in the next 6 months will continue to shape up as the index reached
the level of 132.5.
The shrink of respondent’s optimism on their income for the next 6
months was caused by lowering expectation by those whom classified more
than 60 years old, and those whom spent Rp3-5 million with the index easing
23.2 points and 11.9 points respectively.
Price Expectations
Inflationary pressure in the next 3 months was expected to be
stable while price in 6 months ahead are inclined to rise.
Respondents
expected a mild pressure on prices in the next 3 months with the index stayed
at 160.2 or added 0.4 point. Meanwhile, respondents outlook showed that
prices in the next 6 months will apparently tend to rise as the index moved up
3.1 points to 164.3. Such increasing index was mainly derived by pressure on
foodstuff price.
Graph 4.
Monthly Inflation and Price Expectation Index for the next 3 and 6 months
-2.0 0.0 2.0 4.0 6.0 8.0 10.0
130.0 140.0 150.0 160.0 170.0 180.0 190.0
5 6 7 8 9 10 11 12 1 2 3 4 5 6 7 8 9 10 11 12 1 2 3 4 5 6 7 8
2008 2009 2010
Price Expectation 6 month hence Price Expectation 3 month hence Actual Inflation
(Index) % (m-to-m)
Notes
: Index = 100 indicates that consumer expect prices will still be stable, index > 100 indicates
consumer expect prices will increase, and index < 100 indicates consumer expect prices will decrease
Expectations of Savings Interest Rates
Interest rates and savings in the next 6 months index decreased.
Based on this period survey, interest rates expectation index in the next 6
months eased 3.0 points to 114.9. Saving deposits index in the next 6 months
also diminished to the level of 125.7, lessen 4.1 points from previous month.
Price expectation
index for the next
6 months rose
Graph. 5
SBI Rate (%), Saving Interest Rates (%)
and Saving Interest Rates Expectations Index
0.0 2.0 4.0 6.0 8.0 10.0 12.0 14.0
80.0 90.0 100.0 110.0 120.0 130.0 140.0 150.0
5 6 7 8 9 10 11 12 1 2 3 4 5 6 7 8 9 10 11 12 1 2 3 4 5 6 7 8
2008 2009 2010
(%)
Saving Interest Rate Expectation (Index) SBI-1 month Saving Interest Rate (Index)
Graph. 6
Saving Expectation Index
70.0 80.0 90.0 100.0 110.0 120.0 130.0 140.0 150.0
5 6 7 8 9 10 11 12 1 2 3 4 5 6 7 8 9 10 11 12 1 2 3 4 5 6 7 8
2008 2009 2010
Saving Expectation (Index) (Index)
Expectations on Economic Conditions
Respondents were still confidence about economic condition in
the next 6 months although the economic index went down.
Respondent’s optimism on economic condition for the next 6 months was 8.3
points lower compared to the previous month reached the level of 114.4. By
gender, male respondents showed more pessimistic over economic condition
for the next 6 months as indicated by 9.7 points decreasing index, while based
on educational background, those whom graduated from diploma degree
were less optimistic on forthcoming economic condition. The index fell down
by 9.1 points.
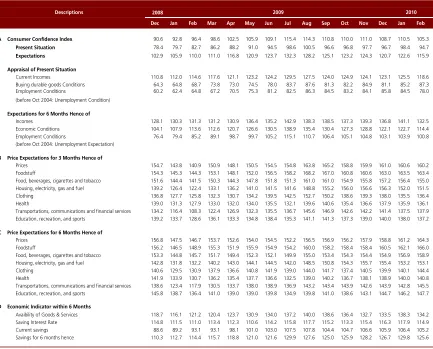
Table 1. Consumer Confidence, Price Expectations, Consumption Plans, and Economic Indicators (Index)
2008
Dec Jan Feb Mar Apr May Jun Jul Aug Sep Oct Nov Dec Jan Feb
A Consumer Confidence Index 90.6 92.8 96.4 98.6 102.5 105.9 109.1 115.4 114.3 110.8 110.0 111.0 108.7 110.5 105.3
Present Situation 78.4 79.7 82.7 86.2 88.2 91.0 94.5 98.6 100.5 96.6 96.8 97.7 96.7 98.4 94.7
Expectations 102.9 105.9 110.0 111.0 116.8 120.9 123.7 132.3 128.2 125.1 123.2 124.3 120.7 122.6 115.9
Appraisal of Present Situation
Current Incomes 110.8 112.0 114.6 117.6 121.1 123.2 124.2 129.5 127.5 124.0 124.9 124.1 123.1 125.5 118.6 Buying durable goods Conditions 64.3 64.8 68.7 73.8 73.0 74.5 78.0 83.7 87.6 81.3 82.2 84.9 81.1 85.2 87.3 Employment Conditions 60.2 62.4 64.8 67.2 70.5 75.3 81.2 82.5 86.3 84.5 83.2 84.1 85.8 84.5 78.0 (before Oct 2004: Unemployment Condition)
Expectations for 6 Months Hence of
Incomes 128.1 130.3 131.3 131.2 130.9 136.4 135.2 142.9 138.3 138.5 137.3 139.3 136.8 141.1 132.5 Economic Conditions 104.1 107.9 113.6 112.6 120.7 126.6 130.5 138.9 135.4 130.4 127.3 128.8 122.1 122.7 114.4 Employment Conditions 76.4 79.4 85.2 89.1 98.7 99.7 105.2 115.1 110.7 106.4 105.1 104.8 103.1 103.9 100.8 (before Oct 2004: Unemployment Expectation)
B Price Expectations for 3 Months Hence of
Prices 154.7 143.8 140.9 150.9 148.1 150.5 154.5 154.8 163.8 165.2 158.8 159.9 161.0 160.6 160.2 Foodstuff 154.3 145.3 144.3 153.1 148.1 152.0 156.5 158.2 168.2 167.0 160.8 160.6 163.0 163.5 163.4 Food, beverages, cigarettes and tobacco 151.6 144.4 141.5 150.3 144.3 147.8 151.8 151.3 161.0 161.0 154.9 155.8 157.2 156.4 155.0 Housing, electricity, gas and fuel 139.2 126.4 122.4 133.1 136.2 141.0 141.5 141.6 148.8 155.2 156.0 156.6 156.3 152.0 151.5 Clothing 136.8 127.7 125.8 132.3 130.7 134.2 139.5 142.5 152.7 150.2 138.6 139.3 138.0 135.5 136.4 Health 139.0 131.3 127.9 133.0 132.0 134.0 135.5 132.1 139.6 140.6 135.4 136.6 137.9 135.9 136.1 Transportations, communications and financial services 134.2 116.4 108.3 122.4 126.9 132.3 135.5 136.7 145.6 146.9 142.6 142.2 141.4 137.5 137.9 Education, recreation, and sports 139.2 133.7 128.6 136.1 133.3 134.8 138.4 135.3 141.1 141.3 137.3 139.0 140.0 138.0 137.2
C Price Expectations for 6 Months Hence of
Prices 156.8 147.5 146.7 153.7 152.6 154.0 154.5 152.2 156.5 156.9 156.2 157.9 158.8 161.2 164.3 Foodstuff 156.2 146.5 148.9 155.3 151.9 155.9 154.9 154.2 160.0 158.2 158.4 158.4 160.5 162.1 166.0 Food, beverages, cigarettes and tobacco 153.3 144.8 145.7 151.7 149.4 152.3 152.1 149.9 155.0 153.4 154.3 154.4 154.9 156.9 158.9 Housing, electricity, gas and fuel 142.8 131.8 132.2 140.2 143.0 144.1 144.5 142.0 148.5 150.8 154.3 155.7 155.4 153.2 153.1 Clothing 140.6 129.5 130.9 137.9 136.6 140.8 141.9 139.0 144.0 141.7 137.4 140.5 139.9 140.1 144.4 Health 141.9 133.9 130.7 136.2 135.4 137.7 136.6 132.5 139.0 140.2 136.7 138.1 138.9 140.0 140.8 Transportations, communications and financial services 138.6 123.4 117.9 130.5 133.7 138.0 138.9 136.9 143.2 143.4 143.9 142.6 143.9 142.8 145.5 Education, recreation, and sports 145.8 138.7 136.4 141.0 139.0 139.0 139.8 134.9 139.8 141.0 138.6 143.1 144.7 146.2 147.7
D Economic Indicator within 6 Months
Avaibility of Goods & Services 118.7 116.1 121.2 120.4 123.7 130.9 134.0 137.2 140.0 138.6 136.4 132.7 133.5 138.3 134.2 Saving Interest Rate 114.8 111.5 111.0 113.4 112.3 110.6 114.2 115.8 117.7 115.2 113.3 115.4 116.3 117.9 114.9 Current savings 88.6 89.2 93.1 93.1 98.1 101.0 103.0 107.5 107.8 104.4 104.7 106.6 105.9 106.4 105.2 Savings for 6 months hence 110.3 112.7 114.4 115.7 118.8 121.0 121.6 129.9 127.6 125.0 125.9 128.2 126.7 129.8 125.6
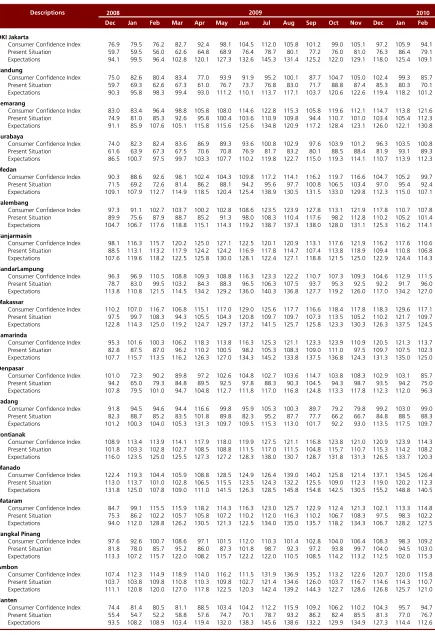
Table 2. Consumer Confidence Index by City
2008 2010
Dec Jan Feb Mar Apr May Jun Jul Aug Sep Oct Nov Dec Jan Feb
DKI Jakarta
Consumer Confidence Index 76.9 79.5 76.2 82.7 92.4 98.1 104.5 112.0 105.8 101.2 99.0 105.1 97.2 105.9 94.1 Present Situation 59.7 59.5 56.0 62.6 64.8 68.9 76.4 78.7 80.1 77.2 76.0 81.0 76.3 86.4 79.1 Expectations 94.1 99.5 96.4 102.8 120.1 127.3 132.6 145.3 131.4 125.2 122.0 129.1 118.0 125.4 109.1
Bandung
Consumer Confidence Index 75.0 82.6 80.4 83.4 77.0 93.9 91.9 95.2 100.1 87.7 104.7 105.0 102.4 99.3 85.7 Present Situation 59.7 69.3 62.6 67.3 61.0 76.7 73.7 76.8 83.0 71.7 88.8 87.4 85.3 80.3 70.1 Expectations 90.3 95.8 98.3 99.4 93.0 111.2 110.1 113.7 117.1 103.7 120.6 122.6 119.4 118.2 101.2
Semarang
Consumer Confidence Index 83.0 83.4 96.4 98.8 105.8 108.0 114.6 122.8 115.3 105.8 119.6 112.1 114.7 113.8 121.6 Present Situation 74.9 81.0 85.3 92.6 95.8 100.4 103.6 110.9 109.8 94.4 110.7 101.0 103.4 105.4 112.3 Expectations 91.1 85.9 107.6 105.1 115.8 115.6 125.6 134.8 120.9 117.2 128.4 123.1 126.0 122.1 130.8
Surabaya
Consumer Confidence Index 74.0 82.3 82.4 83.6 86.9 89.3 93.6 100.8 102.9 97.6 103.9 101.2 96.3 103.5 100.8 Present Situation 61.6 63.9 67.3 67.5 70.6 70.8 76.9 81.7 83.2 80.1 88.5 88.4 81.9 93.1 89.3 Expectations 86.5 100.7 97.5 99.7 103.3 107.7 110.2 119.8 122.7 115.0 119.3 114.1 110.7 113.9 112.3
Medan
Consumer Confidence Index 90.3 88.6 92.6 98.1 102.4 104.3 109.8 117.2 114.1 116.2 119.7 116.6 104.7 105.2 99.7 Present Situation 71.5 69.2 72.6 81.4 86.2 88.1 94.2 95.6 97.7 100.8 106.5 103.4 97.0 95.4 92.4 Expectations 109.1 107.9 112.7 114.9 118.5 120.4 125.4 138.9 130.5 131.5 133.0 129.8 112.3 115.0 107.1
Palembang
Consumer Confidence Index 97.3 91.1 102.7 103.7 100.2 102.8 108.6 123.5 123.9 127.8 113.1 121.9 117.8 110.7 107.8 Present Situation 89.9 75.6 87.9 88.7 85.2 91.3 98.0 108.3 110.4 117.6 98.2 112.8 110.2 105.2 101.4 Expectations 104.7 106.7 117.6 118.8 115.1 114.3 119.2 138.7 137.3 138.0 128.0 131.1 125.3 116.2 114.1
Banjarmasin
Consumer Confidence Index 98.1 116.3 115.7 120.2 125.0 127.1 122.5 120.1 120.9 113.1 117.6 121.9 116.2 117.6 110.6 Present Situation 88.5 113.1 113.2 117.9 124.2 124.2 116.9 117.8 114.7 107.4 113.8 118.9 109.4 110.8 106.8 Expectations 107.6 119.6 118.2 122.5 125.8 130.0 128.1 122.4 127.1 118.8 121.5 125.0 122.9 124.4 114.3
BandarLampung
Consumer Confidence Index 96.3 96.9 110.5 108.8 109.3 108.8 116.3 123.3 122.2 110.7 107.3 109.3 104.6 112.9 111.5 Present Situation 78.7 83.0 99.5 103.2 84.3 88.3 96.5 106.3 107.5 93.7 95.3 92.5 92.2 91.7 96.0 Expectations 113.8 110.8 121.5 114.5 134.2 129.2 136.0 140.3 136.8 127.7 119.2 126.0 117.0 134.2 127.0
Makassar
Consumer Confidence Index 110.2 107.0 116.7 106.8 115.1 117.0 129.0 125.6 117.7 116.6 118.4 117.8 118.3 129.6 117.1 Present Situation 97.5 99.7 108.3 94.3 105.5 104.3 120.8 109.7 109.7 107.3 113.5 105.2 110.2 121.7 109.7 Expectations 122.8 114.3 125.0 119.2 124.7 129.7 137.2 141.5 125.7 125.8 123.3 130.3 126.3 137.5 124.5
Samarinda
Consumer Confidence Index 95.3 101.6 100.3 106.2 118.3 113.8 116.3 125.3 121.1 123.3 123.9 110.9 120.5 121.3 113.7 Present Situation 82.8 87.5 87.0 96.2 110.2 100.5 98.2 105.3 108.3 109.0 111.0 97.5 109.7 107.5 102.3 Expectations 107.7 115.7 113.5 116.2 126.3 127.0 134.3 145.2 133.8 137.5 136.8 124.3 131.3 135.0 125.0
Denpasar
Consumer Confidence Index 101.0 72.3 90.2 89.8 97.2 102.6 104.8 102.7 103.6 114.7 103.8 108.3 102.9 103.1 85.7 Present Situation 94.2 65.0 79.3 84.8 89.5 92.5 97.8 88.3 90.3 104.5 94.3 98.7 93.5 94.2 75.0 Expectations 107.8 79.5 101.0 94.7 104.8 112.7 111.8 117.0 116.8 124.8 113.3 117.8 112.3 112.0 96.3
Padang
Consumer Confidence Index 91.8 94.5 94.6 94.4 116.6 99.8 95.9 105.3 100.3 89.7 79.2 79.8 99.2 103.0 99.0 Present Situation 82.3 88.7 85.2 83.5 101.8 89.8 82.3 95.2 87.7 77.7 66.2 66.7 84.8 88.5 88.3 Expectations 101.2 100.3 104.0 105.3 131.3 109.7 109.5 115.3 113.0 101.7 92.2 93.0 113.5 117.5 109.7
Pontianak
Consumer Confidence Index 108.9 113.4 113.9 114.1 117.9 118.0 119.9 127.5 121.1 116.8 123.8 121.0 120.9 123.9 114.3 Present Situation 101.8 103.3 102.8 102.7 108.5 108.8 111.5 117.0 111.5 104.8 115.7 110.7 115.3 114.2 108.2 Expectations 116.0 123.5 125.0 125.5 127.3 127.2 128.3 138.0 130.7 128.7 131.8 131.3 126.5 133.7 120.3
Manado
Consumer Confidence Index 122.4 119.3 104.4 105.9 108.8 128.5 124.9 126.4 139.0 140.2 125.8 121.4 137.1 134.5 126.4 Present Situation 113.0 113.7 101.0 102.8 106.5 115.5 123.5 124.3 132.2 125.5 109.0 112.3 119.0 120.2 112.3 Expectations 131.8 125.0 107.8 109.0 111.0 141.5 126.3 128.5 145.8 154.8 142.5 130.5 155.2 148.8 140.5
Mataram
Consumer Confidence Index 84.7 99.1 115.5 115.9 118.2 114.3 116.3 123.0 125.7 122.9 112.4 121.3 102.1 113.3 114.8 Present Situation 75.3 86.2 102.2 105.7 105.8 107.2 110.2 112.0 116.3 110.2 106.7 108.3 97.5 98.3 102.2 Expectations 94.0 112.0 128.8 126.2 130.5 121.3 122.5 134.0 135.0 135.7 118.2 134.3 106.7 128.2 127.5
Pangkal Pinang
Consumer Confidence Index 97.6 92.6 100.7 108.6 97.1 101.5 112.0 110.3 101.4 102.8 104.0 106.4 108.3 98.3 109.2 Present Situation 81.8 78.0 85.7 95.2 86.0 87.3 101.8 98.7 92.3 97.2 93.8 99.7 104.0 94.5 103.0 Expectations 113.3 107.2 115.7 122.0 108.2 115.7 122.2 122.0 110.5 108.5 114.2 113.2 112.5 102.0 115.3
Ambon
Consumer Confidence Index 107.4 112.3 114.9 118.9 114.0 116.2 111.5 131.9 136.9 135.2 113.2 122.6 120.7 120.0 115.8 Present Situation 103.7 103.8 109.8 110.8 110.3 109.8 102.7 121.4 134.6 126.0 103.7 116.7 114.6 114.3 110.7 Expectations 111.1 120.8 120.0 127.0 117.8 122.5 120.3 142.4 139.2 144.3 122.7 128.6 126.8 125.7 121.0
Banten
Consumer Confidence Index 74.4 81.4 80.5 81.1 88.5 103.4 104.2 112.2 115.9 109.2 106.2 110.2 104.3 95.7 94.7 Present Situation 55.4 54.7 52.2 58.8 57.6 74.7 70.1 78.7 93.2 86.2 82.4 85.5 81.3 77.0 76.7 Expectations 93.5 108.2 108.9 103.4 119.4 132.0 138.3 145.6 138.6 132.2 129.9 134.9 127.3 114.4 112.6
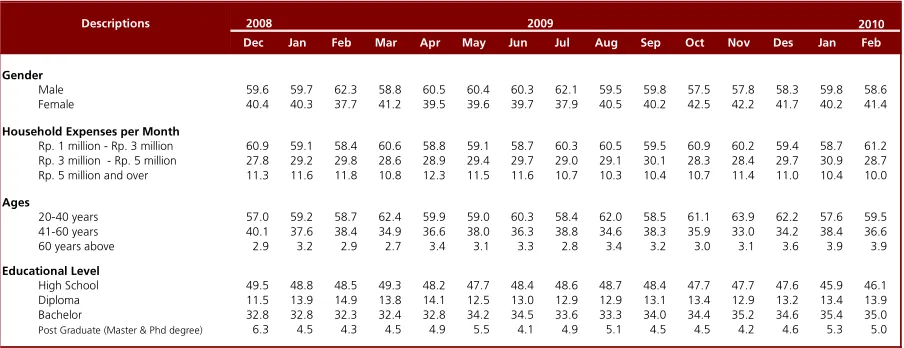
Table 3. Respondent Attributes (percentages)
2008 2010
Dec Jan Feb Mar Apr May Jun Jul Aug Sep Oct Nov Des Jan Feb
Gender
Male 59.6 59.7 62.3 58.8 60.5 60.4 60.3 62.1 59.5 59.8 57.5 57.8 58.3 59.8 58.6 Female 40.4 40.3 37.7 41.2 39.5 39.6 39.7 37.9 40.5 40.2 42.5 42.2 41.7 40.2 41.4
Household Expenses per Month
Rp. 1 million - Rp. 3 million 60.9 59.1 58.4 60.6 58.8 59.1 58.7 60.3 60.5 59.5 60.9 60.2 59.4 58.7 61.2 Rp. 3 million - Rp. 5 million 27.8 29.2 29.8 28.6 28.9 29.4 29.7 29.0 29.1 30.1 28.3 28.4 29.7 30.9 28.7 Rp. 5 million and over 11.3 11.6 11.8 10.8 12.3 11.5 11.6 10.7 10.3 10.4 10.7 11.4 11.0 10.4 10.0
Ages
20-40 years 57.0 59.2 58.7 62.4 59.9 59.0 60.3 58.4 62.0 58.5 61.1 63.9 62.2 57.6 59.5 41-60 years 40.1 37.6 38.4 34.9 36.6 38.0 36.3 38.8 34.6 38.3 35.9 33.0 34.2 38.4 36.6 60 years above 2.9 3.2 2.9 2.7 3.4 3.1 3.3 2.8 3.4 3.2 3.0 3.1 3.6 3.9 3.9
Educational Level
High School 49.5 48.8 48.5 49.3 48.2 47.7 48.4 48.6 48.7 48.4 47.7 47.7 47.6 45.9 46.1 Diploma 11.5 13.9 14.9 13.8 14.1 12.5 13.0 12.9 12.9 13.1 13.4 12.9 13.2 13.4 13.9 Bachelor 32.8 32.8 32.3 32.4 32.8 34.2 34.5 33.6 33.3 34.0 34.4 35.2 34.6 35.4 35.0 Post Graduate (Master & Phd degree) 6.3 4.5 4.3 4.5 4.9 5.5 4.1 4.9 5.1 4.5 4.5 4.2 4.6 5.3 5.0