August 2010
Consumer Confidence Index (CCI) in August 2010 weakens 1.7
points to the level of 104.0. Both components of the CCI posted
declines. The component measuring consumer perception towards
current condition plunged by 2,8 points and component measuring
consumer expectation for the 6 months ahead slightly reduced by
0.5 point.
Consumers believed that inflationary pressure will ease in the next
3 and 6 months as indicated on the price expectation index that
dropped by 5.1 and 8.6 points. The deteriorating prices were
attributable to the decrease in foodstuff and housing, electricity,
gas & fuels.
Consumer Confidence Index
Consumer Confidence Index (CCI) in August 2010 dismounted
.
Following a reduction in July 2010 by 5.7 points, CCI walked down further.
The index plummeted 1.7 points to 104.0. The descending CCI was due to
consumer’s wipe perception on current economic conditions and the
expectation for the next 6 months as the index declined by 2.8 and 0.5 points.
Graph 1. Consumer Confidence Index
60.0
70.0
80.0
90.0
100.0
110.0
120.0
130.0
140.0
1 2 3 4 5 6 7 8 9 10 11 12 1 2 3 4 5 6 7 8 9 10 11 12 1 2 3 4 5 6 7 8
2008 2009 2010
(Index)
Current Economic Condition Index
Consumer Expectation Index
Consumer Confidence Index
Optimistic
Pessimistic
Fuels Hike
Global Economic
Crisis
The down warding on CCI was indicated due to the implementation
of government price policy on electricity tariff effective since 1
stof July 2010
and seasonal factor regarding fasting month that was likely levitate
respondent’s expenditure so that consumers prone to cut down their expenses
on durable goods.
CONSUMER SURVEY
Consumer Confidence Index
slipped down
Methodology
Compared to the same period on last year, consumer
confidence on economic condition grew weaker
. CCI in reporting month
was 10.3 points lessen from the same period in previous year. The
decelerating on consumer’s expectation index and economic condition index
that eased by 13.4 and 7.2 points respectively were attributable to the
downwarding CCI.
Current Economic Condition Index
Respondents were more pessimistic over current economic
condition against previous month.
Respondents pessimistic on current
economic condition were revealed from Current Economic Condition Index
(CECI) which down 2.8 points over previous month and 7.2 points against
previous year to the level of 93.3.
The survey reported that 2 of 3 current economic condition indicators
were tumbled down. Rising consumer’s expenditure on basic needs until
August 2010 has apparently dampening consumer’s purchasing power, thus,
they tend to hold their desire to consume durable goods. In the meantime,
household consumers considered that job availability in this time is broader
than in previous month.
Compared to the preceding year, the survey also stated that
consumer’s current income, consumer’s intention in buying durable goods
and jobs availability were lower.
Graph 2. Current Economic Condition Index (CECI
0.0
20.0
40.0
60.0
80.0
100.0
120.0
140.0
1
2
3
4
5
6
7
8
9 10 11 12 1
2
3
4
5
6
7
8
9 10 11 12 1
2
3
4
5
6
7
8
2008
2009
2010
Index
Current Economic Conditions Index
Current Incomes
Buying Durable Goods Conditions
Job Availability
Consumers were going to be
Consumer Expectation Index
Consumer’s expectation in the next 6 months remained in the
optimistic level although it was lower than previous month.
The
weakening consumer’s optimism as seen on Consumer Expectation Index (CEI)
was substantially encouraged by lowering optimism on economic condition
for the next 6 months by 2.6 points. Eventually, CEI was 0.5 point lower than
previous month. Consumers were still upbeat that their income in the next 6
months will be higher than their current income. Meanwhile, consumers
concluded that job availability in the next 6 months remain the same with the
previous month’s expectation at the level of 100.7.
In line with the weakening consumer’s purchasing power to satisfy
their needs during July-August 2010, they predicted that there will be a
higher pressure on economic condition in the future as indicated by
dismounting the economic expectation index in the next 6 months.
Expectation indexes on economic, incomes, and job availability in
August 2010 were significantly plummeted compared to the same period in
preceding year. The deepest downward was on economic condition by 25.4
points. Meanwhile, optimism on incomes and job availability also jumped
down by 4.7 and 10.0 points.
Graph. 3
Consumer Expectation Index (CEI)
0.0
20.0
40.0
60.0
80.0
100.0
120.0
140.0
160.0
1
2 3
4
5
6
7 8
9 10 11 12 1
2
3
4
5 6
7
8
9 10 11 12 1
2
3 4
5
6
7 8
2008
2009
2010
Index
Consumer Expectation Index
Incomes Expectation
Economic Expectation
Job Availability Expectation
Income Expectations
Consumers were remain confident towards incomes for the next
6 months.
The optimism was reflected on the stability of income expectation
index at the level of 133.6. Classified by education background, those who
pass their post graduated were more optimistic that their income will arise in
the next 6 months.
Price Expectations
Respondents believed that inflationary pressure will soften over
the next 6 months.
The expectation was based on dampening price
expectation index in the next 3 and 6 months by 5.1 and 8.6 points respectively.
According to respondents, diminishing pressure on prices in the next 3 and 6
months will primarily happen on housing, electricity, and gas, & fuels group as
the index fell 7.2 and 9.8 points. Pressure on prices also predicted to happen on
foodstuff which the index down 3.9 and 8.4 points for the next 3 and 6
months. Downturn trend on price that usually occurred after fasting month and
prediction on welcoming harvest time in several months have apparently
endorsed consumer’s optimism on foodstuff price to be lower in the next 3
months.
Graph 4.
Price Expectation Index for the next 3 and 6 months
‐
1.00
0.00
1.00
2.00
3.00
4.00
5.00
6.00
130.0
140.0
150.0
160.0
170.0
180.0
190.0
200.0
1 2 3 4 5 6 7 8 9 101112 1 2 3 4 5 6 7 8 9 101112 1 2 3 4 5 6 7 8 9 101112 1 2
2008
2009
2010
2010
Price
Expectation
Index
3
months
ahead
Price
Expectation
Index
6
months
ahead
Cummulative
Inflations
in
3
months
(Index)
(
%
)
Notes
: Index = 100 indicates that consumer expect prices will still be stable, index > 100 indicates
consumer expect prices will increase, and index < 100 indicates consumer expect prices will decrease
Expectations of Savings and Interest Rates
Although saving interest rate in the next 6 months was
predicted to rise, consumers were less optimistic on saving amount in
the next 6 months.
The survey also revealed that
saving interest rate
expectation index for the next 6 months advanced by 1.9 points to 119.8.
Pressure on prices in the
next 3 and 6 months are
weakening
Although consumers believed that saving interest rate will mount in the next 6
months, consumers were not quite confident over saving amount in the next 6
months due to the rising expenditure until August 2010. The index dropped
1.3 points against previous month.
Graph. 5
Expectation Indexes on Interest Rates and Total Savings in the next 6 months
0
5
10
15
20
25
90
100
110
120
130
140
1 2 3 4 5 6 7 8 9 101112 1 2 3 4 5 6 7 8 9 101112 1 2 3 4 5 6 7 8 9 101112 1 2
2008
2009
2010
2011
Savings
Growth
in
6
months
Interest
Rates
Expectation
Index
in
6
months
ahead
Savings
Expectation
Index
in
6
months
ahead
Index
(%)
Notes
: Index = 100 indicates that consumer expect saving deposit and interest rate will still be
stable, index > 100 indicates consumer expect saving deposit and interest rate will increase, and
index < 100 indicates consumer expect saving deposit and interest rate will decrease
Expectations on Economic Conditions
Respondents tend to be optimistic over economic condition for
the next 6 months although slight downward trend.
Weakening
expectation was reflected by declining index by 2.6 points over previous month
to the level of 110.0 in August 2010. Classified by age, worsening economic
condition expectation in the next 6 months was most come from those who
are 20-40 years old.
Table 1. Consumer Confidence, Price Expectations, Consumption Plans, and Economic Indicators (Index)
Jul Aug Sep Oct Nov Dec Jan Feb Mar Apr May Jun Jul Aug
A Consumer Confidence Index (CCI) 115.44 114.33 110.84 110.01 111.00 108.66 110.5 105.3 107.4 110.7 109.9 111.4 105.7 104.0 Present Situation (CECI) 98.55 100.49 96.59 96.78 97.71 96.67 98.4 94.7 96.4 99.6 100.0 101.4 96.1 93.3 Expectations (CEI) 132.34 128.17 125.09 123.24 124.28 120.65 122.6 115.9 118.5 121.7 119.8 121.3 115.3 114.8 Appraisal of Present Situation
Current Incomes 129.46 127.52 123.97 124.93 124.11 123.13 125.5 118.6 121.7 126.1 124.4 126.2 120.6 117.7 Buying durable goods Conditions 83.66 87.64 81.28 82.21 84.90 81.12 85.2 87.3 85.3 87.5 89.6 91.4 86.8 80.5 Employment Conditions 82.53 86.31 84.53 83.20 84.13 85.76 84.5 78.0 82.1 85.3 85.9 86.7 80.9 81.7 (before Oct 2004: Unemployment Condition)
Expectations for 6 Months Hence of
Incomes 142.93 138.34 138.48 137.32 139.28 136.75 141.1 132.5 135.3 136.7 134.7 137.4 132.6 133.6 Economic Conditions 138.94 135.44 130.35 127.28 128.77 122.11 122.7 114.4 117.7 122.2 119.5 122.3 112.6 110.0 Employment Conditions 115.14 110.71 106.42 105.11 104.81 103.10 103.9 100.8 102.4 106.3 105.2 104.2 100.7 100.7 (before Oct 2004: Unemployment Expectation)
B Price Expectations for 3 Months Hence of
Prices 154.76 163.75 165.21 158.76 159.89 161.00 160.60 160.20 155.10 158.60 164.30 166.8 180.5 175.4 Foodstuff 158.24 168.18 167.00 160.80 160.64 162.97 163.50 163.40 156.00 159.60 164.20 167.8 181.2 177.2 Food, beverages, cigarettes and tobacco 151.28 160.99 161.00 154.94 155.77 157.15 156.40 155.00 149.90 153.50 156.50 160.1 170.4 170.2 Housing, electricity, gas and fuel 141.57 148.85 155.20 155.96 156.58 156.32 152.00 151.50 148.10 155.30 158.10 161.2 175.1 167.8 Clothing 142.47 152.65 150.16 138.56 139.34 137.95 135.50 136.40 131.20 133.70 142.10 148.8 155.9 156.3 Health 132.07 139.61 140.64 135.38 136.63 137.91 135.90 136.10 133.90 133.60 138.80 141.0 146.6 146.0 Transportations, communications and financial services 136.71 145.62 146.85 142.60 142.25 141.35 137.50 137.90 134.30 136.40 142.00 149.6 157.4 155.6 Education, recreation, and sports 135.34 141.12 141.34 137.28 138.96 140.05 138.00 137.20 138.20 141.40 145.90 149.4 154.9 151.0 C Price Expectations for 6 Months Hence of
Prices 152.23 156.46 156.95 156.24 157.92 158.80 161.20 164.30 161.10 159.30 162.50 163.1 170.1 161.5 Foodstuff 154.18 160.01 158.23 158.42 158.39 160.51 162.10 166.00 161.70 160.50 163.00 164.1 171.0 162.5 Food, beverages, cigarettes and tobacco 149.88 155.05 153.36 154.25 154.44 154.89 156.90 158.90 156.70 154.50 158.00 157.9 163.5 157.9 Housing, electricity, gas and fuel 141.95 148.55 150.84 154.32 155.72 155.40 153.20 153.10 148.60 154.10 157.30 157.3 165.8 156.0 Clothing 138.97 144.01 141.71 137.41 140.52 139.90 140.10 144.40 143.10 140.30 145.20 147.1 148.4 145.2 Health 132.55 139.03 140.19 136.73 138.06 138.87 140.00 140.80 136.70 137.20 139.10 141.2 146.5 139.2 Transportations, communications and financial services 136.95 143.20 143.37 143.86 142.59 143.90 142.80 145.50 143.60 144.90 147.30 148.3 153.0 147.9 Education, recreation, and sports 134.87 139.80 140.98 138.61 143.10 144.73 146.20 147.70 145.30 144.20 146.10 146.1 150.8 144.2 D Economic Indicator within 6 Months
Avaibility of Goods & Services 137.18 139.97 138.59 136.40 132.70 133.48 138.30 134.20 135.50 137.60 138.70 141.5 140.0 136.4 Interest Rate 115.76 117.71 115.20 113.34 115.44 116.31 117.90 114.90 117.00 116.20 117.10 117.8 117.9 119.8 Current savings 107.50 107.85 104.44 104.70 106.58 105.94 106.40 105.20 106.90 105.00 105.80 106.5 103.7 103.0 Savings for 6 months hence 129.87 127.63 124.99 125.93 128.21 126.75 129.80 125.60 126.20 127.00 125.00 127.3 124.3 123.0
2010
Descriptions 2009
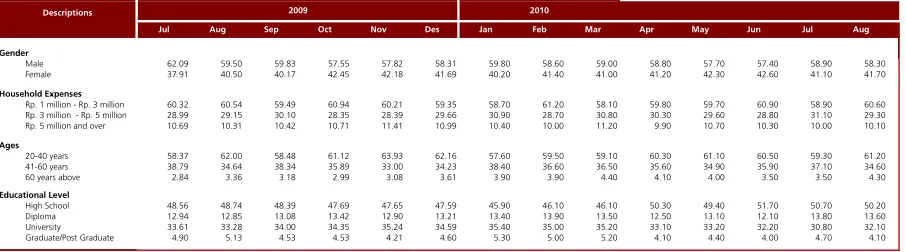
Table 2. Respondent Figures (percentages)
Jul Aug Sep Oct Nov Des Jan Feb Mar Apr May Jun Jul Aug
Gender
Male 62.09 59.50 59.83 57.55 57.82 58.31 59.80 58.60 59.00 58.80 57.70 57.40 58.90 58.30 Female 37.91 40.50 40.17 42.45 42.18 41.69 40.20 41.40 41.00 41.20 42.30 42.60 41.10 41.70 Household Expenses
Rp. 1 million - Rp. 3 million 60.32 60.54 59.49 60.94 60.21 59.35 58.70 61.20 58.10 59.80 59.70 60.90 58.90 60.60 Rp. 3 million - Rp. 5 million 28.99 29.15 30.10 28.35 28.39 29.66 30.90 28.70 30.80 30.30 29.60 28.80 31.10 29.30 Rp. 5 million and over 10.69 10.31 10.42 10.71 11.41 10.99 10.40 10.00 11.20 9.90 10.70 10.30 10.00 10.10 Ages
20-40 years 58.37 62.00 58.48 61.12 63.93 62.16 57.60 59.50 59.10 60.30 61.10 60.50 59.30 61.20 41-60 years 38.79 34.64 38.34 35.89 33.00 34.23 38.40 36.60 36.50 35.60 34.90 35.90 37.10 34.60 60 years above 2.84 3.36 3.18 2.99 3.08 3.61 3.90 3.90 4.40 4.10 4.00 3.50 3.50 4.30 Educational Level
High School 48.56 48.74 48.39 47.69 47.65 47.59 45.90 46.10 46.10 50.30 49.40 51.70 50.70 50.20 Diploma 12.94 12.85 13.08 13.42 12.90 13.21 13.40 13.90 13.50 12.50 13.10 12.10 13.80 13.60 University 33.61 33.28 34.00 34.35 35.24 34.59 35.40 35.00 35.20 33.10 33.20 32.20 30.80 32.10 Graduate/Post Graduate 4.90 5.13 4.53 4.53 4.21 4.60 5.30 5.00 5.20 4.10 4.40 4.00 4.70 4.10
2010
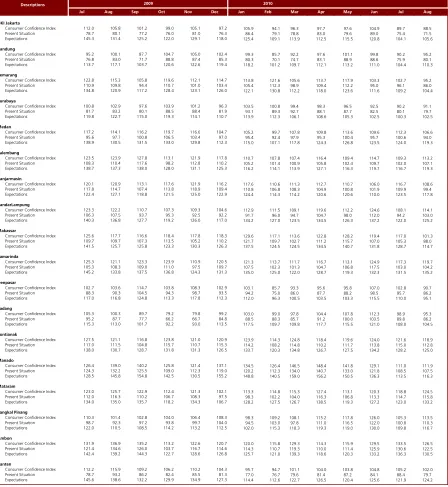
Table 3. Consumer Confidence by Region (Index)
Jul Aug Sep Oct Nov Dec Jan Feb Mar Apr May Jun Jul Aug
DKI Jakarta
Consumer Confidence Index 112.0 105.8 101.2 99.0 105.1 97.2 105.9 94.1 96.3 97.7 97.6 104.9 89.7 88.5 Present Situation 78.7 80.1 77.2 76.0 81.0 76.3 86.4 79.1 78.8 83.0 79.6 89.0 75.4 71.5 Expectations 145.3 131.4 125.2 122.0 129.1 118.0 125.4 109.1 113.9 112.5 115.5 120.8 104.1 105.6 Bandung
Consumer Confidence Index 95.2 100.1 87.7 104.7 105.0 102.4 99.3 85.7 92.2 97.6 101.1 99.8 90.2 95.2 Present Situation 76.8 83.0 71.7 88.8 87.4 85.3 80.3 70.1 74.7 83.1 88.9 88.6 75.9 80.1 Expectations 113.7 117.1 103.7 120.6 122.6 119.4 118.2 101.2 109.7 112.1 113.2 111.0 104.4 110.3 Semarang
Consumer Confidence Index 122.8 115.3 105.8 119.6 112.1 114.7 113.8 121.6 105.6 113.7 117.9 103.3 102.7 95.2 Present Situation 110.9 109.8 94.4 110.7 101.0 103.4 105.4 112.3 98.9 109.4 112.2 95.0 96.1 86.0 Expectations 134.8 120.9 117.2 128.4 123.1 126.0 122.1 130.8 112.2 118.0 123.6 111.6 109.2 104.4 Surabaya
Consumer Confidence Index 100.8 102.9 97.6 103.9 101.2 96.3 103.5 100.8 99.4 98.3 96.5 92.5 90.2 91.1 Present Situation 81.7 83.2 80.1 88.5 88.4 81.9 93.1 89.3 92.7 88.1 87.7 82.5 80.1 79.7 Expectations 119.8 122.7 115.0 119.3 114.1 110.7 113.9 112.3 106.1 108.6 105.3 102.5 100.3 102.5 Medan
Consumer Confidence Index 117.2 114.1 116.2 119.7 116.6 104.7 105.2 99.7 107.8 109.8 113.6 109.6 112.3 106.6 Present Situation 95.6 97.7 100.8 106.5 103.4 97.0 95.4 92.4 97.9 95.3 100.4 95.7 100.6 94.0 Expectations 138.9 130.5 131.5 133.0 129.8 112.3 115.0 107.1 117.8 124.3 126.8 123.5 124.0 119.3 Palembang
Consumer Confidence Index 123.5 123.9 127.8 113.1 121.9 117.8 110.7 107.8 107.4 116.4 109.4 114.7 109.3 113.2 Present Situation 108.3 110.4 117.6 98.2 112.8 110.2 105.2 101.4 100.9 105.8 102.4 109.7 102.0 107.1 Expectations 138.7 137.3 138.0 128.0 131.1 125.3 116.2 114.1 113.9 127.1 116.3 119.7 116.7 119.3 Banjarmasin
Consumer Confidence Index 120.1 120.9 113.1 117.6 121.9 116.2 117.6 110.6 111.3 112.7 110.7 106.0 116.7 108.6 Present Situation 117.8 114.7 107.4 113.8 118.9 109.4 110.8 106.8 108.3 104.9 100.8 101.9 109.9 99.4 Expectations 122.4 127.1 118.8 121.5 125.0 122.9 124.4 114.3 114.2 120.6 120.6 110.0 123.5 117.8 BandarLampung
Consumer Confidence Index 123.3 122.2 110.7 107.3 109.3 104.6 112.9 111.5 109.1 119.6 112.2 124.6 108.1 114.1 Present Situation 106.3 107.5 93.7 95.3 92.5 92.2 91.7 96.0 94.7 104.7 98.0 112.0 94.2 103.0 Expectations 140.3 136.8 127.7 119.2 126.0 117.0 134.2 127.0 123.5 134.5 126.3 137.2 122.0 125.2 Makassar
Consumer Confidence Index 125.6 117.7 116.6 118.4 117.8 118.3 129.6 117.1 113.6 122.8 128.2 119.4 117.0 101.3 Present Situation 109.7 109.7 107.3 113.5 105.2 110.2 121.7 109.7 102.7 111.2 115.7 107.0 105.3 88.0 Expectations 141.5 125.7 125.8 123.3 130.3 126.3 137.5 124.5 124.5 134.5 140.7 131.8 128.7 114.7 Samarinda
Consumer Confidence Index 125.3 121.1 123.3 123.9 110.9 120.5 121.3 113.7 111.7 116.7 113.1 124.9 117.3 119.7 Present Situation 105.3 108.3 109.0 111.0 97.5 109.7 107.5 102.3 101.3 104.7 106.8 117.5 103.0 104.2 Expectations 145.2 133.8 137.5 136.8 124.3 131.3 135.0 125.0 122.0 128.7 119.3 132.3 131.5 135.2 Denpasar
Consumer Confidence Index 102.7 103.6 114.7 103.8 108.3 102.9 103.1 85.7 93.3 95.6 95.8 107.0 102.8 90.7 Present Situation 88.3 90.3 104.5 94.3 98.7 93.5 94.2 75.0 86.0 87.7 88.2 98.5 95.7 86.2 Expectations 117.0 116.8 124.8 113.3 117.8 112.3 112.0 96.3 100.5 103.5 103.3 115.5 110.0 95.1 Padang
Consumer Confidence Index 105.3 100.3 89.7 79.2 79.8 99.2 103.0 99.0 97.8 104.4 107.8 112.3 98.9 95.3 Present Situation 95.2 87.7 77.7 66.2 66.7 84.8 88.5 88.3 85.7 91.2 100.0 103.5 89.8 86.2 Expectations 115.3 113.0 101.7 92.2 93.0 113.5 117.5 109.7 109.8 117.7 115.5 121.0 108.0 104.5 Pontianak
Consumer Confidence Index 127.5 121.1 116.8 123.8 121.0 120.9 123.9 114.3 124.8 118.4 119.6 124.0 121.6 118.9 Present Situation 117.0 111.5 104.8 115.7 110.7 115.3 114.2 108.2 114.8 110.2 111.7 113.8 115.0 112.8 Expectations 138.0 130.7 128.7 131.8 131.3 126.5 133.7 120.3 134.8 126.7 127.5 134.2 128.2 125.0 Manado
Consumer Confidence Index 126.4 139.0 140.2 125.8 121.4 137.1 134.5 126.4 146.5 148.4 141.8 129.1 111.0 111.9 Present Situation 124.3 132.2 125.5 109.0 112.3 119.0 120.2 112.3 134.0 140.7 133.0 121.8 108.5 107.5 Expectations 128.5 145.8 154.8 142.5 130.5 155.2 148.8 140.5 159.0 156.2 150.5 136.3 113.5 116.3 Mataram
Consumer Confidence Index 123.0 125.7 122.9 112.4 121.3 102.1 113.3 114.8 115.3 127.4 113.1 120.3 118.8 124.5 Present Situation 112.0 116.3 110.2 106.7 108.3 97.5 98.3 102.2 104.0 116.3 106.8 113.3 114.7 115.8 Expectations 134.0 135.0 135.7 118.2 134.3 106.7 128.2 127.5 126.7 138.5 119.3 127.2 123.0 133.2 Pangkal Pinang
Consumer Confidence Index 110.3 101.4 102.8 104.0 106.4 108.3 98.3 109.2 108.1 115.2 117.8 126.0 105.3 113.5 Present Situation 98.7 92.3 97.2 93.8 99.7 104.0 94.5 103.0 97.8 111.0 116.5 122.0 100.8 110.3 Expectations 122.0 110.5 108.5 114.2 113.2 112.5 102.0 115.3 118.3 119.3 119.0 130.0 109.8 116.7 Ambon
Consumer Confidence Index 131.9 136.9 135.2 113.2 122.6 120.7 120.0 115.8 129.3 114.3 115.9 129.5 133.5 126.5 Present Situation 121.4 134.6 126.0 103.7 116.7 114.6 114.3 110.7 119.3 110.0 111.4 125.9 130.6 122.5 Expectations 142.4 139.2 144.3 122.7 128.6 126.8 125.7 121.0 139.3 118.6 120.3 133.2 136.3 130.5 Banten
Consumer Confidence Index 112.2 115.9 109.2 106.2 110.2 104.3 95.7 94.7 101.1 104.0 103.8 104.8 105.2 102.0 Present Situation 78.7 93.2 86.2 82.4 85.5 81.3 77.0 76.7 79.6 81.4 87.2 84.1 88.4 79.7 Expectations 145.6 138.6 132.2 129.9 134.9 127.3 114.4 112.6 122.7 126.5 120.4 125.6 121.9 124.2
2010