Spec Tool; an online education and research resource
S. Mamana, A. Shenfelda, S. Isaacsona and D. G. Blumberga
a
Earth and Planetary Image Facility, Geography and Environmental Development, Ben-Gurion University of the Negev, Beer Sheva, Israel.
Commission VII, WG VI/1
KEY WORDS: Spectral analysis, spectral resolution, web-based lesson
ABSTRACT:
Education and public outreach (EPO) activities related to remote sensing, space, planetary and geo-physics sciences have been developed widely in the Earth and Planetary Image Facility (EPIF) at Ben-Gurion University of the Negev, Israel. These programs aim to motivate the learning of geo-scientific and technologic disciplines. For over the past decade, the facility hosts research and outreach activities for researchers, local community, school pupils, students and educators. As software and data are neither available nor affordable, the EPIF Spec tool was created as a web-based resource to assist in initial spectral analysis as a need for researchers and students. The tool is used both in the academic courses and in the outreach education programs and enables a better understanding of the theoretical data of spectroscopy and Imaging Spectroscopy in a 'hands-on' activity.
This tool is available online and provides spectra visualization tools and basic analysis algorithms including Spectral plotting, Spectral angle mapping and Linear Unmixing. The tool enables to visualize spectral signatures from the USGS spectral library and additional spectra collected in the EPIF such as of dunes in southern Israel and from Turkmenistan. For researchers and educators, the tool allows loading collected samples locally for further analysis.
.
1. INTRODUCTION
Spectral analysis is one of the most widely used methods for data analysis in geo-sciences, oceanography, atmospheric science, astronomy and engineering. A main use of spectral analysis is applied when using remote sensing data [1]. Yet, what seems trivial for researchers is found difficult to understand and implement by students.
In this paper, Spec tool and its main functions are outlined and demonstrated for the purpose of web-based resource sharing in educational programs and collaborative research.
2. SPECTOOL
2.1 General background
The Earth and Planetary Image Facility (EPIF) is an interdisciplinary research facility hosting students with backgrounds from several academic disciplines including Geography, Electro-optics, Geology, Electrical Engineering, Computer Sciences, and Agriculture. The facility is located in the Department of Geography and Environmental Development in the Marcus campus of Ben-Gurion University of the Negev, Israel.
The EPIF Spec tool was developed to assist in initial spectral analysis. It provides spectra visualization tools and basic analysis algorithms including Spectral plotting, Spectral Angle Mapping and Linear Unmixing.
2.2 Technical properties
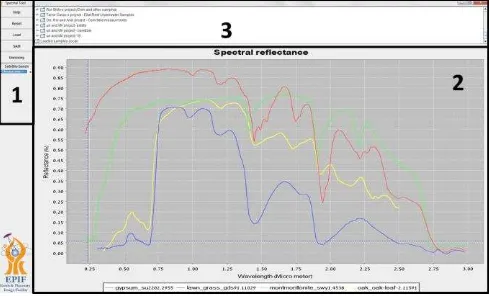
The graphical user interface is divided into three main display zones; 1) Activation buttons. 2) Spectral response (Reflectance) display at different wavelengths (micrometer). 3) Folders containing spectral libraries (Figure 1).
Figure 1. Spec tool GUI display.
2.2.1 Activation buttons
As shown in Fig.1, zone 1consisnts of five control buttons: 1. HELP menu providing an explanation of Spectral
Tool operating software (in Hebrew only).
2. Reset button "cleans" the graphic display of all spectra's that were presented earlier.
The International Archives of the Photogrammetry, Remote Sensing and Spatial Information Sciences, Volume XLI-B6, 2016 XXIII ISPRS Congress, 12–19 July 2016, Prague, Czech Republic
This contribution has been peer-reviewed.
3. Load button that opens the library computer and allows uploading of spectral signatures that are in the software directory or are on the local computer. 4. Spectral Angle Mapper SAM, is a physically-based
spectral analysis method that uses an n-D angle to match pixels to reference spectra [2]. The algorithm determines the spectral similarity between two spectras by calculating the angle between the spectra and treating them as vectors in a space with dimensionality equal to the number of bands. 5. Unmixing, in this software is a linear algorithm that
determines the relative abundance of materials that are depicted in a given spectra based on the materials’ spectral characteristics, in terms of which components of such material or of multiple materials and the quantitative relationship between them [3]. This function is based on preliminary knowledge of the components of the sample.
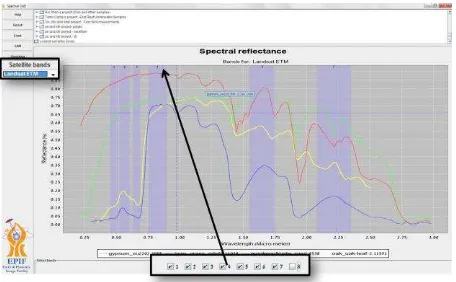
6. Available satellite channels; under this category opens a drop list of several sensors. Clicking on any sensor will display its channels\ wavelengths and their names (Fig. 2).
Figure 2. Available band list.
2.2.2 Loading and visualizing a spectra
2.2.2.1
USGS Spectral library V5a (online)This folder is displayed immediately with the emergence of the software is in Zone 3 (Fig.1), and contains the main spectral library. This library was produced by the USGS which took spectral samples tested of hundreds materials in laboratory conditions [4]. By double-clicking the folder a list of available libraries (apart from the USGS) are available. These folders contain spectral signatures of various materials. All main libraries are sub-divided according to basic materials such as minerals, rocks, vegetation, etc. By double-clicking any folder an additional list opens. Any of the substances selected will be displayed and graphically listed accordingly. One more "double click" on any folder or spectra will result in its closure.
2.2.2.2
Loaded Samples (local)One of the main advantages of this tool is the option to upload local spectral signatures retrieved from any device. The tool will accept the file in .DAT format.
Once loading a spectrum, it will be displayed as in Fig.3. Cruiser locater will supply essential information for any given wavelength its respective reflectance.
Figure 3. Display of Gypsum_su2202.2955. the blue coordinate system hinges allow precise visual examination of the
reflectance wavelength for each signature.
2.2.3 Spectral analysis
Spec tool offers three main analysis techniques that can be rapidly applied. 1. Spectral plotting. 2. SAM and 3. Spectral unmixing.
Spectral visualization allows the user to examine the available spectra; its main reflectance properties and main absorption features. Thus the discriminations of different substances are effortlessly presented and can be analysed. A significant advantage of Spec tool is the ability to display a hyperspectral signature in comparison to a multispectral sensor. EPIF uses this feature in order to demonstrate multi vs. hyper sensors in a "hands-on" activity. Thus for example, Fig.2 presents several hyperspectral signatures while Landsat ETM+ spectral bands are presented as well on the same plot. This allows the user to visually sense the compensations and drawbacks of each sensor. An additional hands-on activity that uses this feature is a task where pupils are asked to plan a mission using a satellite. Spec tool is than used and assists in the decision making of which sensor best fits their research aims and should be used. A more advanced option is the use of SAM and Unmixing. For the purpose of SAM analysis test spectra and reference spectra must be chosen. While for Spectral unmixing a number of substances that are presumed to be present in the test spectra must be initially chosen. This is applied in our academic courses and with more advanced high-school pupils. As opposed to expert based remote sensing software, pupils can perform this analysis without purchasing expansive software and with a friendly and intuitive interface.
3. CONCLUSIONS
In this paper, Spec tool's features and applications were presented. Hosting this tool in our academic courses and research as well as in our education and public outreach programs, greatly improved the learning and experience of users in a hand-on manner.
ACKNOWLEDGEMENTS
The authors wish to greatly thank Ms. Chen Meged for her assistance and insightful comments while testing Spec tool. The International Archives of the Photogrammetry, Remote Sensing and Spatial Information Sciences, Volume XLI-B6, 2016
XXIII ISPRS Congress, 12–19 July 2016, Prague, Czech Republic
This contribution has been peer-reviewed.
REFERENCES
[1] M. Borengasser, W. S. Hungate, and R. Watkins,
Hyperspectral remote sensing: principles and applications (Crc
Press, 2010).
[2] F. Kruse, A. Lefkoff, J. Boardman, K. Heidebrecht, A.
Shapiro, P. Barloon, and A. Goetz, Remote Sens. Environ. 44,
145 (1993).
[3] J. W. Boardman, (1989).
[4] R. N. Clark, G. A. Swayze, R. Wise, K. E. Livo, T. M.
Hoefen, R. F. Kokaly, and S. J. Sutley, USGS digital spectral
library splib06a (2007).
The International Archives of the Photogrammetry, Remote Sensing and Spatial Information Sciences, Volume XLI-B6, 2016 XXIII ISPRS Congress, 12–19 July 2016, Prague, Czech Republic
This contribution has been peer-reviewed.