ACCURACY ASSESSMENT OF BUILDING MODELS CREATED FROM LASER
SCANNING DATA
A. Borkowski, G. Jóźków
Institute of Geodesy and Geoinformatics, Wroclaw University of Environmental and Life Sciences, Grunwaldzka 53, 50-357 Wroclaw, Poland - (borkowski, jozkow)@igig.up.wroc.pl
KEY WORDS: Architecture, Modelling, LIDAR, TLS, Accuracy, Three-dimensional
ABSTRACT:
Recently, it can be observed a growing interest in 3D building or city models created from laser scanning data. These models are used in many areas of interest. In this work the accuracy assessment of 3D buildings models created from airborne and terrestrial laser scanning data was carried out. TLS data for modelling were acquired with average point spacing about 0.02m. In order to model invisible from the ground building elements such as roofs, the LIDAR data was used with density of about 12pts./m2. TLS and LIDAR data were acquired in the same coordinates system. For textures mapping a set of 10Mpix digital images using SLR camera Canon 40D were taken. Modelling was performed using both commercial software Leica Cyclone, as well as original software and free software. The accuracy of models is affected by many factors, but the impact of all factors leading to errors of the final models were analysed together. The accuracy of models was assessed by comparing the coordinates of characteristic points of the models and the corresponding coordinates of these points measured on real buildings. The accuracy of points measured on the real building was not affected by model errors, therefore they can be treated as error-free reference points. On site reference measurements were performed using Leica TCR407Power reflectorless total station. Obtained inaccuracies of the reconstructed models were as follow: 0.12m horizontal, 0.13m vertical, 0.18m three-dimensional.
1. INTRODUCTION
Technological advances in airborne laser scanning on the one hand and the greater availability of laser scanning techniques on the other hand cause in recent years rising interest in building 3D models created based on laser scanning data. Building 3D models are increasingly being developed for the purpose of promoting city or region, risk management, administration or spatial analysis such as analysis of the insolation, the propagation of noise, pollution propagation, etc.
3D modelling of buildings from laser scanning data is also a current research problem, whichever is here mainly for the development of methods and algorithms to automate the modelling process, based primarily on airborne laser scanning data. Such modelling is a complex process in which a number of problems have to be solved, from the identification of the building in the data set to the reconstruction the vector model. Review and discuss the issues in this area can be found in the current works (Vosselman and Maas, 2010; Awrangjeb et al., 2010, Keller and Borkowski, 2011).
Cloud of points recorded by terrestrial laser scanner is in itself a good representation of a building model due to the high scanning resolution. However due to the size of data sets such model is not very practical in use. Therefore there is a need to create a geometric 3D model. Automatic modelling in the case of terrestrial scanning data refers rather to the modelling of building facades (Pu and Vosselman, 2006; Boulaassal et al., 2010).
Terrestrial laser scanning data are generally not sufficient to model the geometry of the roof. This information may be obtained from the airborne laser scanning data, but it contains of the fragmentary information on the facades of buildings. Complete data for modelling the geometric construction is obtained when the data sets of airborne and terrestrial laser
sets do not differ in principle from modelling based on airborne or terrestrial scanning data. Some problems may arise at the stage of sets co-registration of both data sets due to the different precision of the sensors, especially different horizontal accuracy for points collected by these sensors.
In this paper an accuracy assessment of the 3D model on the example of several heritage buildings was performed. Geometric models were built on the basis of the combined point cloud of airborne and terrestrial laser scanning.
data used for modelling and the various stages of modelling have to be presented.
2. INVESTIGATION OBJECTS AND DATA
2.1 Objects
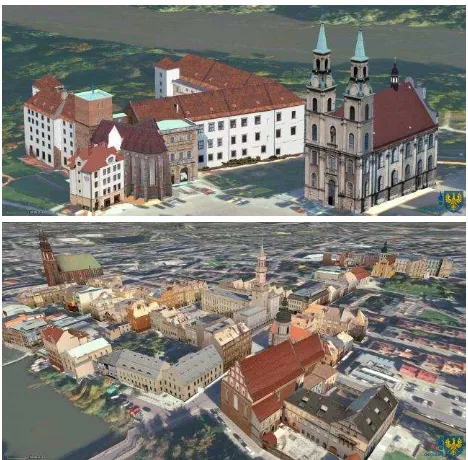
3D modelling of buildings was performed through a project commissioned by the regional authorities in south-west Poland. The aim of project was to develop three-dimensional models of historic buildings in several cities of south-west Poland. The 3D models have been created for regional promotion on the Internet and also for internal local authorities relating to the protection of heritage buildings. Thus expectations defined by the users of models require a compromise between modelling detail and the ability of models presentation on the Internet. The accuracy and level of details modelling were established between LoD3 (Level of Detail) and LoD4 (Open Geospatial Consortium, 2012). The idea was to model as faithful as possible reconstruction of the building elements and architectural details, while maintaining the possibility of effective presentation of the model on the Internet. For the modelling the combined with a terrestrial and airborne laser scanning point cloud was used. In the presented study the accuracy assessment of modelling was performed on two objects, referred as “Object 1” and “Object 2”. These objects are located in different Polish cities (Fig. 1).
Data both ALS and TLS on each object were obtained with the same sensors, but at different times and elaborated independently. Influence of the main source of error, i.e. GPS/INS system therefore differs in both places.
"Object 1" is a castle, enlarged and modernized over several centuries. This object is characterized by a mix of architectural styles and wealth of detail to be modelled.
"Object 2" are the buildings of the city centre, around the historic marketplace. Historic buildings here also have a complex structure and wealth architectural details.
Figure 1. Investigated 3D models. Upper: “Object 1” (City Brzeg). Lower: “Object 2” (City Opole).
2.2 TLS data
Terrestrial laser scanning was performed by two Leica scanners: ScanStation 2 and ScanStation C10 with hardware accessories and software Leica Cyclone Scan 7.1. For the purpose of scanning it was set up a few warp points around the objects. These points were measured with use of GNSS technique supported by ground based augmentation system of ASG-EUPOS. For measurements the receiver Trimble R6 was used. The coordinates of points were determined with the precision better than three centimetres. All the coordinates were determined in the coordinate system EPSG:2180 and the Polish system of normal heights.
Warp points were used for georeferencing and connection of single scans. Terrestrial laser scanning was carried out using resection method with the scanner orientation to the targets which were set up on warp points. The object scanning was made from many positions, with an average resolution of 2cm on the object (the average distance between points on the object). The combination and transformation of scans were executed with use of Cyclone Register 7.1 software. Accuracy achieved during registration was better than one centimetre, for both components: horizontal and vertical.
2.3 ALS data
Airborne laser scanning was performed with the use of Lite Mapper system, based on the full waveform scanner Riegl LMS-Q680i. Scanning was performed with a nominal resolution of 6 points per square meter. Because of the adjacent scans sidelap up to 50%, the resulting cloud of points for a modelled object has a resolution of 12 points per square meter. The final coordinates of the points were delivered in the same coordinate systems as the coordinates of terrestrial scanning data.
The produced from the two sensors combined point cloud which is the basis for modelling was visualized in Figure 2.
Figure 2. Example of the combined point cloud (part) of terrestrial (black) and airborne (red) laser scanning data.
2.4 Digital images
3. MODELLING
3D modelling for both objects was based on point clouds combined from airborne and terrestrial laser scanning data. Both data sets were combined based on their common georeference – EPSG:2180 coordinate system. There were not performed any procedures designed to improve the matching of both sets. In case of need or necessity to improve the matching of the two considered data sets, the algorithms of transformation must be used, for example the method proposed in the work of Gruen and Akca (2005), which is based upon homologous surfaces matching with use of generalized least squares method.
3.1 Geometry reconstruction
Modelling was performed using the Cyclone Model 7.1 software. The process of reconstruction a 3D vector model of building can be divided into the following stages (Borkowski et al., 2011):
Scanning data approximation by planes. Due to ease the subsequent texturing, all the elements of the building and architectural details were approximated by planes or theirs compounds. The algorithm of growing regions was used to identify the various planes in the data set.
Modelling the edges of the building. The edges of the building were modelled as a result of the intersection between neighbouring planes and were extended to the edges.
Checking and correction the topology. This problem was, illustrated in Figure 3. It occurs most often in modelling roofs of buildings or other at least four neighbouring planes. Three roof planes define only two edges. The next roof plane defines additional two edges, which often do not intersect with the previous ones at one point.
Building walls extending. Each wall which has the connection with the ground has to be extended to DTM. In this work DTM was created as a mesh from ground points of airborne laser scanning data set. Walls were extended to theirs intersections with DTM mesh.
Final 3D vector model creating. After geometry reconstruction each building model was exported to DXF format.
Figure 3. Left: incorrect topology. Right: correct topology.
3.2 Texturing
Texturing process consisted of imposing individual digital images of the same spatial resolution for each plane of 3D vector model. It was found that the size of one pixel on the object (wall) equal to 5cm is sufficient for the correct visualization of the model, while created textures will not be too big, so the final model can be presented via the Internet in an
the individual planes of the 3D model with simultaneous resampling of images to the chosen spatial resolution is made in original software developed at the Institute of Geodesy and Geoinformatics. This software converts images using the projective transformation (there is need to select a minimum of 4 homologous points on photo and model), and the resampling is being done using bilinear interpolation. For some textures, it was necessary to remove foreign objects such as cars or trees. This task was performed with use of the free software Gimp 2. Assignment and orientation of each to the appropriate model was performed in another free software - Google Sketchup 8. Visualization of the final models is shown in Figure 1.
4. ACCURACY ASSESMENT
4.1 Error sources
Discussing the accuracy assessment of created 3D model first the errors that affect the final accuracy of the model have to be considered:
1. The accuracy of TLS data. 2. The accuracy of ALS data.
3. Errors of integration of both data sets.
4. Generalization of the model (level of detail modelling) and unambiguous identification of individual components of the model (modelled surface roughness).
5. Errors resulting from the topology correction. 6. Texturing errors.
The characteristics of both sensors show that the accuracy of the TLS data, both horizontal and vertical is at a few centimetres level and is about an order of magnitude better than the accuracy of the ALS data. Method of the two point clouds integration must therefore have an impact on the final accuracy of the model. In the presented work, integration was based on a simple combination of data sets. This approach is pragmatic and results from the assumptions made by the user of models. In Figure 2 there is shown that in practically all areas of the building there can be found points from both airborne and terrestrial scanning, but obviously with different resolutions. This fact was used to assess some kind of models internal accuracy, or evaluate the accuracy of the two point clouds matching.
4.2 Internal accuracy
In order to determine the internal accuracy, the 3D models were created to the extent to which the data is available, separately from the ALS and TLS data. Composition of both models is shown in Figure 4.
This figure shows that both models intersect. Further, a comparison between the lower edge of the roof shows that the model created from airborne laser scanning data is placed higher than the model created from terrestrial laser scanning data. To quantify the level of mismatch between the two models there were compared to each other: heights, horizontal distances and spatial distances of 39 (“Object 1”) and 89 (“Object 2”) homologous points in both models. The results of this comparison are shown in the Table 1. As the RMSE was taken:
n d n
i i
1 2
(1)where = RMSE
di = difference (residue) between heights, planar distance or three-dimensional distance of homologous points
n = number of homologous points
“Object 1” “Object 2” Horizontal
min. residue 0.001m 0.001m
max. residue 0.288m 0.365m
mean residue 0.082m 0.142m
RMSE 0.118m 0.166m
Vertical
min. residue 0.000m -0.231m
max. residue 0.277m 0.260m
mean residue 0.165m -0.010m
RMSE 0.188m 0.090m
Three-dimensional
min. residue 0.004m 0.007m
max. residue 0.353m 0.366m
mean residue 0.200m 0.166m
RMSE 0.222m 0.189m
Table 1. Results of internal accuracy assessment.
Presented in Table 1 values show that the three-dimensional internal accuracy is about 0.2m for both investigated objects. The horizontal accuracy for “Object 1” is over 0.1m but better than for “Object 2”. Analysing the vertical accuracy for “Object 1” it can be found that model created from ALS data is placed over model created from TLS data (positive mean value of the residue). Completely different case there is for “Object 2” – model created from ALS data is slightly below model created from TLS data. Also the vertical accuracy in case of “Object 1” is more than twice times larger than for “Object 2”. It proves that matching of ALS and TLS point clouds should be executed separately for object or even building.
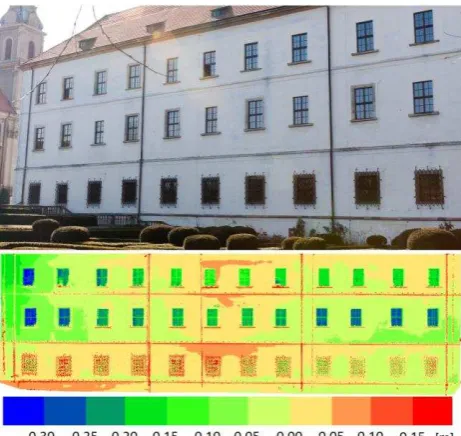
Internal accuracy of the model can also be linked to the generalization and detail of modelling (4.2 Error sources; point 5). Examples of generalized surfaces and visualization of residues between scanning points and modelled (as planes)
surfaces are shown in Figure 5 and Figure 6. The maximum differences reach even the value of 0.3m.
Figure 5. Left: Distance differences between modelled plane of roof and scanning points. Right: part of modelled roof.
Figure 6. Upper: part of modelled facade. Lower: Distance differences between modelled plane of facade and scanning
points.
4.3 Reference data
Figure 7. Example of referenced points location - vector (red) and texture (green) elements of model.
4.4 Absolute accuracy
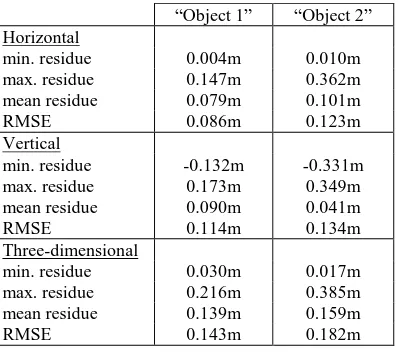
For the corresponding control points were calculated differences between heights and distances, both horizontal and spatial. This allowed to determine vertical, horizontal and three-dimensional absolute accuracy of the model. The tachymetric measured points have very high accuracy so can be treated as error-free. The results of absolute accuracy assessment are shown in the Table 2.
Table 2. Results of absolute accuracy assessment.
The mean vertical residue for “Object 1” shows that the model is placed in the space above 0.09m than the real building. This value is about 0.07m smaller than indicated in Table 1. This discrepancy results from the fact that the final model was created based on the combined point cloud. A large number of TLS points available on the scanned surfaces of roofs were averaged with ALS data and therefore allowed the building model to lower into the real height values.
The values given in Table 2 show that the absolute horizontal investigation are shown in Table 3. Three-dimensional RMS errors for both types of the final models elements are similar what proves that accuracy of vector elements was not much
“Object 1” “Object 2” Horizontal
RMSE of vectors elements 0.095m 0.127m RMSE of textures elements 0.063m 0.116m Vertical
RMSE of vectors elements 0.114m 0.117m RMSE of textures elements 0.114m 0.160m Three-dimensional
RMSE of vector elements 0.149m 0.172m RMSE of textures elements 0.134m 0.197m
Table 3. RMSE for vector and textures elements of models.
5. CONCLUSION
3D modelling of buildings from laser scanning data has become in recent years more and more productive task. While algorithms for modelling and automation of this process are the subject of intensive research, the more independent assessment of the accuracy of product which is a 3D model is less reflected in the literature. This is perhaps the fact that the users of such comparing the model with precise reference data obtained from tachymetric measurements of modelled object. As a result of this comparison, it was found that the modelling RMSE is about 0.14m and 0.18m respectively for investigated “Object 1” and “Object 2”. It is worth to notice that the error of texture elements mapping (such as the corners of windows) is at the similar level as the error of vector elements modelling. This proves a correct projection and resampling of digital photos. It seems the obtained modelling accuracy is sufficient for many problems occurring in practice. It is also significant that the modelling was performed for the Internet presentation where volume data set as small as possible is required.
In addition to assessing the absolute accuracy of the model, there was performed an assessment of the internal accuracy of the ALS and TLS data sets. This assessment was performed by comparing the 3D models created separately from ALS and TLS data. The result of the comparison, noticed that the internal accuracy is at about 0.2m. In order to achieve more accurate modelling it is necessary to fit (transform) airborne laser scanning data set into terrestrial laser scanning data set.
6. REFERENCES
Akca, D., Freeman, M., Sargent, I., Gruen, A. 2010. Quality assessment of 3D building data. Photogrammetric Record, 25(132), pp. 339-355.
Awrangjeb M., Ravanbakhsh, M., Fraser, C. S., 2010. Automatic detection of residential buildings using LIDAR data and multispectral imagery. ISPRS Journal of Photogrammetry & Remote Sensing, 65, pp. 457-467.
Province GIS website. 3rd Czech-Polish Symposium Brno-Wrocław "Actual Problems of Geodesy, Cartography and Photogrammetry", Brno, Lednice - South Moravia, Czech Republic, May 25-27, 2011, pp. 22.
Boulaassal H., Chevier C., Landes T., 2010. From laser data to parametric models: towards an automatic method for building façade modeling. Lecture Notes in Computer Sciences, Vol. 6436, pp. 42-55.
Gołuch P., Borkowski A., Jóźków G., 2007. Ocena dokładności danych lotniczego skaningu laserowego systemu ScaLARS. Archiwum Fotogrametrii, Kartografii i Teledetekcji, Vol. 17., pp. 261-270.
Gołuch P., Borkowski A., Jóźków G., 2008. Badanie dokładności NMT interpolowanego na podstawie danych lotniczego skaningu laserowego systemu ScaLARS. Acta Scientiarum Polonorum seria Geodesia et Dercriptio Terrarum, (7)2, pp. 37-47.
Gruen A., Akca D. 2005. Least squares 3D surface and curve matching. ISPRS Journal of Photogrammetry & Remote Sensing, 59, pp. 151-174.
Keller W., Borkowski A., 2011. Wavelet based buildings segmentation in airborne laser scanning data. Geodesy and Cartography, Vol. 60 No. 2, Warszawa 2011, pp. 99-123.
Kraus K., 2000. Photogrammetrie. Band 3. Topographische Informatonssysteme. Dümmler, Köln.
Open Geospatial Consortium, 2012. OGC City Geography Markup Language (CityGML) Encoding Standard.
https://portal.opengeospatial.org/files/?artifact_id=47842
pp. 12-13.
Oude Elberink, S., Vosselman, G. 2011. Quality analysis on 3D building models reconstructed from airborne laser scanning data. ISPRS Journal of Photogrammetry and Remote Sensing, 66, 157-165.
Pu S., Vosselman G., 2006. Automatic extraction of building fetures from terrestrial laser scanning. The International Archives of the Photogrammetry, Remote Sensing and Spatial Information Sciences, Vol. XXXVI, part 5, 5p.
Vosselman G. 2008. Analysis of planimetric accuracy of airborne laser scanning serveys. The International Archives of the Photogrammetry, Remote Sensing and Spatial Information Sciences, Vol. XXXVI, part 3A, pp. 99-104.