www.elsevier.comrlocateranireprosci
Effects of post-ovulatory food deprivation on the
hormonal profiles, activity of the oviduct and ova
transport in sows
A.M. Mwanza
a,), P. Englund
a, H. Kindahl
a, N. Lundeheim
b,
S. Einarsson
aa
Department of Obstetrics and Gynaecology, Centre for ReproductiÕe Biology, Swedish UniÕersity of Agricultural Sciences, Box 7039, SE-750 07 Uppsala, Sweden
b
Department of Animal Breeding and Genetics, Centre for ReproductiÕe Biology, Swedish UniÕersity of Agricultural Sciences, Box 7039, SE-750 07 Uppsala, Sweden
Received 20 July 1999; received in revised form 11 January 2000; accepted 3 February 2000
Abstract
The objective of the present study was to investigate the effect of post-ovulatory food deprivation on the hormonal profiles and consequently on the activity of the oviduct and ova
Ž .
transport in sows. Sows were randomly allocated to the control C-group, ns6 or fasted
ŽF-group, ns5 group. The F-group sows were fasted for four meals starting with the morning.
meal after detection of ovulation in the second oestrus after weaning. Ovulation was checked by transrectal ultrasonography. Blood was collected for the analyses of progesterone, oestradiol-17b, prostaglandin F2A metabolite, insulin, free fatty acids and triglycerides. Oviductal isthmic motility was monitored on Polyviewe before and after ovulation until the time of slaughter. After slaughter, the isthmus opposite the side with transducer was divided into three equal segments and
Ž .
flushed separately and a third of the uterine horn part from the utero-tubal-junction UTJ was also flushed. A high proportion of ova in the F-group was found in the first and second parts of the isthmus. In the C-group, a high proportion of ova was found in the third part of the isthmus and
Ž .
the uterus. The mean isthmic pressure in the C-group decreased significantly P-0.05 during the period immediately after ovulation while in the F-group mean pressure remained unchanged.
Ž .
The frequency of phasic pressure fluctuations were significantly P-0.05 higher in the F- than in the C-group 13 to 24 h after ovulation. No significant differences in progesterone concentra-tions were seen between the two groups of sows. Prostaglandin metabolite levels were
signifi-Ž .
cantly P-0.05 higher in the F-group than in the C-group. Oestradiol-17b levels significantly
)Corresponding author. Tel.:q46-18-67-29-04; fax:q46-18-67-35-45.
Ž .
E-mail address: [email protected] A.M. Mwanza .
0378-4320r00r$ - see front matterq2000 Elsevier Science B.V. All rights reserved.
Ž .
Žp-0.05 decreased earlier in the F- than in the C-group. Serum insulin levels were significantly. Žps0.05 lower in the F- than in the C-group while free fatty acids were significantly p. Ž -0.01.
higher in the F- than in the C-group. There were no significant differences in the serum levels of triglycerides between the F- and the C-group. Therefore, it can be concluded in the present study that food deprivation is associated with changes in the hormonal profiles, activity of the oviduct and a delay of ova transport in sows.q2000 Elsevier Science B.V. All rights reserved.
Keywords: Pig ovary; Isthmus; Pressure; Progesterone; Oestradiol-17b and prostaglandin F2A metabolite; Feeding and nutrition
1. Introduction
It has been known for a long time that nutrition plays an important role in Ž
reproduction in sows for reviews see Cole, 1990; Einarsson and Rojkittikhun, 1993; .
Foxcroft, 1997; Johnston et al., 1997 . However, group housingrmixing of sows is one of the practices of modern pig management. This may result in aggressiveness and social
Ž .
stress with the consequent adrenocortical activation Pedersen et al., 1993 and impaired
Ž .
reproductive performance Mendl et al., 1992; Tsuma et al., 1996a among individuals. In addition, fighting among group-housed sows may result in subordinate animals
Ž .
having limited access to food Mendl et al., 1992; Tsuma et al, 1996a . Therefore, apart from stress as a result of conflicts in group-housed sows, subordinate animals may be
Ž food deprived as well. Food deprivation has been shown to be stressful in pigs Parrot
. Ž .
and Mission, 1989 . An earlier study Anderson, 1975 has demonstrated that food deprivation during the first trimester leads to pregnancy losses. Studies at our Depart-ment have demonstrated that post-ovulatory food deprivation results in lower embryo
Ž . Ž
survival rate Tsuma et al., 1996b and more recently in a lowered cleavage rate Mburu
. Ž .
et al., 1998 . It has been argued by Dyck and Strain 1983 that the post-coitus period is the period of greater sensitivity to nutritional effects on embryo survival. Mburu et al. Ž1998 postulated that the reproductive and metabolic hormone changes as a result of. post-ovulatory food deprivation led to changes in the oviduct environment. These changes may result in the disruption of the normal development and transportation of ova through the oviduct with fertilized ova being transported out of synchrony with the
Ž .
uterine environment Mburu et al., 1998 . However, literature on the effect of food deprivation on reproductive and metabolic hormones and on the activity of the oviduct and ova transport in sows is lacking. Therefore, the objective of the present study was to investigate the effect of post-ovulatory food deprivation on hormonal profiles and consequently on the activity of the oviduct and ova transport in sows.
2. Materials and methods
2.1. Animals
Ž .
from one commercial farm to the Department of Obstetrics and Gynaecology and were
Ž . Ž .
randomly allocated to the control C-group, ns6 or fasted F-group, ns5 groups. The sows were housed in individual pens, with boars in their vicinity. The pens had a light period of 12 h starting from 0630 and the room temperature varied between 208C
Ž
and 238C. They were fed according to the Swedish breeding stock standard Simonsson, .
1994 and feed were provided twice per day at 0700 and 1500. Straw was changed once a day and water was available ad libitum. The sows had a weaning to oestrous interval of less than 10 days and were studied during one oestrous cycle incorporating the period of oestrous at commencement and end of the cycle. The treated sows were fasted for four meals starting with the morning meal after detection of ovulation in the second oestrus after weaning. In the C-group, the silastic tubing for blood sampling in one sow failed and this sow was therefore excluded from the hormonal analyses. Another sow in the control group was not recorded for pressure but was utero-ovarian cannulated.
2.2. Detection of oestrus and oÕulation
The sows were checked twice daily at 0600 and 1800 for signs of pro-oestrus after which detection of onset of oestrus was performed every 4 h in the presence of a fertile boar by back-pressure. The time of onset of oestrus was defined as 2 h before the first time the sow showed standing oestrus. Ovulation at the 1st and 2nd oestrus was
Ž .
determined by transrectal ultrasonography Soede et al., 1992; Mburu et al., 1995 and with the aid of a chute specially constructed to immobilise sows during the time of
Ž .
scanning Dalin et al., 1995 . Sows were scanned every 4 h from approximately 20 h after onset of oestrus. The time of ovulation was defined as 2 h before the first observation of a significant reduction in the number of pre-ovulatory or when no pre-ovulatory follicles could be seen.
2.3. Blood sampling
Ž .
Cannulation of the jugular vein Rodriguez-Martinez and Kunavongkrit, 1983 was
Ž .
performed under general anaesthesia as described by Mwanza et al. 1999a,b at least 1 week prior to the expected 2nd oestrus after weaning. In order to keep the cannulae functional, they were flushed twice a day with heparinized saline solution. Blood sampling commenced 12–24 h from the time of implantation of the intraluminal pressure transducer. Ten milliliters of blood was collected every 2 h in heparinized tubes, centrifuged immediately and the plasma stored at y208C until analysed. In addition, 10 ml of blood was collected in plain tubes at 1000 and 1800, centrifuged immediately after clotting and serum was stored at y208C until analyses were per-formed.
2.4. Implantation of intraluminal pressure transducer
Immediately after standing in the 2nd oestrus after weaning and early in the morning, w
Ž w
. a Millar pressure transducer Mikro-tip , SPR 249, Millar Instruments, Texas, USA
Ž .
anaesthe-Ž w .
sised using thiopenthotal sodium Penthotal Sodium 5% through the cannulated jugular vein and placed on the operation table in lateral recumbence. The pressure transducer was then implanted into the isthmus according to surgical procedures
Ž .
previously described Mwanza et al., 1999a . The pressure transducer was placed approximately 3 cm into the isthmus and was firmly fixed in position by several sutures placed between the ureteric catheters and the uterus. The abdominal cavity was then closed, the electrical connector of the pressure transducer was placed in a pouch sutured
Ž .
to the sow’s back, after which the sow was returned to its pen 1.45=2.90 m .
2.5. PolyÕiewe data storage, acquisition and analysis
Recordings were made with the sow in its pen by connecting the electrical connector
Ž .
of the pressure transducer to a control unit TC-100, Millar Instruments, USA that in
Ž .
turn was connected to an amplifier SenseLab 4Champ, Somedic Sales, Horby, Sweden
¨
and subsequently to Polyviewe. The digital chart speed was set to 25 mmrmin and the sampling rate to 100. Recordings of 30-min duration were made every 4 h commencing 12–24 h prior to expected ovulation and up to 36–48 h following ovulation. Waveform data were later retrieved, and mean pressure was determined by positioning the two cursors over a 2-min period when the sow was deemed to be ‘still’. Four of the 2-min periods in each 30 min recording time were used for the calculations. The Fast Fourier
Ž .
Transform FFT was used to calculate the frequencies of phasic pressure fluctuations of the selected waveform data.
2.6. Slaughter and recoÕery of oÕa
All the sows were slaughtered less than 54 h after ovulation in the 2nd oestrous after weaning by stunning and bleeding. After slaughter, the reproductive tract was immedi-ately recovered. However, only the reproductive tract opposite to the side with the
Ž .
transducer was used. The number of corpora lutea CL on the ovary was recorded. After the uterine and oviductal ligaments had been cleared, the isthmus was then divided
Ž .
into three equal segments and were each flushed with 20 ml of warm 378C phosphate
Ž .
buffered solution PBS . About a third of the uterine horn from the utero-tubal-junction ŽUTJ was also recovered and flushed with 40 ml of PBS. All the flushings were made. directly into a petri dish. The flushings were then examined for the presence of ova under a stereomicroscope.
2.7. Hormonal assays
2.7.1. Progesterone
Plasma progesterone levels were determined by a luminescence immunoassay ŽAmerlite, Kodak Clinical Diagnostics, England according to the manufacturer’s in-. structions but with some modifications. The assay reagent and the horse radish
peroxi-Ž .
were below 10% for concentrations between 0.25 and 8 nmolrl. The inter-assay
Ž .
coefficient of variation for one control sample was 11% 2 nmolrl . The average detection limit of the assay was 0.2 nmolrl.
2.7.2. Oestradiol-17b
Ž
Plasma oestradiol-17b was determined by radioimmunoassay Double antibody .
oestradiol, Diagnostic Products, Los Angeles, USA as previously described for the
Ž .
analysis of bovine plasma Duchens et al., 1994 . The intra-assay coefficients of variation calculated from 10 assays were 25% at 6 pmolrl, 18% at 11 pmolrl and decreased below 13% for concentrations between 23 and 180 pmolrl. The inter-assay
Ž . Ž
coefficients of variation for three control samples were 17% 4 pmolrl , 10% 40
. Ž .
pmolrl and 7% 70 pmolrl . The average detection limit of the assay was 3 pmolrl.
2.7.3. Prostaglandin metabolite
The main initial blood plasma metabolite of prostaglandin F2A,
15-keto-13,14-dihy-Ž .
dro-PGF2A 15-ketodihydro-PGF2A, was analyzed by radioimmunoassay according to
Ž .
Kunavongkrit et al. 1983 . The relative cross-reactions of the antibody were 16% with 15-keto-PGF2A, and 4% with 13,14-dihydro-PGF2A. The intra-assay coefficients of variation ranged between 3.4% and 7.6% for different ranges of the standard curve and the inter-assay coefficient of variation was around 14%. The practical limit of sensitivity for the assay analyzing 0.2 ml of plasma was 60 pmolrl.
2.7.4. Insulin
Ž Serum samples were analyzed by radioimmunoassay for insulin determination
In-.
sulin RIA 100, Pharmacia Diagnostics, Uppsala, Sweden . Several dilutions of porcine serum with high insulin concentrations produced inhibition curves parallel to the standard curve. Intra-assay coefficients of variation, calculated from the precision profile of three assays were below 25% for concentrations of insulin between 3 and 100
Ž
mUrml. The inter-assay coefficients of variation for three control samples were 2% 12
. Ž . Ž .
mUrml , 2% 41mUrml and 8% 99mUrml . The average detection limit of the assay was 1mUrml.
2.7.5. Triglycerides and free fatty acids
Serum levels of triglycerides and free fatty acids were determined with a Cobas Mira ŽFARA multichanel analyzer Roche, Basel . Standardized reagent kits Roche kits no.. Ž . Ž
.
07-1097-0, 07-1098-9, 07-1115-2, 07-1444-5, WIAKO kit no. 994-75409 were used. Both serum levels of triglycerides and free fatty acids were determined with enzymatic colorimetrical methods. The triglyceride concentration was determined according to its
Ž .
glycerol content Megraw et al., 1979 . The concentration of free fatty acids was determined by its ability to acyclate coenzyme A in the presence of CoA-synthetase ŽDuncombe, 1964 ..
2.8. Statistical methods
Oviductal pressure and plasma hormonal observations were grouped into five time
Ž .
Ž . Ž . ovulation one before and four after . All observations at the time of ovulation time 0
Ž .
were included in the first time period y11 to 0 h . For each sow and time period, mean values were calculated for hormonal and pressure observations. One sow in the control group was excluded from the hormonal analyses and another sow in the same group was also excluded from the pressure analyses due to the missing hormonal or pressure
Ž
values, respectively. These mean values were analyzed by analysis of variance repeated .
measurements ANOVA according to the GLM- procedure in the Statistic Analysis
Ž .
Systems Institute 1989 . The statistical model included the effects of: group of sows, sows within group, time period and the interaction between group and time period. For tests of significance between groups, sow within group was used as an error term. Mean values for the two groups were calculated for the intervals from ovulation to slaughter ŽOS , standing to ovulation in the 1st SO1 and 2nd oestrus SO2 , ovulation to fasting. Ž . Ž . and total number of CL in the two groups and were compared using a t-test. Mean values for the period from start of fasting to slaughter were calculated for insulin, triglycerides and free fatty acids and were compared using a t-test. The distribution of ova in the different segments in the two groups was compared using a Fisher’s exact test.
3. Results
( ) ( )
3.1. OÕa recoÕery mean"SD from F-group ns5, C-group ns6 sows
Ž . Ž
The number of CL, recovery rate RR , the intervals from SO1 and SO2, ovulation
Ž .
to start of fasting OSF , OS in the control and fasted sows are presented in Table 1. There were no significant difference in any of these parameters. The ova recovery rate calculated as a percentage of ova recovered in relation to counted corpora lutea in the
Ž . Ž .
F-group 85.3"13.8% did not different from that in the C-group 71.0"22.3% . The frequency distribution of ova recovered in the different segments in the two
Ž .
groups is presented in Table 2. A significantly P-0.001 higher proportion of ova in
Table 1
Ž . Ž . Ž .
Number of corpora lutea CL , recovery rate RR , standing to ovulation in the first SO1 and second oestrus
ŽSO2 , ovulation to start of fasting OSF , ovulation to slaughter OS , insulin, triglycerides and free fatty. Ž . Ž . Ž .
acids FFA in the control and fasted sows
Control Fasted
U Ž . U Ž .
Mean "SD Range Mean "SD Range
Ž . Ž . Ž .
Triglycerides mmolrl 0.74"0.24 0.29"1.08 0.59"0.16 0.34–0.91
a b
Ž . Ž . Ž .
FFA mmolrl 0.19"0.17 0.07–0.59 0.54"0.32 0.04–1.02
U
Ž .
Table 2
Ž . Ž .
Frequency distribution of ova recovered in the different segments in the control ns6 and fasted ns5
Ž .
sows. The proportions differed significantly between the groups P-0.001
Location Control group Fasted group
No. % No. %
Isthmic1 0 0 26 63
Isthmic2 10 25 15 37
Isthmic3 14 35 0 0
Uterus 16 40 0 0
Total 40 100 41 100
the F-group was found in isthmic1 and isthmic2 compared to the C-group in which a higher proportion was found in isthmic3 and the uterus.
( ) ( )
3.2. Pressure changes LSmeans"SEM , F-group ns5, C-group ns5
Ž .
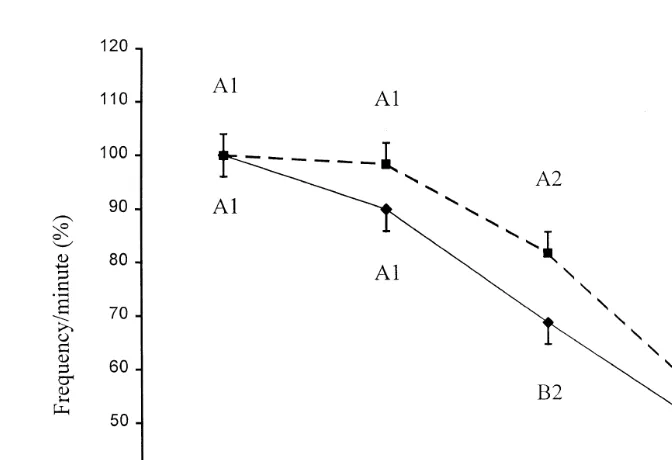
Fig. 1 shows the changes in the mean pressure mm Hg of the isthmic lumen before and after ovulation in the control and fasted sows. No significant differences in the mean
Ž .
pressure during the five 12 h intervals were seen between the two groups. In the
Ž .
C-group, mean pressure significantly decreased P-0.05 during the period from 1 to
Ž .
12 h after ovulation. Mean pressure continued to decrease significantly P-0.05 until
Ž . Ž .
Fig. 1. Changes in the mean pressure mm Hg of the isthmic lumen LSmeans"SEM before and after
Ž . Ž . Ž .
ovulation time 0sovulation in the control —l—, ns5 and fasted – –B– –, ns5 sows. Values with
Ž . Ž
different letters within the same group differ significantly p-0.05 . A, B, and C relate to the F- while a, b,
.
Ž . Ž .
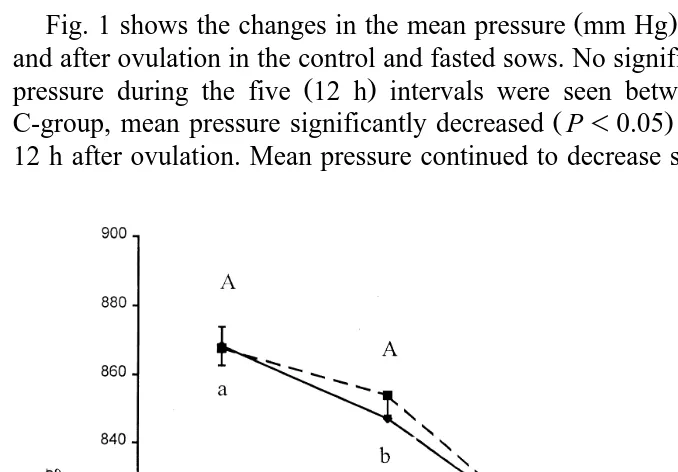
Fig. 2. Mean LSmeans"SEM frequency of phasic pressure fluctuations frequencyrminute of the isthmus
Ž . Ž .
before and after ovulation in the control —l—, ns5 and fasted – –B– –, ns5 sows, expressed as
Ž .
percentage of the within-group level before ovulation y11 to 0, time 0sovulation . Values with different
Ž .
letters between the groups differs significantly p-0.05 . Values with different numbers within the same
Ž .
group differ significantly p-0.05 .
25 to 36 h after ovulation and remained thereafter unchanged. In the F-group, mean pressure remained unchanged during the period from 1 to 12 h after ovulation. Mean
Ž .
pressure then decreased significantly P-0.05 during the periods from 13 to 24 h and 25 to 36 h after ovulation. Thereafter, mean pressure remained unchanged.
Changes in percent of the mean frequency of phasic pressure fluctuations Žfrequencyrminute before and after ovulation in the control and fasted sows are.
Ž
presented in Fig. 2. Calculated as 100% of the 12 h interval before ovulation y11 to 0
. Ž .
h , the frequency of phasic pressure fluctuations in the F- was 100"4.0% 46.6"1.8
Ž .
and in the C-group was 100"4.0% 41.7"1.8 . The mean frequency of phasic
Ž . Ž
pressure fluctuations was significantly higher P-0.05 in the F- 81.7"4.0%;
. Ž .
38.1"1.8 than in the C-group 68.6"4.0%; 28.9"1.8 during the period from 13 to 24 h after ovulation.
4. Hormones
( ) ( )
4.1. Progesterone LSmeans"SEM , F-group ns5, C-group ns5
Ž . Ž .
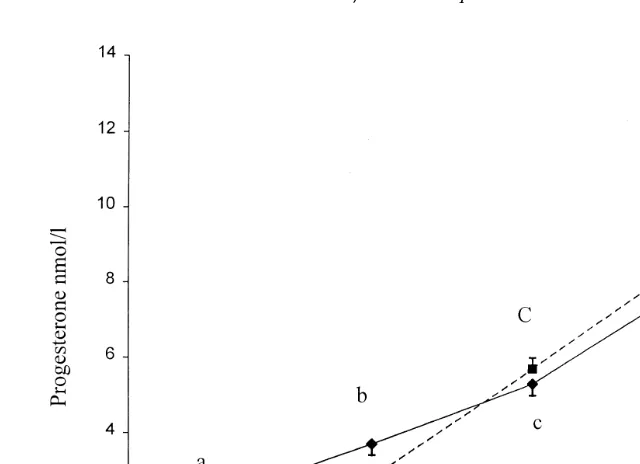
Fig. 3. Plasma progesterone LSmeans"SEM levels before and after ovulation in the control —l—, ns5
Ž . Ž .
and fasted – –B– –, ns5 sows time 0sovulation . Values with different letters within the same group
Ž . Ž .
differ significantly p-0.05 . A, B, C, D and E relate to the F- while a, b, c, d and e relate to the C-group .
the two groups either before or after ovulation. However, in both groups, plasma
Ž .
progesterone levels increased significantly P-0.05 from 2.2"0.3 and 1.5"0.3
Ž .
nmolrl during the initial period 11 to 0 h before ovulation to 3.7 and 2.8 nmolrl during the period from 1 to 12 h after ovulation, in the control and fasted sows, respectively. Thereafter, plasma progesterone levels continued to rise significantly in both groups.
( ) ( )
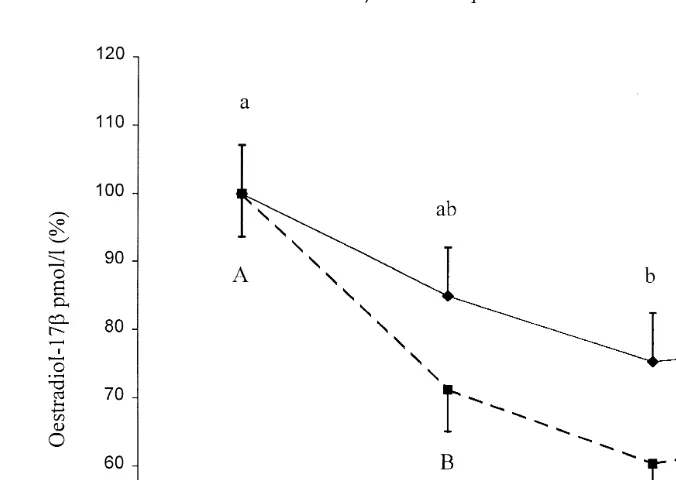
4.1.1. Oestradiol-17b LSmeans"SEM , F-group ns5, C-group ns4
Percent changes in plasma oestradiol-17b levels are presented in Fig. 4. There were no significant differences in the plasma oestradiol-17b levels between the C- and the
Ž .
F-groups. Calculated as 100% of the 12 h interval before ovulation 11 to 0 h , the
Ž .
F-group showed a significant decrease P-0.05 in the plasma oestradiol-17b levels
Ž . Ž .
from 100"6.4% 6.8"0.5 pmolrl during the initial period 11 to 0 h before
Ž .
ovulation to 71.3"6.4% 4.7"0.5 pmolrl during the period from 1 to 12 h after ovulation. Thereafter, plasma oestradiol-17b levels fluctuated between 60.8"6.4% Ž3.8"0.5 pmolrl and 65.2. "6.6% 3.9Ž "0.5 pmolrl during the periods from 13 to. 24 h and 25 to 36 h after ovulation. In the C-group, plasma oestradiol-17b levels
Ž . Ž .
decreased significantly P-0.05 from 100"7.1% 5.6"0.6 pmolrl during the
Ž . Ž .
Ž . Ž
Fig. 4. Plasma oestradiol-17b LSmeans"SEM levels before and after ovulation in the control —l—,
. Ž . Ž
ns4 and fasted – –B– –, ns5 sows expressed as percentage of the respective level pre-ovulation y11
. Ž .
to 0, time 0sovulation . Values with different letters within the same group differ significantly p-0.05 .
( ) ( )
4.1.2. Prostaglandin metabolite LSmeans"SEM , F-group ns5, C-group ns5
Ž
Fig. 5 shows the changes in the plasma prostaglandin F2A metabolite 15-ketodihy-.
dro-PGF2A in the F- and C-sows. In the F-group, prostaglandin F2A metabolite levels
Ž .
increased significantly P-0.05 from 339.0"23.9 pmolrl during the initial period Ž11 to 0 h before ovulation to 423.5. "24.9 pmolrl during the period from 1 to 12 h after ovulation. Prostaglandin F2A metabolite continued to rise reaching maximum values of 644.8"25.5 pmolrl 25 to 36 h after ovulation. There were no changes in the levels of prostaglandin F2A metabolite before or after ovulation in the C-group. There
Ž .
were no significant p)0.05 differences in the levels of prostaglandin F2A metabolite
Ž .
between the F- and C-group sows during the initial period 11 to 0 h before ovulation .
Ž .
However, prostaglandin F2A metabolite levels were significantly P-0.001 higher in the F- than the C-group sows during all periods after ovulation.
( ) (
4.1.3. Insulin, triglycerides and free fatty acids Means"SD , F-group ns5, C-group )
ns5
Ž . Ž .
Serum insulin levels were significantly Ps0.05 lower 8.3"6.6mUrml in the
F-Ž .
Ž .
Fig. 5. Plasma prostaglandin F2ametabolite LSmeans"SEM levels before and after ovulation in the control
Ž—l—, ns5 and fasted. Ž– –B– –, ns5 sows time 0. Ž sovulation . Values with different letters.
Ž .
between the two groups differ significantly p-0.05 . Values with different numbers within the same group
Ž .
differ significantly p-0.05 .
.
mmolrl . There were no significant differences in the serum levels of triglycerides
Ž . Ž .
between the F- 0.59"0.16 mmolrl and the C-group 0.73"0.24 mmolrl .
5. Discussion
The objective of the present study was to elucidate the effects of food deprivation on the hormonal profiles and consequently on the activity of the oviduct and ova transport in sows. Therefore, isthmic pressure and frequencies of phasic pressure fluctuations were studied in relation to hormonal profiles and ova position in the reproductive tract. Mean isthmic pressure was unchanged 1 to 12 h after ovulation in the fasted sows.
Ž .
Conversely, mean pressure decreased significantly during the same period 1 to 12 h after ovulation in the control sows and the frequencies of phasic pressure fluctuations were also lower. The non-decrease in mean pressure in the F-group sows and the higher frequencies of phasic pressure fluctuations after ovulation in F- compared to the C-group sows may have delayed the relaxation and opening of the ampullary isthmic junction ŽAIJ . The AIJ has been suggested to act as a sphincter and could therefore have acted as.
Ž
a mechanical barrier to ova displacement Borda et al., 1980; Rodriguez-Martinez, 1984; .
resulted in the delay of ova displacement through the isthmus since 1 to 12 h after
Ž .
ovulation, ova are not expected to have passed into the isthmus Mwanza et al., 1999b .
Ž .
Rodriguez-Martinez 1984 in the in vitro studies of the oviduct demonstrated the presence of adrenergica- andb-receptors in all muscle layers. However, he observed a predominance of a-receptors in the isthmic circular layer and intact isthmus throughout
Ž .
the cycle. Moreover, Rodriguez-Martinez 1984 demonstrated that the isthmus reacted more strongly to noradrenaline and adrenaline especially during the period of ova retention in the tubes suggesting the existence of an adrenergic sphincter. Dalin et al. Ž1993 showed an increase in the levels of adrenaline with a fluctuation of noradrenaline.
Ž .
during transportation in ovariectomised gilts. Neubert et al. 1999 observed that stimulation of lipolysis in growing pigs during fasting did not result in significant changes in the plasma levels of adrenaline and noradrenaline. However, they observed higher levels at the beginning of their experiment and attributed it to the excitement of pigs in anticipation to feeding. In the present experiment, F- and C-group sows were housed in the same building and were prone to the excitement during feeding times. Although noradrenaline and adrenaline were not determined in the present study, it can be speculated that they were increased in the fasted sows as a consequence of more excitement at the time of feeding. As a result, they may have contributed to the higher pressure in the isthmus as presently observed in the fasted sows resulting in ova retention.
Ž .
It has recently been demonstrated Mburu et al., 1998 that food deprivation after ovulation in sows results in elevated plasma levels of cortisol, progesterone and prostaglandin F2A metabolite. In the present study, there were no changes in proges-terone levels, prostaglandin F2A metabolite levels were significantly higher while oestradiol-17b levels significantly decreased earlier in the fasted than in the control
Ž .
sows. It has been suggested Juniewicz and Johnson, 1984 that stress increases the endogenous release of ACTH, which in turn stimulates the release of progesterone and cortisol from the adrenal glands. In the present study, oestradiol-17b levels significantly decreased earlier in the fasted than control sows and match the findings of Tsuma et al. Ž1996b in fasted sows in their early pregnancy. How fasting causes the decrease in.
Ž .
oestradiol-17b levels remains unclear. However, in vitro studies by Kawate et al. 1993 demonstrated that bovine granulosa cells in the presence of cortisol, increases proges-terone secretion with a concomitant decrease in oestradiol-17b secretion. Prostaglandin metabolite levels in the present study were elevated in the fasted sows and agree with
Ž .
that reported earlier Tsuma et al., 1996b; Mburu et al., 1998 . The low levels of insulin and the high levels of free fatty acids found in the present study indicate that the sows were in a catabolic state and is in agreement with earlier findings by Rojkittikhun et al. Ž1993 and Holst and Kindahl 1995 in sows and prebubertal gilts, respectively. Silver. Ž .
Ž .
and Fowden 1982 suggested that the increase of free fatty acids, triglycerides and phospholipids would result in an increase in the levels of arachidonic acid, a precursor for prostaglandin F2A metabolite. Another explanation for the increased levels of the prostaglandin metabolite might be due to a decreased rate of metabolism of the
Ž .
Although only prostaglandin F2A metabolite was analyzed in the present study, other prostaglandins could as well have been increased. Prostaglandins have been shown to
Ž
modify the contraction of the oviduct Rodriguez-Martinez and Einarsson, 1985;
Petters-. Ž
son et al., 1993 in pigs and the transportation of ova through the oviduct Spilman, .
1976 . Prostaglandin F2A and PGE have been shown to stimulate oviductal contrac-1 Ž
tions while PGE has been shown to stimulate relaxation of the oviduct Spilman and2 .
Harper, 1975 . However, their effects on the oviduct seem to be modified by
proges-Ž .
terone or oestrogens. Recently, Mwanza et al. 1999b have demonstrated that both prostaglandin F2A metabolite and oestradiol-17b decline significantly before ovulation in normal cycling sows. Therefore, the effects of prostaglandins on the oviduct after ovulation may be minimal since the levels are low. This is further supported by the finding that the inhibition of prostaglandins after ovulation does not affect ova transport
Ž .
through the oviduct Hulten et al., 1999 . Although other prostaglandins could have been
´
increased in the present study, prostaglandin F2A in the fasted sows may have contributed to the maintained isthmic pressure and increased frequencies of phasic
Ž .
pressure fluctuations after ovulation. Saksena and Harper 1975 found a positive correlation between elevated levels of PGF in the distal and proximal section of the isthmus and retention of eggs in the ampulla and distal isthmus in rabbits. Despite the decrease in oestradiol-17blevels in the fasted sows, oestradiol-17bcould still have been
Ž
bound to the oestrogen receptors Rodriguez-Martinez et al., 1984; Stanchev et al., .
1985 and therefore capable together with the high levels of prostaglandin F2A of influencing the activity of the oviduct. The influence of these hormones on the oviduct is not sustained despite the high levels of prostaglandin metabolite. This may be due to the
Ž
significant decrease of oestrogen and an increase in progesterone receptors Rodriguez-.
Martinez et al., 1984; Stanchev et al., 1985 .
6. Conclusion
It can be concluded in the present study that food deprivation may be associated with changes in the hormonal profiles, activity of the oviduct and a delay of ova transport in sows.
Acknowledgements
We thank the Swedish Council for Forestry and Agricultural Research for financially supporting this research. The University of Zambia for the scholarship and study leave granted to Dr. A.M. Mwanza. Dr. Mats Forsberg for his help with hormonal analyses. Carola Jansson, Mari Wallbring, Kjell-Ove Eklund and Helen Gille for their help in handling experimental animals.
References
Anderson, L.L., 1975. Embryonic and placental development during prolonged inanition in the pig. Am. J. Physiol. 229, 1687–1694.
Ž .
fimbrial, isthmic, ampullar, and fimbrio-ampulla segments of isolated sow Sus scrofa oviducts as influenced by ovulation, adrenergic mechanisms and prostaglandin E1. Int. J. Fertil. 25, 28–35. Cole, D.J.A., 1990. Nutrition strategies to optimize reproduction in pigs. J. Reprod. Fertil., Suppl. 40, 67–82. Dalin, A.-M., Magnusson, U., Haggendal, J., Nyberg, L., 1993. The effect of transport stress on plasma levels¨
of catecholamines, cortisol, corticosteroids-binding globulin, blood cell count and lymphocyte proliferation in pigs. Acta Vet. Scand. 34, 59–68.
Dalin, A.-M., Nanda, T., Hulten, F., Einarsson, S., 1995. Ovarian activity at naturally attained oestrus in the´
sow, an ultrasonographic and LH study. Acta Vet. Scand. 36, 377–382.
Duchens, M., Forsberg, M., Edqvist, L.-E., Gustafsson, H., Rodriguez-Martinez, H., 1994. Effect of induced suprabasal progesterone levels around estrus on plasma concentrations of progesterone, estradiol-17band LH in heifers. Theriogenology 42, 1159–1169.
Duncombe, W.G., 1964. The colorimetric micro-determination of non-esterified fatty acids in plasma. Clinica Chimica Acta 9, 122–125.
Dyck, G.W., Strain, J.H., 1983. Post-mating feeding level of diet intake after mating on the serum concentration of thyroxine, growth hormone, insulin and glucose, and embryonic survival in the gilt. Can. J. Anim. Sci. 63, 579–585.
Einarsson, S., Rojkittikhun, T., 1993. Effects of nutrition on pregnant and lactating sows. J. Reprod. Fertil., Suppl. 48, 229–239.
Foxcroft, G.R., 1997. Mechanisms mediating nutritional effects on embryonic survival in pigs. J. Reprod. Fertil., Suppl. 52, 47–61.
Holst, H., Kindahl, H., 1995. Hematological and blood biochemical effects of fasting and subsequent oral administration of endotoxin in prebubertal gilts. Acta Vet. Scand. 36, 499–508.
Hulten, F., Tantasuparuk, W., Englund, P., Kindahl, H., Einarsson, S., 1999. The influence of inhibited´
prostaglandin biosynthesis on post-ovulatory oviductal transport in sows. Theriogenology, submitted. Johnston, L.J., Pettigrew, J.E., Shurson, G.C., 1997. Sow nutrition and reproduction. News and Pig
Information 18, 61–64.
Juniewicz, P.E., Johnson, B.H., 1984. Ability of cortisol and progesterone to mediate the stimulatory effect of adrenocorticotropic hormone upon testosterone production by the porcine testis. Biol. Reprod. 30, 134–142.
Kawate, N., Inaba, T., Mori, J., 1993. Effects of cortisol on the amounts of estradiol-17b and progesterone secreted and the number of luteinizing hormone receptors in cultured bovine granulosa cells. Anim. Reprod. Sci. 32, 15–25.
Kunavongkrit, A., Kindahl, H., Madej, A., 1983. Clinical and endocrinological studies in primiparous zero-weaned sows. Hormonal patterns of normal cycling sows after zero-weaning. Zbl. Vet. Med. A. 30, 616–624.
Mburu, J.N., Einarsson, S., Dalin, A.-M., Rodriguez-Martinez, H., 1995. Ovulation as determined by transrectal ultrasonography in multiparous sows: relationships with oestrous symptoms and hormonal profiles. J. Vet. Med., Ser. A 42, 285–292.
Mburu, J.N., Einarsson, S., Kindahl, H., Madej, A., Rodriguez-Martinez, H., 1998. Effects of post-ovulatory food deprivation on oviductal sperm concentration, embryo development and hormonal profiles in the pig. Anim. Reprod. Sci. 52, 221–234.
Megraw, R.E., Dunn, D.E., Biggs, H.G., 1979. Manual and continuous-flow colorimetry of triacylglycerols by a fully enzymatic method. Clin. Chem. 25, 273–278.
Mendl, M., Zanella, A.J., Broom, D.M., 1992. Physiological and reproductive correlates of behavioral strategies in female domestic pigs. Anim. Behav. 44, 1107–1121.
Mwanza, A.M., Englund, P., Pettersson, A., Einarsson, S., 1999a. Oviductal isthmic motility patterns as monitored by Polyviewein unrestrained sows around ovulation. Anim. Reprod. Sci., submitted. Mwanza, A.M., Lundeheim, N., Pettersson, A., Kindahl, H., Einarsson, S., 1999b. Oviductal isthmic motility
in relation to ovulation and endocrine changes in unrestrained sows. Theriogenology, submitted. Neubert, E., Scholze, C., Kratzsch, J., Gurtler, H., 1999. Plasma levels of catecholamines and lipolysis during¨
starvation in growing pigs. J. Vet. Med., Ser. A 46, 247–253.
Pedersen, L.J., Rojkittikhun, T., Einarsson, S., Edqvist, L.E., 1993. Post-weaning grouped sows: effects of aggression on hormonal patterns and oestrous behaviour. Appl. Anim. Behav. Sci. 38, 25–39.
Pettersson, A., 1991. Cyclic variations in intraluminal pressure in the isthmus of the oviduct in unrestrained gilts. J. Vet. Med., Ser. A 38, 337–343.
Pettersson, A., Einarsson, S., Kindahl, H., 1993. A study on the effects of inhibition of prostaglandin biosynthesis with Flunixin Meglumine and later administration of Prostaglandin F2A on the intraluminal pressure variations in the isthmus of the oviduct in unrestrained gilts. Acta Vet. Scand. 34, 125–131. Rodriguez-Martinez, H., 1984. Effects of adrenergic agents on the in vitro motility of porcine oviducts. Vet.
Med., A 31, 91–104.
Rodriguez-Martinez, H., Einarsson, S., 1985. Influence of prostaglandins on the spontaneous motility of the pig oviducts. Anim. Reprod. Sci. 8, 259–279.
Rodriguez-Martinez, H., Garcia, R.B., Ohanian, C., Einarsson, S., 1982. Histochemical investigation on the distribution of adrenergic nerve terminals in the porcine oviduct. Vet. Med., A 29, 64–71.
Rodriguez-Martinez, H., Kunavongkrit, A., 1983. Chronic venous catheterization for frequent blood sampling in unrestrained pigs. Acta Vet. Scand. 24, 318–320.
Rodriguez-Martinez, H., Stanchev, Ph., Edqvist, L.-E., Einarsson, S., 1984. Estrogen and progesterone nuclear receptor levels in the pig oviduct in relation to its spontaneous motility. 10th International Congress on Animal Reproduction and Artificial Insemination, June 10–14, University of Illinois at Urban-Champaign, Illinois, USA. Volume III. Brief communications. Paper no. 488, 3 pp.
Rojkittikhun, T., Uvnas-Moberg, K., Einarsson, S., 1993. Plasma oxytocin, prolactin, insulin and LH after 24 h¨
of fasting and refeeding in lactating sows. Acta Physiol. Scand. 148, 413–419.
Ž .
Saksena, S.K., Harper, M.J.K., 1975. Relationship between concentration of Prostaglandin F PGF in the oviduct and egg transport in rabbits. Biol. Reprod. 13, 68–76.
Simonsson, A., 1994. Naringsrekommendationer och fodermedelstabeller till svin. Swedish University of¨
Agricultural Sciences, SLU Info rapporter, Husdjur, 75.
Soede, N.M., Noordhuizen, J.P.T.M., Kemp, B., 1992. The duration of ovulation in pigs studied by transrectal ultrasonography is not related to early embryonic diversity. Theriogenology 38, 653–666.
Spilman, C.H., 1976. Prostaglandins, oviductal motility and egg transport. In: Proceedings Task Force on Methods for the Regulation of Ovum Transport organized by WHO, University of Texas, San Antonio, 23–27 June 1975. Scriptor, Copenhagen, Denmark, pp. 197–211.
Spilman, C.H., Harper, M.J.K., 1975. Effects of prostaglandins on oviductal motility and egg transport. Gynecologic Investigation 6, 186–205.
Stanchev, P., Rodriguez-Martinez, H., Edqvist, L.E., Eriksson, H., 1985. Oestradiol and progesterone receptors in the pig oviduct during the oestrous cycle. J. Steroid Biochem. 22, 115–120.
Statistical Analysis Systems Institute, 1989. In: 4th edn. SASrSTAT User’s Guide, Version 6 Vol. 2 NC SAS Institute, Cary.
Tsuma, V.T., Einarsson, S., Madej, A., Kindahl, H., Lundeheim, N., Rojkittikhun, T., 1996a. Endocrine changes during group housing of primiparous sows in early pregnancy. Acta Vet. Scand. 37, 481–489. Tsuma, V.T., Einarsson, S., Madej, A., Kindahl, H., Lundeheim, N., 1996b. Effect of food deprivation during