LESION DETECTION IN CT IMAGES USING DEEP LEARNING SEMANTIC
SEGMENTATION TECHNIQUE
A. Kalinovskya, V. Liauchuka, A. Tarasaub a
United Institute of Informatics, Minsk, Belarus - (gakarak, vitali.liauchuk)@gmail.com b
Scientific and Practical Center for Pulmonology and Tuberculosis, Minsk, Belarus - [email protected]
Commission II, WG II/10
KEY WORDS: Deep Neural Networks, Convolutional Neural Networks, Semantic Segmentation, Chest Radiography, Tuberculosis
ABSTRACT:
In this paper, the problem of automatic detection of tuberculosis lesion on 3D lung CT images is considered as a benchmark for testing out algorithms based on a modern concept of Deep Learning. For training and testing of the algorithms a domestic dataset of 338 3D CT scans of tuberculosis patients with manually labelled lesions was used. The algorithms which are based on using Deep Convolutional Networks were implemented and applied in three different ways including slice-wise lesion detection in 2D images using semantic segmentation, slice-wise lesion detection in 2D images using sliding window technique as well as straightforward detection of lesions via semantic segmentation in whole 3D CT scans. The algorithms demonstrate superior performance compared to algorithms based on conventional image analysis methods.
1. INTRODUCTION
1.1 Conventional approaches
An automatic highlighting of lung tuberculosis (TB) lesions in CT images is one of important problems in corresponding CAD systems, PACS environment and thematic web-portals. Automatic detection of lung lesions is a complicated problem due to a large variety of lesion types. Lung lesions could be very different in size (e.g., nodules and lung masses). They may have different location and different internal structure. For instance, the internal structure of lung cancer tumors looks like a solid neoplasm whereas lesions of miliary tuberculosis are spread with rather textural appearance. Also, lesions may have some specific shape and intensity features characteristic for certain diseases. Thus, automatic lesion detection algorithms require large amount of training data.
Recently several methods are suggested for this problem. The most popular of them are based on the approach suggested in (van Ginneken, B., 2003) which considers local histograms of a collection of filtered versions of the image. Some trials were made using the concept of image superpixels (Liauchuk, V., 2016). A number of conventional image analysis methods were compared on the task of classification of 3D CT images into one of five different types of tuberculosis (Kovalev, V., 2016a) using a dataset of 500 CT scans. Most of the methods demonstrated moderate classification performance.
1.2 Emergence of Deep Learning
Recently, a novel concept of so called Deep Learning which utilizes Deep Convolutional Networks has been emerged drastically. Currently, Deep Learning is used for a great variety of computer science tasks such as image classification, semantic segmentation, object detection and localization, etc. A number of studies has proven the efficiency of utilizing Deep Convolutional Networks in biomedical image analysis tasks
(Ravi, D., 2017; Zhou, S., 2017; Litjens, G., 2017.). Several studies accomplished by authors on the use of Convolutional Neural Networks for histology image classification in breast cancer diagnosis (Kovalev, V., 2016b), lung segmentation (Kalinovsky, A. 2016) and lung lesion detection in computed tomography images of tuberculosis patients confirms the applicability and power of Deep Learning methods in medical imaging domain.
The purpose of this study is to examine the abilities of Deep Convolutional Networks to automatically detect different types of tuberculosis lesions and to compare them to conventional methods on a dataset of manually labeled 3D CT scans.
2. MATERIALS
2.1 Original CT scans
For this study, a total number of 500 3D CT images of tuberculosis patients (one image per patient) were used. Each 3D CT image consisted of 50–400 2D slices of 512×512 pixels in size. Slice thickness varied from 1.25 to 5 mm, though for most images it was 2.5 mm. The variety of lesions was represented by five different types of tuberculosis: infiltrative, focal, tuberculoma, miliary, and fibro-cavernous. On each CT image, tuberculosis lesions were manually segmented under supervision of a qualified radiologist (see Figure 1).
Figure 1. Example slices of manual 3D CT lesion labeling
Also, 3D masks of segmented lungs were available for each image for better identification of regions of interest. The masks were generated automatically using a method based on 3D image registration.
Further, this dataset of 500 CT scans was sub-sampled, divided into groups and processed differently for different techniques of lesion detection as described below.
2.2 Dataset for sliding-window technique
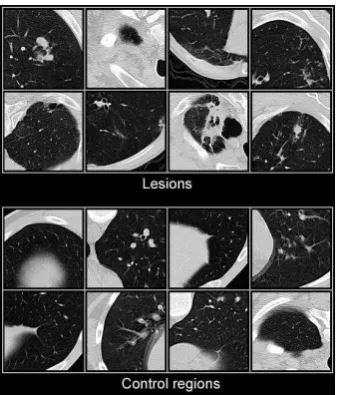
From the total amount of 500 CT scans, 338 CT images corresponding to unique patients were selected for automatic extraction of 2D CT-slice regions of interest (ROIs) of size 128×128 pixels. The square ROIs corresponded to two classes: (1) regions without any visible TB lesions (controls); (2) regions with TB lesions. The automated extraction procedure followed by manual selection of appropriate ROIs of "TB" class resulted in a total number of 149,273 ROIs including 37,262 ROIs containing lung lesions (any type) and 112,011 control ROIs. Finally, all ROIs were resized to 256×256 pixels to fit the requirements of the Deep Convolutional Network utilized. Examples are presented in Figure 2.
Figure. 2. Examples of lung lesions and control CT image regions
2.3 Dataset for 2D slice-wise segmentation technique
As it was in the previous case, 338 CT images of unique patients were selected for this task. A total number of 39 000 2D slices were sampled from original 3D CT scans. For each slice two neighboring slices were used to compose a single RGB image in order to use spatial information along Z-axis of original CT images. Finally, each 512×512 pixel slice was split into four quadrants of size 256×256 to better fit the architecture of the Deep Convolutional Network used with this study. Thus, from 270 training CT images a total number of 123 788 2D slice quadrants were extracted. Validation set consisted of 32 212 slice quadrants extracted from the remaining 68 CT scans.
For each slice quadrant a corresponding label image was composed using manually labeled lesion data (see Figure 3). In total 3 classes of pixels were present on label images: non-lesion regions (marked with black), non-lesion regions (marked with blue), and so called “don’t-care” regions (marked with grey). “Don’t-care” label was assigned to all the pixels which lay outside of lung region and to a thin border between lesion and non-lesion region. When put into the Deep Neural Network, such regions are completely ignored from consideration by the algorithm both during training and validation stages which allows to better focus the available computational facilities on the actual regions of interest.
Figure. 3. Examples of CT slice quadrants and the corresponding class labels for slice-wise semantic segmentation
2.4 Dataset for 3D segmentation technique
The task of lesions detecting in CT chest images can be divided into two almost independent steps: (1) lung boundary segmentation in chest area, (2) lesions regions detection (preferably segmentation) in the chest area. Both problems can be solved by using different image analysis algorithms. With this study, both problems were solved using a single approach based on Deep Convolutional Neural Networks model for semantic segmentation (Badrinarayanan, V., 2015; Farabet, C., 2013). In our experiments, we used manually labeled 3D CT chest images of patients of patients with five types of tuberculosis: infiltrative, focal, tuberculoma, miliary, fibro-cavernous.
The essential difference between the size of the lesions for different types of tuberculosis is one of the main difficulties in solving the problem. In the case of very small lesions, there need to work on high-resolution CT images. For this reason at
areas of lesions: “Infiltrative” and “Fibro-cavernous”. Thus, a total number of 200 CT scans were used for training and testing of lesion segmentation algorithms. To evaluate the quality of the model and to be able to control the learning process, we divided data on a 70/30 percent for training and validation respectively.
3. COMPARISON WITH CONVENTIONAL METHODS
This preliminary study is aimed at assessing the capability of Deep Neural Networks to distinguish CT image regions with lesions from control regions and its comparison with conventional image analysis methods. For this purpose the dataset described in section 2.2 was used within a 5-fold cross validation procedure.
3.1 Conventional methods
Conventional methods of image classification were based on a typical procedure which includes calculation of image descriptors, reducing feature space by Principal Component Analysis method and supplying the relevant principal components into a Linear model and Random Forest classifier. The commonly known histograms of Local Binary Patterns (Pietikäinen, M., 2011) as well as 2D version of extended co -occurrence matrices (Kovalev, V., 1996; Kovalev, V., 2001) which fuse the intensity, gradient magnitude, and anisotropy image properties were used as image descriptors. In addition, we calculated also the commonly known Histograms of Oriented Gradients and Banks of Filters.
3.2 Deep Learning method
The GoogLeNet Convolutional Neural Network was trained in classification mode using Nvidia Deep Learning GPU Training System (DIGITS) interface. DIGITS integrates the popular Caffe deep learning framework which supports GPU acceleration using cuDNN to massively reduce training time. The training was performed on a personal computer equipped with Intel i7-6700K CPU and dedicated GPU of Nvidia TITAN X type with 3072 CUDA Cores and 12 GB of GDDR5 onboard memory. The network training parameters were set to the following values: Number of epochs=120, Activation function=ReLu, Batch size (minimum size to place network in GPU memory)=64, Number of iterations=220,000, Solver type=SGD Caffe solver. No image data augmentation procedures applied to extend the training set.
3.3 Results and comparison
The performance of methods was assessed using area under ROC-curve (AUC). Conventional methods provide relatively low classification performance with AUC values of 0.811 for Histograms of Oriented Gradients, 0.834 for Filter Banks, 0.849 for LBP features, and finally 0.874 for extended co-occurrence matrices. Combining all above image descriptors into one table, entering it into PCA and performing classification using the relevant output principal components provides even better classification quality with AUC=0.895. Nevertheless, the Deep Learning approach employing GoogLeNet provides substantially better results with AUC value as high as 0.969.
4. LESION DETECTION
4.1 Lesion detection using sliding-window technique
At this stage GoogLeNet was trained on the training set 118 409 2D ROIs (89 476 control ROIs and 28 933 ROIs with lesions) neural network image regions were resized to 256×256 pixels to fit the network architecture. Finally, the lesion probabilities provided by neural network were averaged and the resultant 3D lesion-probability maps were composed. Examples are shown in Figure 4.
Figure 4. Examples of lesion-probability maps obtained via sliding-window technique
4.2 Lesion detection using slice-wise segmentation
At this stage the dataset described in section 2.3 was used with exactly the same CT scans used for both training and validation as it was in the case of sliding window technique. For segmentation of lesions in 2D slices a Fully Convolutional Network Alexnet (Long, J., 2015) was used. In order to increase convergence rate and overall accuracy, a publically available ILSVRC2012-trained model was used to initialize the network’s weights.
The training was performed using NVIDIA DIGITS interface and Caffee framework. The network training parameters were set to the following values: Number of epochs=120, Activation function=ReLu, Batch size=64, Solver type=SGD Caffe solver. Learning Rate was set to 0.001 for the first 20 epochs, 0.0001 for the next 20 and 0.00001 for the last 20 ones. Finally, the trained network demonstrated 88.7% of segmentation accuracy on the validation set.
The resultant 2D probability maps of slice quadrants were used to compose final 3D lesion probability maps. Examples are shown in Figure 5.
Figure 5. Examples of lesion-probability maps obtained via slice-wise segmentation technique
4.3 Lesion detection using 3D semantic segmentation
At this stage the general scheme of neural network type Convolutional Encoder-Decoder was used as a deep learning model (Figure 6).
Figure 6. A general scheme of the deep neural network used for segmentation and detection of the lesion of the lung
This model is suitable for solving the problem of semantic segmentation for both 2D and 3D images. In the case of 3D images, we simply use the 3D convolution, and input-output shape of data structures is increased by one dimension. To obtain high accuracy in the segmentation task it is necessary to use high-resolution source images chest area. However, this approach is difficult to implement since high-resolution Deep Neural Network 3D model requires large amount of memory on the stage of training and validation. Therefore, we used an intermediate approach for chest lung segmentation problem. As an input to the neural network we applied several layers (1-5) of CT 3D image. The output of the network matched to the 2D mask of central layer. Several experiments were carried out with different numbers of CT-layers. In addition, we compared two methods for Decoding part of network: simple and interpolated. Model with three layers and interpolation allows obtaining the best result. Using this approach, we have increased the quality of lung segmentation of from 0.89 (128x128x64 with 3D convolution) to 0.95 (2D convolution with multiple slices) of IoU (intersection of union) score.
For the task of lesion detection we used a 3D model of the input-output data for low-resolution (128x128x64) CT images. The example results are shown in Figure 7.
Figure 7. Examples of lesion-probability maps obtained via 3D semantic segmentation technique
5. CONCLUSIONS
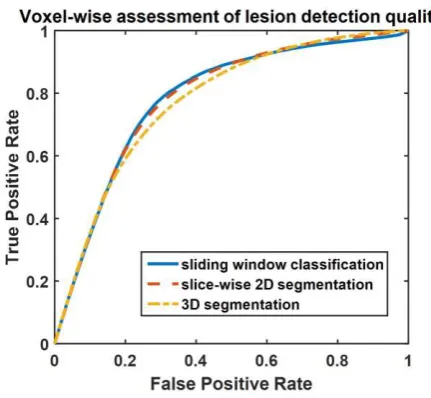
The three mentioned methods of lesion detection in 3D CT images were assessed and compared using Receiver Operating Characteristic (ROC) curves. Such approach allows working directly with lesion probabilities of voxels without setting up any thresholds, optimal values of which can be different for different lesion detection methods.
The assessment was performed with use of CT images from validation dataset in a rather straightforward voxel-wise manner without any post-processing of the obtained probability maps. The resultant ROC-curves can be seen in Figure 8.
Figure 8. ROC-curves for voxel-wise lesion detection for the three techniques considered.
In the result, 2D sliding-window and 2D slice-wise techniques demonstrated comparable results with areas under ROC-curve being equal to 0.784 and 0.785 respectively. Lesion detection technique based on 3D convolution however demonstrated a bit poorer results with area under curve equal to 0.775. This may explained by significant reduction of image size during the training stage of 3D-based algorithm which caused some loss of information. Moreover, the manual lesion segmentation which is used both for training and testing with this study needs to be
of the methods performance. Further investigations on the influence of training image size and post-processing of lesion probability maps on the final quality are required.
Methods based on Deep Learning proved to be a promising tool for detection of lesion in 3D CT images and many other biomedical image analysis tasks.
ACKNOWLEDGEMENTS
This study was supported by the National Institute of Allergy and Infectious Diseases, National Institutes of Health, U.S. Department of Health and Human Services, USA through the CRDF project OISE-16-62631-1.
REFERENCES
Badrinarayanan, V., 2015. A Deep Convolutional Encoder-Decoder Architecture for Image Segmentation. arXiv: 1511.00561.
Farabet, C., 2013. Learning hierarchical features for scene labeling. IEEE PAMI, 35 (8), pp. 1915–1929.
van Ginneken, B., 2003. Multi-scale texture classification from generalized locally orderless images. Pattern Recognition, 36(4), pp. 899-911.
Kalinovsky, A. 2016. Lung image segmentation using Deep Learning methods and convolutional neural networks . In: XIII Int. Conf. on Pattern Recognition and Information Processing, 3-5 October, Minsk, pp. 21-24.
Kovalev, V., 1996. Multidimensional co-occurrence matrices for object recognition and matching. Graphical Models and Image Processing, 58(3), pp. 187-197.
Kovalev, V., 2001. Three-dimensional texture analysis of MRI brain datasets. IEEE Transactions on Medical Imaging, 20(5), pp. 424-433.
Kovalev, V., 2016a. Towards a lung tuberculosis CAD: selecting the CT image analysis method, In: Proc. 30th Int. Congress and Exhibition on Computer Assisted Radiology and Surgery, Heidelberg, Germany, Vol. 11, pp. 127-128
Kovalev, V., 2016b. Deep Learning in Big Image Data: Histology image classification for breast cancer diagnosis. In: Big Data and Advanced Analytics, Minsk, pp. 44-53.
Liauchuk, V., 2016. A method for highlighting lung tuberculosis lesions in CT images using superpixel approach. In: Proc. 30th Int. Congress and Exhibition on Computer Assisted Radiology and Surgery, Heidelberg, Germany, Vol. 11. pp. 277-278.
Litjens, G., 2017. A Survey on Deep Learning in Medical Image Analysis, arXiv:1702.05747, 34 p.
Long, J., 2015. Fully Convolutional Networks for Semantic Segmentation. The IEEE Conference on Computer Vision and Pattern Recognition (CVPR), pp. 3431-3440.
Pietikäinen, M., 2011. Computer Vision Using Local Binary Patterns. Volume 40, Springer-Verlag, London, ISBN 978-0-85729-747-1, DOI 10.1007/978-0-85729-748-8.
Ravi, D., 2017. Deep Learning for Health Informatics. IEEE Journal on Health and Biomedical Informatics, 21(1), pp. 4-21.
Zhou, S., 2017. Deep Learning for Medical Image Analysis. Academic Press, ISBN: 9780128104088, 2017, 458 p.