Michael Young
Google Maps
Mashups
with Google Mapplets
115
PAGES
Available as a
About firstPress
Apress's firstPress series is your source for understanding cutting-edge technology. Short, highly focused, and written by experts, Apress's firstPress books save you time and effort. They contain the information you could get based on intensive research yourself or if you were to attend a conference every other week—if only you had the time. They cover the concepts and techniques that will keep you ahead of the technology curve. Apress's firstPress books are real books, in your choice of electronic or print-on-demand format, with no rough edges even when the technology itself is still rough. You can't afford to be without them.
Google Maps Mashups with Google Mapplets
Dear Reader,
Mashups, the mixing together of multiple data sources in a single application, have exploded across the Web, ushering in a parade of innovative tools and applications. With content providers exposing more and more of their data through feeds and APIs and with companies like Google creating great tools such as Google Maps and Mapplets, you now have the ability to create applications that weren’t possible a few years (and sometimes even months) ago…it’s a great time to be a developer!
I wrote Google Maps Mashups with Google Mapplets to help show how simple it can be to build map-based applications using multiple data sources and APIs.
This book will introduce you to the Google Mapplets API, showing you the key basics such as how to annotate maps with markers and how to respond to user events. After learning about the Mapplet API, you will dive right in to creating a map-based mashup by “mashing up”
Tourfilter’s concert XML feeds, Eventful’s venue search API, and Google Mapplets. In the end, you’ll know how to build the server and mapping code for a mashup that dynamically maps Tourfilter concerts for more than 60 cities on a Google Mapplet.
I hope you take what you learn from this book and apply it to your own ideas to create the next round of innovative mashups.
Be creative and build something beautiful! Michael Young
Creative Technologist
Contents
Part 1: Getting Started with Google Mapplets ... 1
Chapter 1: Introducing Google Mapplets ... 3
What’s a Mapplet? ...4
Getting Started with Mapplets...6
Installing the Developer Tools ...6
Creating Your First Mapplet ... 8
Adding a Map... 10
Adding an Info Window ... 15
Making the Marker Clickable ... 18
Responding to Mapplet Events... 21
Using Dynamic Markers and Setting Map Bounds ... 25
How Mapplets Differ from Standard Google Maps ...30
Easy API Initialization ... 30
Requesting Data from Remote Servers ... 31
Communicating Between Your Application and the Map ... 32
Info Window Restrictions ... 33
Summary ...33
Chapter 2: Using Remote Data in Your Mapplets ...35
Data Feed Formats ...35
CSV: The Equivalent of Cave Paintings ... 35
XML: The Worldwide Format ... 36
JSON: The Programmer-Friendly Format ... 38
Retrieving Remote Content with Mapplet APIs ...39
Retrieving Text ... 40
Making Mapplets More Interactive ... 43
Retrieving XML... 47
Mapping Remote XML Data ... 51
Google’s Data Cache... 56
Summary ...56
Part 2: Creating the Mashup ... 57
Chapter 3: Geocoding Web Content ...59
Identifying Good Content for Mashups ...59
Your Mashup Data Sources: Tourfilter and Eventful ... 62
The Boring (But Important) Requirements ...63
Determining Whether You Have the Proper Software Installed ... 64
Getting an Eventful Developer Account ... 65
Using Third-Party Content in Your Own Applications... 65
Retrieving Tourfilter Concert RSS Feeds ...65
Parsing Venue Location from the Tourfilter Feeds ... 70
Looking Up the Venue Location with Eventful’s API ...76
Eventful Venue Search API... 77
Creating the Eventful Library ... 80
Using Your Eventful Library ... 81
Geocoding Tourfilter Data ...83
Chapter 4: Creating Geocoded Data Feeds...87
Creating an XML Data Feed ...87
Examining the Code ... 88
Using Caching to Speed Up Your Geocoding ...88
Examining the Code ... 90
Storing Venue Information in the Cache ... 91
Speeding Things Up ... 92
A Few Things to Consider ... 96
Adding More Cities! ...96
Examining the Code ... 97
Automating the Script Using cron ...98
Summary ...100
Chapter 5: Finalizing the Mashup ...101
Displaying the Geocoded Data on a Mapplet ...101
Planning the Mapplet ... 102
Adding the Full List of Cities ... 106
Styling the Mapplet...109
Examining the Code ... 110
Installing Your Mapplet ...111
Next Steps...113
Multiple Markers in Same Location ... 113
User Preferences in Mapplets ... 114
GeoRSS and KML ... 114
Build Your Own! ... 115
Submitting Your Mapplet to the Google Directory ... 115
Google Maps Mashups with
Google Mapplets
By Michael Young
How did it happen so quickly? Since 2005, when Google released its Google Maps API, thousands of applications have been created that let users browse a variety of content (news, images, real estate listings, election results, and so on) using a map. Geographic context, aka maps, provide a powerful and pleasant way to explore and browse many kinds of content.
In July 2007, Google launched Mapplets, which allows developers to create applications that overlay data on maps, similar to the Maps API but with a key difference. Now you can run your own geo-based mashups within Google Maps and make it available to all users of Google Maps (at http://maps.google.com).
Google Maps Mashups with Google Mapplets is a hands-on guide to creating mashups (combining multiple content sources and services into a single application) with Google Mapplets. This book is split into two parts. The first part covers the basics of Google Mapplets, taking you through simple examples of some of the common Mapplets APIs. The second part shows you how to create a map-based mashup. The book walks you through the steps of creating an application that combines multiple data feeds
(Tourfilter concert data), a concert venue search and geocoding API (from Eventful), and the Google Mapplets APIs. In the end, you will have created a mashup that
dynamically maps Tourfilter concerts for 60 cities on a Google Mapplet. The basics of data feeds and formats, APIs, and caching are covered—all essential tools when creating mashups.
This book is for developers who want to explore and create geographic-based mashups. The code examples in the book use JavaScript and PHP, so familiarity with both will help. All the server-side examples use PHP, but you can apply the same lessons using other programming languages.
The source code for the book is available on the Apress web site
Chapter 1: Introducing Google Mapplets
When the Google Maps API was released in June 2005, there was an explosion of location-related software development. Craigslist apartment listings, Chicago crime data, Flickr photos, current news events, happy-hour locations, weather, historical sites, public transportation...just about any piece of content imaginable could be overlaid on a map using this API with a little JavaScript.
Fast-forward a few years. So many web sites have a mapping component that at least two sites are dedicated to tracking this phenomenon: Google Maps Mashups (http://googlemapsmania.blogspot.com) and Programmable Web
(http://programmableweb.com). According to Programmable Web, nearly 1,200 of the 1,400 mapping applications are using the Google Maps API—and this is just for the sites Programmable Web is tracking.
In the past, all these map-based applications lived on developer or third-party web sites. However, with the release of Google Mapplets, developers can now create map-based applications (or port their current Google Maps applications) and expose them to every user of Google Maps at http://maps.google.com. Google handles the hosting and bandwidth of your application and provides a directory of Mapplets so that users can find your application.
Do I have you on the edge of your seat? Good—let’s dive in. In this chapter, you will learn the following:
The basics of Mapplets
The developer tools you can use to aid in Mapplet development How to write your first Mapplet
How to use the Google Mapplets APIs to plot data on a map
What’s a Mapplet?
Mapplets are small web applications that run within Google Maps. They are a
type of Google Gadget—the framework that allows developers to create small web applications that can run within iGoogle, Google Maps, Orkut, or any web page outside Google. Mapplets use the basic concepts and APIs of Google Gadgets, though they are specifically used within the Google Maps realm.
In its basic form, a Mapplet is an XML file that contains the HTML and JavaScript that make up your application. Mapplets have two components: A web application that is displayed on the Google Maps site at
http://maps.google.com. This application is typically displayed in the lower-left corner of the page on http://maps.google.com.
JavaScript that lets you control the map on http://maps.google.com, retrieve external data, or even store and retrieve user preferences.
After you create your Mapplet, it’s up to you to host the Mapplet XML file containing your HTML and JavaScript. When a user installs your Mapplet, Google will grab the Mapplet XML file from your server and display it within an
<iframe> element on http://maps.google.com. (An <iframe> is an HTML element that is used to embed HTML from another web site in a web page.) In this case, Google uses an <iframe> element to embed your Mapplet in
http://maps.google.com.
Google will cache your Mapplet source and serve it from its own servers at
http://gmodules.com. This is done for a few reasons:
To restrict your Mapplet’s JavaScript from doing anything harmful such as accessing a user’s cookies on http://maps.google.com
To reduce the load on your site from the potential high number of users you’ll have
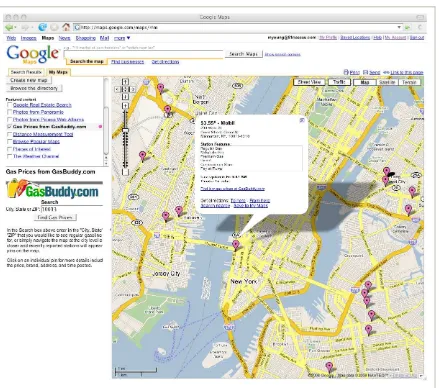
You’ll learn more about how to create Mapplets in this chapter, but before you do, let’s take a look at a live Mapplet. Open your browser to
http://maps.google.com/. Click the My Maps tab, and you will see a list of
prices, and you’ll see a Mapplet in action. Figure 1-1 shows the Gas Prices from GasBuddy.com Mapplet. This Mapplet consists of the application, at the bottom of the left column, and all the map interaction. If the Gas Prices Mapplet is available in your list of featured Mapplets, give it try—enter your ZIP/postal code in the search box, and see what the gas prices are in your area.
Getting Started with Mapplets
Now that you have a general idea of what a Mapplet is, it’s time to roll up your sleeves and start developing. First you’ll need to set up your development environment.
Note Before you can create your first Mapplet, you must have a
Google account. If you already have a Gmail account, you are good to go. If you don’t have a Gmail or Google account, you can set one up at
https://www.google.com/accounts.
Installing the Developer Tools
Using either Firefox, Safari, or Internet Explorer (version 6 or newer), go to
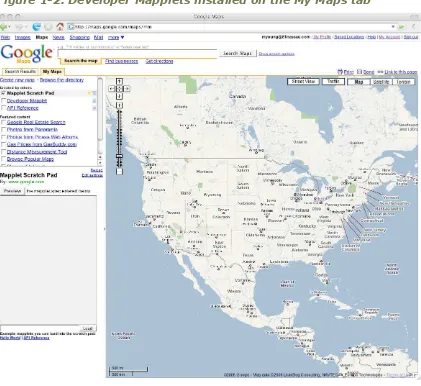
http://maps.google.com/maps/mm, and sign in using your Google account. First install the three developer modules that Google has created for Mapplet development: the Mapplet Scratch Pad, the Developer Mapplet, and the API Reference Mapplet. You can find these Mapplets in the Developer Tools section of the Google Maps Directory
(http://maps.google.com/ig/directory?synd=mpl&pid=mpl&cat=devtools). The Mapplet Scratch Pad lets you develop Mapplets right in
http://maps.google.com. You’ll be able to cut and paste all of the following code samples in the scratch pad and immediately see the application.
The Developer Mapplet places a Reload link at the top of each Mapplet that you have installed. The Reload link automatically reloads the source code for the Mapplet you are viewing (or developing). Since Google caches Mapplet source code, you’ll need this for developing and testing Mapplets. Trust me on this one!
The API Reference Mapplet is a simple application that displays all the possible Mapplets API calls.
Creating Your First Mapplet
For your first Mapplet, you’re not even going to “touch” a map. Let’s start by creating a simple “shell” Mapplet without any map API calls. You’ll get to the map in the next example.
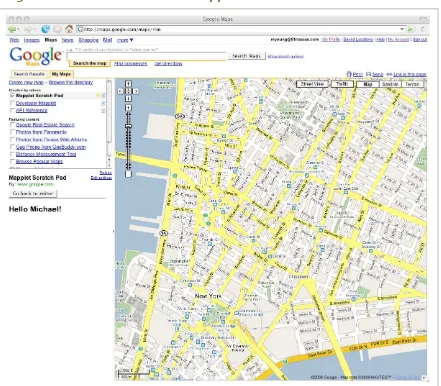
Make sure you are at http://maps.google.com/maps/mm and that you’ve selected the Mapplet Scratch Pad. You should see the Mapplet Scratch Pad in the lower-left corner of the page.
Cut the XML from Listing 1-1, and paste it into the Mapplet Scratch Pad. Click the Preview button in the Mapplet Scratch Pad. Figure 1-3 shows the
“Hello World” Mapplet that you should see.
Listing 1-1. “Hello World” Mapplet
<?xml version="1.0" encoding="UTF-8"?> <Module>
<ModulePrefs title="Hello World" description="My First Mapplet" author="Michael Young"
author_email="[email protected]" height="150">
</ModulePrefs>
<Content type="html"><![CDATA[
<h2>Hello Michael!</h2>
Examining the Code
Let’s break down the “Hello World” example. First you’ll notice that it’s just a simple XML file. This is the standard Mapplet shell XML file that you’ll use with most of the Mapplet code in this book. Here is a look at each of the tags in the XML file:
Mapplets, which are Google Gadgets, are XML files and must start with the following XML declaration: <?xml version="1.0" encoding="UTF-8"?>. The <Module> tag is the root tag of the Mapplet. Google Gadgets used to be
called modules, which is where the name came from.
The <ModulePrefs> tag contains Mapplet preferences and settings information, such as title, description, author’s name, and e-mail.
The <Content type="html"> tag indicates that the Mapplet is of type html. The
<Content> tag will contain all the HTML and JavaScript of the Mapplet. The <![CDATA[...]]> section contains the Mapplet HTML and JavaScript. The
CDATA section is used to tell the Mapplet parser to treat anything inside the section as text, not XML. In this example, you are simply displaying the “Hello World” message: <h2>Hello Michael!</h2>.
Easy, right? In the next example, you’ll actually add a map to your application.
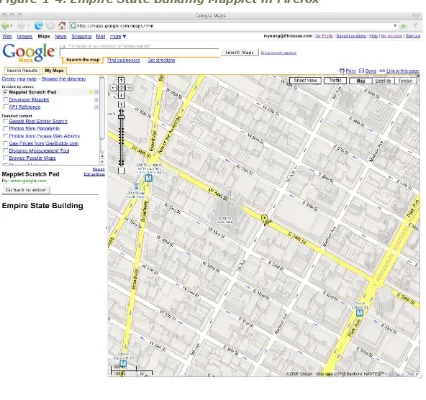
Adding a Map
So, the previous example showed the shell of a Google Mapplet/Gadget. Now let’s do some mapping. In this example, you’ll create a map and add a marker indicating the location of the Empire State Building. You’ll also center the map on this point.
1. In the Mapplet Scratch Pad, click the “Go back to editor” button to display the scratch pad editor.
2. Cut the XML from Listing 1-2, and paste it into the Mapplet Scratch Pad.
Listing 1-2. Create a Map and Add a Marker to the Map
<?xml version="1.0" encoding="UTF-8"?> <Module>
<ModulePrefs title="Empire State Building"
description="Creating a Simple Map and Marker" author="Michael Young"
author_email="[email protected]" height="150">
<Require feature="sharedmap"/> </ModulePrefs>
<Content type="html"><![CDATA[
<h2>Empire State Building</h2>
<script>
// Create a map and center it over the Empire State Building var map = new GMap2();
var point = new GLatLng(40.748330, -73.984615); map.setCenter(point, 17);
// Add a marker right on the Empire State Building var marker = new GMarker(point);
map.addOverlay(marker);
</script>
Examining the Code
Congratulations, you’ve created your first, er, second, Mapplet! Go ahead, pat yourself on the back. I can wait. OK, good, now let’s take a look at the code to see what’s new in this one.
First, and most important, you added <Require feature="sharedmap"/> to the
<ModulePrefs> tag. By adding this tag, the Mapplet JavaScript is loaded so that your Mapplet can control the map.
Tip To load the Mapplets API, add the <Require feature="sharedmap"/>
tag inside the <ModulePrefs> tag of your Mapplet XML file.
Next, inside the <Content> section, where the main application code resides, you added some JavaScript inside a <script> tag. This is where all the JavaScript that communicates with the map resides.
This example has introduced three Google Maps API classes: GMap2, GLatLng, and
GMarker. Let’s talk through each of these line by line.
The first line of code creates an instance of the GMap2 class and assigns it to the variable map. The map variable is now a reference to the map on
http://maps.google.com.
var map = new GMap2();
Now that you can control the map, center it over the Empire State Building in New York. To center the map, you need to specify the latitude and longitude of the center point—the Empire State Building in this case. You can create a point using the GLatLng class:
var point = new GLatLng(40.748330, -73.984615);
GEOCODING: CONVERTING ADDRESSES TO LATITUDE AND LONGITUDE
Geocoding is the process of converting a location into a latitude and longitude pair. Location in this case can refer to a country, city, street, or address. For example, the address of the Empire State Building—350 5th Avenue, New York, NY—has a latitude of 40.748330 and a longitude of –73.984615.
Throughout the book, you will be converting addresses to latitude and longitude so that you can place locations on the map. You’ll notice that many of the Mapplets API calls, such as creating a point and placing an info window on the map, require you to know the latitude and longitude of the location.
You can find many geocoding services on the Web to help you convert addresses to latitude and longitude. Google even has a Geocoding API so that you can create your own geocode tools. For the examples in this chapter, I’m using a simple tool that I built using the Google Maps and Geocode APIs, which will display the latitude and longitude of an address. You can find the tool here:
http://81nassau.com/demos/geocode/.
Now that you have your point, you can center the map using the setCenter()
method. The setCenter() method takes two arguments: the point where you want to center the map and the zoom level:
map.setCenter(point, 17);
Finally, you place a marker on the map right on the Empire State Building. The marker code is pretty simple. Just create a new GMarker object, and add it to the map using the addOverlay() map method. To create the GMarker, you’ll need to pass in the point object (GLatLng) you created earlier.
var marker = new GMarker(point); map.addOverlay(marker);
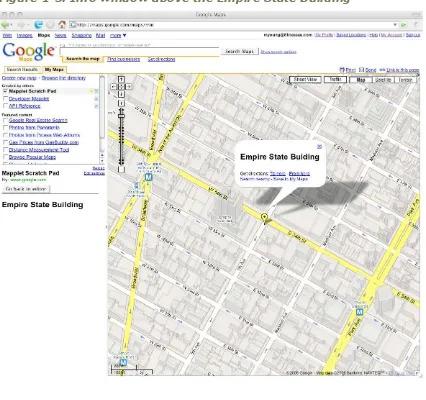
Adding an Info Window
The previous example put a marker on the map, but it didn’t really tell you much. If you’re placing a marker on the map, it would be nice for the marker to tell what it’s pointing at, right? Fortunately, the Google Mapplets API lets you display an info window on the map. You can create as many info windows as you want, but you can show only one info window at a time. Let’s modify the previous example to display an info window above the maker on the Empire State Building when the map first loads.
An info window can display HTML and CSS but for security reasons cannot contain JavaScript. You can find a list of the HTML and CSS allowed in info windows at http://www.google.com/apis/maps/documentation/mapplets/
infowindowallowed.html.
1. In the Mapplet Scratch Pad, click the “Go back to editor” button to display the scratch pad editor.
2. Cut the XML from Listing 1-3, and paste it into the Mapplet Scratch Pad.
3. Click the Preview button in the scratch pad. You should see the Mapplet shown in Figure 1-5.
Listing 1-3. Add an Info Window Above the Empire State Building Marker
<?xml version="1.0" encoding="UTF-8"?> <Module>
<ModulePrefs title="Empire State Building"
description="Adding an Info Window to our Map" author="Michael Young"
// Create a map and center it over the Empire State Building var map = new GMap2();
var point = new GLatLng(40.748330, -73.984615); map.setCenter(point, 17);
// Add a marker right on the Empire State Building var marker = new GMarker(point);
map.addOverlay(marker);
// Open an Info Window
var info = "<h2>Empire State Building</h2>"; marker.openInfoWindow(info);
</script>
Examining the Code
In this example, you just added a single line of code to display an info window above the marker that you created marking the location of the Empire State Building:
marker.openInfoWindow(info);
openInfoWindow() takes an HTML DOM element as an argument. In this case, you’re displaying “Empire State Building” in bold text. The HTML is displayed over the marker when the map loads.
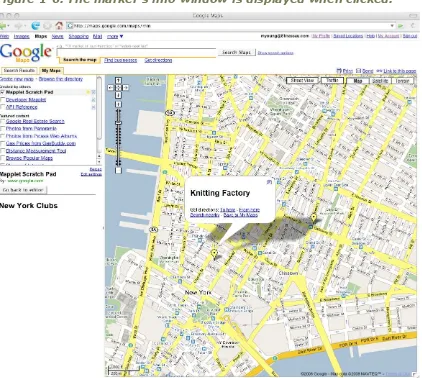
Making the Marker Clickable
In the previous example, you displayed the info window above your marker as soon as the map loaded. Let’s take that a step further by adding multiple markers to the map and an info window that displays when a user clicks the marker. The Mapplets API provides a simple method to display an info window when a marker is clicked.
Please note that I’m moving on from the Empire State Building example. You’re working your way toward a mashup where you are going to map various bars, clubs, and venues. In this next example, you’ll add a few New York clubs to the map, the Knitting Factory and the Bowery Ballroom:
1. In the Mapplet Scratch Pad, click the “Go back to editor” button to display the scratch pad editor.
2. Cut the XML from Listing 1-4, and paste it into the Mapplet Scratch Pad.
3. Click the Preview button in the scratch pad. You should see the Mapplet shown in Figure 1-6.
Listing 1-4. Display the Info Window When Each Marker Is Clicked
<?xml version="1.0" encoding="UTF-8"?> <Module>
<ModulePrefs title="New York Clubs"
description="Adding Clickable Info Windows to Our Map" author="Michael Young"
height="150">
<Require feature="sharedmap"/> </ModulePrefs>
<Content type="html"><![CDATA[
<h2>New York Clubs</h2>
<script>
// Create a map
var map = new GMap2();
// Create two points and markers:
// One for the Knitting Factory and one for the Bowery Ballroom var pointKF = new GLatLng(40.7173, -74.0053);
var pointBB = new GLatLng(40.7205, -73.9937);
// Now create the markers
var markerKF = new GMarker(pointKF, {title: "Knitting Factory"}); var markerBB = new GMarker(pointBB, {title: "Bowery Ballroom"});
markerKF.bindInfoWindow("<h2>Knitting Factory</h2>"); markerBB.bindInfoWindow("<h2>Bowery Ballroom</h2>");
// Add the markers to the map map.addOverlay(markerKF); map.addOverlay(markerBB);
// Center the map over Manhattan so we can see both markers map.setCenter(new GLatLng(40.7204, -73.9998), 15);
</script>
Figure 1-6. The marker’s info window is displayed when clicked.
Examining the Code
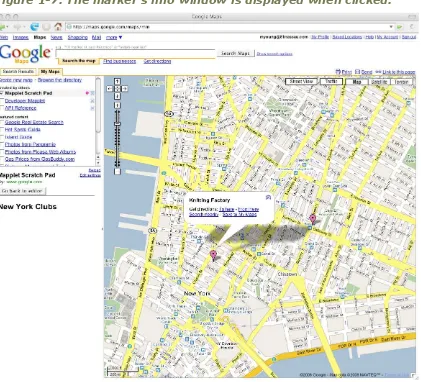
Responding to Mapplet Events
The Mapplets API includes functions that allow you to respond to user
interactions with the map, such as moving the map or clicking a marker. When an interaction occurs, say a user clicking a marker, a JavaScript event is
triggered. The Mapplets API allows you to respond to these events, adding any custom behavior you want after receiving the event. In this example, you’ll take a look at how to display an info window after a marker is clicked. This example is functionally the same as the previous example in Listing 1-4, but you’ll respond directly to the “click” event in this example.
1. In the Mapplet Scratch Pad, click the “Go back to editor” button to display the scratch pad editor.
2. Cut the XML from Listing 1-5, and paste it into the Mapplet Scratch Pad.
3. Click the Preview button in the scratch pad. You should see the Mapplet shown in Figure 1-7.
Listing 1-5. Display the Info Window When Each Marker Is Clicked
<?xml version="1.0" encoding="UTF-8"?> <Module>
<ModulePrefs title="New York Clubs"
description="Responding to Mapplet Events" author="Michael Young"
author_email="[email protected]" height="150">
function createMarker(point, venue) {
var marker = new GMarker(point, {title: venue});
marker.openInfoWindowHtml(html); });
return marker; }
// Create a map
var map = new GMap2();
// Create two points and markers:
// One for the Knitting Factory and one for the Bowery Ballroom var pointKF = new GLatLng(40.7173, -74.0053);
var pointBB = new GLatLng(40.7205, -73.9937);
// Now create the markers
var markerKF = createMarker(pointKF, "Knitting Factory"); var markerBB = createMarker(pointBB, "Bowery Ballroom");
// Add the markers to the map map.addOverlay(markerKF); map.addOverlay(markerBB);
// Center the map over Manhattan so we can see both markers map.setCenter(new GLatLng(40.7204, -73.9998), 15);
</script>
Examining the Code
In this example, you’ve added a reusable function called createMarker() that creates your marker for you and adds your event listener to respond to any clicks on the marker. The arguments you are passing to the createMarker() function are the location of your maker (as a GLatLng object) and the name of the venue.
You can respond to events in the Mapplets API using the static method
GEvent.addListener(). This method takes a few arguments: The object on which you want to add the event listener The event to listen for (“click” in this case)
A function that is called when the event occurs
In this case, you are opening an info window that displays your venue name in bold text after the marker is clicked:
GEvent.addListener(marker, "click", function() { var html = "<b>" + venue + "</b>";
marker.openInfoWindowHtml(html); });
You added two markers to the map but hard-coded the variables (latitude, longitude, and venue name) within the various object constructors. This is fine for this simple example, but it doesn’t scream reusability. In the next example, you’ll implement a Mapplet with a dynamic number of points and markers. Remember, you’re ultimately working toward a mashup where you will pull the venue data from a remote server and place the markers on the map. You’re getting there...it takes baby steps.
I have one more thing to mention here: the last line of this example centered the map using a latitude and longitude pair over downtown Manhattan that I picked because it looked like it was somewhere between the two venue markers:
map.setCenter(new GLatLng(40.7204, -73.9998), 15);
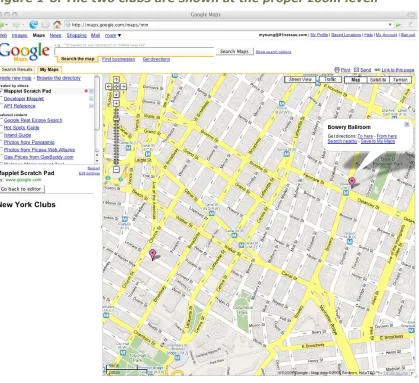
Using Dynamic Markers and Setting Map Bounds
In this example, you’ll clean up the previous example by dynamically adding markers to the map. Instead of hard-coding the data such as latitude, longitude, and info window text in your Mapplet, you will ultimately retrieve this data from an external data source. In the next chapter, you’ll learn how to retrieve this data from an external server/database, but for now you’ll use data structures to store the data.
Since you have multiple markers that you want to create on the map, you’ll need to store the data in a JavaScript array. Arrays in JavaScript look like this:
var venues = [ 'Knitting Factory', 'Bowery Ballroom', 'Warsaw' ];
This is a start, but it gets you only so far. You really need to store more than just the venue name; you also need the latitude and longitude of the venue. Enter JavaScript objects. Objects essentially let you store any combination of name/value pairs and look like this:
var marker = ¬
{ "venue": "Knitting Factory", "lat": 40.7173, "lng": -74.0053 };
OK, now you’re getting closer. The object lets you store all the needed data for a single venue: the venue name, the latitude, and the longitude. Now you can just store multiple objects in an array, and you’re set:
var data = [
{ "venue": "Knitting Factory", "lat": 40.7173, "lng": -74.0053}, { "venue": "Bowery Ballroom", "lat": 40.7205, "lng": -73.9937} ];
You’ll see in the following example how easy it is to iterate (loop) over the data array. You can use the JavaScript for loop to accomplish this:
This example had also introduced some new code that will help center the map and set its zoom level so that you can see all your markers on the map when the map first loads. You had to hard-code the center point and zoom level in the previous examples, and now you can do it dynamically. I’ll talk more about how you do that after you run through the example.
1. In the Mapplet Scratch Pad, click the “Go back to editor” button to display the scratch pad editor.
2. Cut the XML from Listing 1-6, and paste it into the Mapplet Scratch Pad.
3. Click the Preview button in the scratch pad. You should see the Mapplet shown in Figure 1-8.
Listing 1-6. Creating Dynamic Markers on the Map
<?xml version="1.0" encoding="UTF-8"?> <Module>
<ModulePrefs title="New York Clubs"
description="Dynamically Adding Clickable Markers to the Map" author="Michael Young"
author_email="[email protected]" height="150">
function createMarker(point, venue) {
var marker = new GMarker(point, {title: venue});
GEvent.addListener(marker, "click", function() { var html = "<b>" + venue + "</b>";
marker.openInfoWindowHtml(html); });
var data = [
{ "venue": "Knitting Factory", "lat": 40.7173, "lng": -74.0053}, { "venue": "Bowery Ballroom", "lat": 40.7205, "lng": -73.9937} ];
// Create a map
var map = new GMap2();
var bounds = new GLatLngBounds();
var count = data.length;
for (var i = 0; i < count; i++) { var club = data[i];
// Add the marker to the map
var point = new GLatLng(club.lat, club.lng); map.addOverlay(createMarker(point, club.venue));
// Add the point to our bounds object bounds.extend(point);
}
// Find the proper zoom level for the bounds and center the map map.getBoundsZoomLevelAsync(bounds, function(level) {
map.setCenter(bounds.getCenter()); map.setZoom(level);
});
</script>
Figure 1-8. The two clubs are shown at the proper zoom level.
Examining the Code
A lot is going on in this example. First, you’re using an array to store your venue data so you can create a dynamic number of markers on your map:
var data = [
After creating the map, you loop over the data array using a for loop, extracting the venue name, latitude, and longitude for each venue and creating a GLatLng and a GMarker for each venue: map.addOverlay(createMarker(point, club.venue)); //...
}
Remember that the data array is storing JavaScript objects. The line var club = data[i]; will give you a single object from the data array. Now that you have an object stored in the variable club, you can extract the individual fields like this:
club["lat"] or club.lat.
Also notice in this example that you are using the new Mapplet class
GLatLngBounds. This class will ultimately help you center the map so that you can view all the markers on the map when the application first loads. The
GLatLngBounds object will store all the GLatLng points you create, representing the boundary of all the points that you “add” to the bounds object. You add a point to the bounds object with the following code:
bounds.extend(point);
After the for loop completes and has added all the points on the map to the
GLatLngBounds object, you need to set the map’s center point and zoom level so that the view scales to display all the markers. You can use the GMap2 method
getBoundsZoomLevelAsync() to help you with this. To get the proper zoom level for your GLatLngBounds object, you call getBoundsZoomLevelAsync() with two
arguments: the GLatLngBounds object and a callback function. You need the callback here because the getBoundsZoomLevel method is asynchronous—notice the Async at the end of the method name. This means that when you call the method, the Mapplets API will return the proper zoom level once the map
map.getBoundsZoomLevelAsync(bounds, function(level) { map.setCenter(bounds.getCenter());
map.setZoom(level); });
How Mapplets Differ from Standard Google Maps
Google Mapplets API calls are based on the standard Google Maps API, but a few differences are worthy of mention. The following sections illustrate the most important differences between Mapplets and standard Google Maps:
API initialization
Requesting data from remote servers
Communication between your application and the map Info window restrictions
The Mapplet main documentation page (http://www.google.com/apis/maps/ documentation/mapplets/guide.html) includes a complete list of differences.
Easy API Initialization
Initializing the Maps API is a bit easier in Mapplets than with standard Google Maps. You can skip a few steps when creating a Mapplet:
With Google Maps, you need to register your application and obtain an API key before you can get started. The API key is necessary when loading the Google Maps JavaScript library from your application. With Mapplets, you don’t need an API key to get started.
You don’t need to manually load the Google Maps API JavaScript library. Including the <Require feature="sharedmap"/> tag in your Mapplet will automatically load the library for you.
You create a map with the GMap2 class. With Google Maps, you need to pass the <div> element of your map to the GMap2 constructor:
This isn’t needed in Mapplets, because the constructor will return a reference to the map on maps.google.com:
var map = new GMap2();
You don’t need to check whether the browser that loads your Mapplet is compatible with Google Maps. You can assume that your Mapplet’s users have a compatible browser. In fact, the GBrowserIsCompatible check is not supported in Mapplets since you will never need to check for browser compatibility.
Setting the initial position of the map via setCenter() is not required. You can certainly center the map using this method, but the map is already centered for you over your country of residence by default.
Requesting Data from Remote Servers
Web browsers have a built-in security feature that allows JavaScript to access XML data only from the same domain from which it was served. For example, if you have a web page that was served from http://www.nytimes.com, you can’t use JavaScript in that web page to fetch XML from http://www.google.com. This security feature is typically called the same origin policy and protects your application from loading data from a web site that isn’t trusted.
Note The same origin policy is a JavaScript security policy built in to all web browsers. This prevents scripts from one web site from accessing potentially harmful data from another site.
Mapplets are served from a Google domain (gmodules.com), so you cannot use the standard Google Maps API calls GDownloadURL or GXml to request remote data. These API calls can download data only from the web server (domain) that served the application, which in this case is http://gmodules.com.
To request remote data from a Mapplet, use either _IG_FetchContent() or
you can fetch data from your own web server as well as from other remote
servers. Google will also cache the content you retrieve using these APIs in order to reduce the load on the remote servers.
Communicating Between Your Application and the Map
Since communication between a Mapplet and the map is asynchronous, you will need to use callbacks to obtain the value returned from some Mapplets API calls. All Mapplets APIs that require callbacks have Async appended to the name of the API call. Google Maps API calls, on the other hand, are synchronous, returning immediately after the call is made.
For example, with the standard Google Maps, you can obtain the latitude and longitude of the center of the map with the following example:
// get the lat/lng of the center of the map var center = map.getCenter();
alert("center: " + center.lat() + ", " + center.lng());
Getting the latitude and longitude of the center of the map in a Mapplet is slightly different. Remember that with the asynchronous communication, the result (the center of the map in this case) may not be returned immediately.
// get the lat/lng of the center of the map (Mapplet) map.getCenterAsync(function(center) {
alert("center: " + center.lat() + ", " + center.lng()); });
Info Window Restrictions
As mentioned earlier, Mapplets are served from the Google domain gmodules.com
and run within an <iframe> element. This is done so that a Mapplet’s JavaScript doesn’t do anything harmful (such as access a Google user’s cookies). It’s not that they don’t trust your Mapplet—it’s the shady guy’s Mapplet they don’t trust!
Everything map related, including the info windows, is served from
http://maps.google.com. So, to protect itself from any harmful JavaScript running on the map, Google does not allow any JavaScript in the info windows. In the same vein, Google permits only a subset of HTML and CSS in your info
windows. For example, the CSS properties expression() and background-image are not allowed. For the complete list of allowed HTML and CSS, please visit
http://www.google.com/apis/maps/documentation/mapplets/infowindowallowed.html
Summary
Congratulations! I hope you’ve come this far unscarred. This chapter covered a lot, and more good things are coming. You now have an introduction to the Mapplets API and can plot markers on the map and respond to some basic map events such as marker clicks. This is a great start!
Chapter 2: Using Remote Data in Your
Mapplets
You now have Mapplet basics down. In the previous chapter, you learned how to plot markers on a map using static content, or content that never changes. It is now time to make your application more interactive by using dynamic data, or data that is retrieved from remote servers.
Mapping data sets that don’t often change (if ever), such as a chain store’s locations or a series of historical buildings, may not require dynamic retrieval. However, when you start to map information that changes often, such as news or event data (like concerts), you’ll need to periodically retrieve the data to refresh your application. In this chapter, you’ll learn how to do just that.
Specifically, you will explore the following:
Typical data formats used in data feeds and web services Google’s JavaScript APIs to fetch remote content
Techniques for making Mapplets more interactive and responsive Tools for plotting dynamic content with Mapplets
Data Feed Formats
Before you get started retrieving remote content, I’ll discuss the data formats. You’ll see plenty of acronyms for data formats: CSV, XML, RSS, Atom, KML, JSON…. These are a few of the popular flavors of the moment, and you might retrieve any of them from a remote server or with a web service. The following sections highlight the ones you’ll be using in this book.
CSV: The Equivalent of Cave Paintings
It’s worth a mention, though it’s not as commonly used on the Web as some of the other formats mentioned next. You can imagine the fields in a data file that you’d need to store some mapping/marker information: the marker description (in this case, the band and venue name), the latitude, and the longitude. Data in a CSV file looks like this:
the redwalls, Knitting Factory, 40.7173, -74.0053, ¬ dirty projectors, Bowery Ballroom, 40.7205, -73.9937
XML: The Worldwide Format
Many publishing and data feed formats are based on Extensible Markup Language (XML), including RSS, Atom, KML, and so on. Most data feeds on the Internet today are some flavor of XML. All modern browsers have built-in support for parsing XML data using JavaScript APIs.
Note You can find more information about XML at the W3C:
http://www.w3.org/XML/.
You’ll be using XML with most of the examples in this book, so let’s look at a simple XML file that stores the sample marker data, as in the previous example. This is some simple XML that you can use to store concert data:
<?xml version="1.0" encoding="UTF-8"?> <markers>
<marker title="the redwalls" venue="Knitting Factory" ¬ lat="40.7173" lng="-74.0053"/>
<marker title="dirty projectors" venue="Bowery Ballroom" ¬ lat="40.7205" lng="-73.9937"/>
</markers>
RSS: A Timely Format
RSS typically stores summaries of blog or news content with links to the content, but RSS is also widely used to syndicate other types of content ranging from event data such as Tourfilter and Upcoming.org to social status updates such as Twitter and Facebook’s Status Updates.
Note You can find more information about RSS and the RSS 2.0 specification at http://cyber.law.harvard.edu/rss/rss.html.
For an example of RSS used to syndicate event data, let’s take a look at Tourfilter’s RSS feed of concert data in New York, shown here. Notice the header information such as title, link, and description. Then the RSS contains a “feed” of “items” that may contain a title, a publication date (<pubDate>), and a link. This RSS feed doesn’t contain any specific location information such as latitude and longitude, which would make it a GeoRSS feed. (For more information about GeoRSS, check out http://www.georss.org.)
<?xml version="1.0" encoding="UTF-8"?> <rss version="2.0">
<channel>
<title>tourfilter new york shows</title> <link>http://www.tourfilter.com/newyork</link>
<description>Get an email when bands you like come to New York: ¬ A community calendar of upcoming local live music.</description> <language>en</language>
<item>
<title>hot rod circuit (Knitting Factory 12/9)</title> <pubDate>Fri, 12 Oct 2007 04:49:09 -0400</pubDate>
<link>http://www.tourfilter.com/newyork/hot_rod_circuit</link> </item>
<item>
<title>Michelle Shocked (Highline Ballroom 12/9)</title> <pubDate>Mon, 01 Oct 2007 04:50:43 -0400</pubDate>
</channel> </rss>
JSON: The Programmer-Friendly Format
So, what is this JavaScript Object Notation (JSON) that we all keep hearing about? JSON is your friend, so it’s time to learn it and love it. JSON is not necessarily a data feed format but is really a data interchange format. It is basically a simple text format that is a chunk of valid JavaScript that lets you represent data as JavaScript objects. JSON is easy to read and write, which makes it easy to program and debug (by you). And, it’s a subset of the JavaScript language, so it’s easy to parse data represented as JSON within your JavaScript code.
You can use JSON to store arrays, as well as key/values pairs (typically referred to as a hash table, dictionary, or associative array), which are universal data structures. So, this is a format that can be used across many programming languages and environments.
JSON is becoming widely adopted, especially with the rise of Ajax applications that consume web services, because it is easy to use within these JavaScript-based applications. More and more companies that offer web services, such as Google and Yahoo, are offering JSON output as an alternative to XML.
Let’s now see what JSON looks like and how you can use it within JavaScript. Using some of the data from the previous CSV and XML examples, here is the same map marker data in JSON:
{
In this example, you are storing the array of Markers, denoted by brackets: [ ]. Each marker has a few attributes (title, venue, latitude, and longitude) that are stored as key/values pairs (for example, "title": 'the redwalls"). Pretty
readable, right?
Tip json.org is great resource for all things JSON. The site provides a good introduction of JSON as well as links to many JSON libraries for a variety of languages. You can also find some examples of JSON formatting and data structures at http://json.org/example.html.
Retrieving Remote Content with Mapplet APIs
Google provides three APIs for retrieving remote content for Mapplets. These APIs are part of the Gadget API suite and can be used in both Mapplets and Gadgets. Using the APIs, you can retrieve remote data as text, XML, or JSON. The three API calls are as follows:
_IG_FetchContent() takes a URL as an argument and returns the text from the given URL. This API should be used when working with text or HTML content.
_IG_FetchXmlContent() takes a URL as an argument and returns the XML content as a DOM object. This should be used when retrieving XML content. _IG_FetchFeedAsJSON() should be used when retrieving RSS or Atom feeds.
Note I won’t be covering the _IG_FetchFeedAsJSON() API in this chapter. It is a useful API when dealing with RSS and Atom feeds, but this API
currently doesn’t allow you to parse geographic fields, such as latitude and longitude, from RSS or Atom feeds.
You can find more information about these APIs and fetching remote content within Mapplets and Gadgets at http://code.google.com/apis/gadgets/docs/ remote-content.html.
Retrieving Text
Let’s return to some code examples! You’ll start by using the first of Google’s “fetch” APIs to retrieve some text from a remote server and display it in the Mapplet. Text in this case can refer to any type of text: HTML, CSV data, or even plain, unformatted text. The API _IG_FetchContent() will retrieve the remote URL you specify and return the data from the URL as plain text. It’s up to your application to use the retrieved text data as needed. If you retrieve HTML, you may want to display the chunk of HTML you’ve retrieved in your application’s user interface. If you retrieve something like CSV-formatted data, you will probably be parsing the data and using some of this data in various parts of your application, such as creating markers on a map.
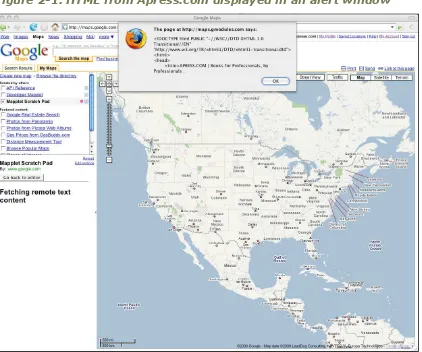
In the first example, you will fetch some HTML content and display the HTML in a JavaScript alert() window. It’s a simple example but will show you how the first of Google’s “fetch” APIs work.
1. In the Mapplet Scratch Pad at http://maps.google.com/maps/mm, click the “Go back to editor” button to display the scratch pad editor.
2. Cut and paste the Mapplet XML from example_2_1_fetch_text.xml, and paste it into the Mapplet Scratch Pad.
Figure 2-1. HTML from Apress.com displayed in an alert window
Examining the Code
Congratulations—your Mapplet has successfully fetched some remote content! In this example, you used the _IG_FetchContent() API to retrieve the HTML from
You first create a variable called url that contains the Apress home page URL:
var url = "http://www.apress.com";. To fetch the Apress home page, you use the following code:
_IG_FetchContent(url, handleFetchContent);
_IG_FetchContent() is an asynchronous function, meaning it will return
immediately after it is called and will call the handleFetchContent function (the callback) after the remote content has been fetched.
Tip It is important to remember that the “fetch” APIs are
asynchronous and may take some time to return the remote content that you are fetching. Make sure your application takes this into consideration. Since the content you are fetching may not be returned immediately, you may want to give some notification to your user that you are retrieving content. I’ll show you a few ways of doing of this in the next few examples.
Once the remote content has been fetched, _IG_FetchContent() will call the function handleFetchContent with a JavaScript string object containing the text you’ve just fetched. In handleFetchContent, you are using the variable
responseText to store the fetched text. If an error occurs in retrieving the remote data, the returned text will be null. Notice that you are checking for this and displaying a simple error if it happens. Finally, you display the first 200 characters of the text using the following code:
// display the text that was returned from apress.com // but only display the first 200 characters
alert(responseText.substr(0,200)); }
In the end, you’ve fetched and displayed the first 200 HTML characters of Apress.com.
Making Mapplets More Interactive
Let’s expand on the previous example by retrieving some map-related data; at the same time, you’ll make the application more interactive. The previous example didn’t give the user any indication you were loading data in the background. You may not have noticed any delay in retrieving and displaying the data, but it’s always important to take this possibility into consideration and give your user some indication that the initial data is loading.
With this next example, I’ll introduce a few new concepts. First, let’s create a link in the application that allows the user to load the remote data with a single click of a link. Second, you will create a status indication in the application to let users know what’s going on behind the scenes: whether the data is loading, whether an error has occurred, or whether the data was loaded successfully. Last, let’s take the remote data you are fetching and actually display it in your
application. You aren’t going to add anything to the map itself quite yet—that’s coming in one of the next examples.
You haven’t focused much on the application portion of the Mapplet yet—the small web page that is displayed in the bottom-left portion of the screen when you are viewing the Mapplet. All you have done so far is use <h2> tags to display the title of the sample applications. Let’s expand on this in the following
example, adding a simple link to load the remote data:
<a href="#" onclick="loadData();">Load Data</a>
You will also add two HTML tags to the application to display status messages as well as content that you retrieve from the server. These will look like this:
Notice the IDs that you’ve assigned to both the status tag and the content tag. You’ll use these IDs to dynamically update the HTML contained within both the status and content tags. I’ll explain this after you take a look at the code.
You are also adding some simple CSS to help style the web page portion of the Mapplet. You’ll see how easy it is to style your application; in the following example, you are modifying only the font.
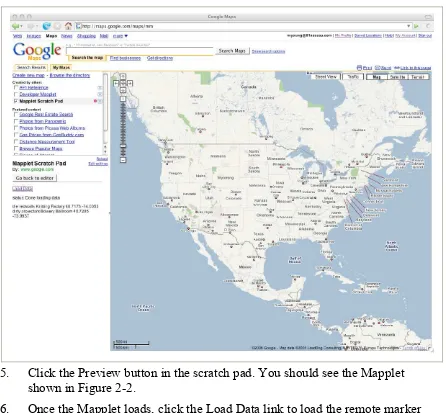
In this next example, you will be retrieving data from your own server. As you move forward in this book, a lot of the sample code will need to run from a web server that can be accessible on the Net—not your local machine. In this next example, you’ll create a simple CSV data file to store some band and venue information, and the Mapplet will fetch this data from the server. If you don’t have access to your own server, you can upload the test files to Google Pages (http://pages.google.com) for the next few examples, but you’ll need to get access to a server with PHP for some of the upcoming examples in the next chapters.
1. Place the file markers.csv on a public web server that is publicly available. If you don’t have access to a public web server, you can upload the markers.csv file to your account at http://pages.google.com. The data in markers.csv looks like this:
the redwalls, Knitting Factory, 40.7173, -74.0053, ¬
dirty projectors, Bowery Ballroom, 40.7205, -73.9937
2. In the Mapplet Scratch Pad, click the “Go back to editor” button to display the scratch pad editor.
3. Edit the Mapplet source in example_2_2_fetch_csv.xml, and make sure the URL in the following line points to your markers.csv file:
var url = "http://yourserver.com/path/to/markers.csv";
Figure 2-2. Remote content displayed in a Mapplet
5. Click the Preview button in the scratch pad. You should see the Mapplet shown in Figure 2-2.
Examining the Code
In this example, you again used the _IG_FetchContent() API to retrieve some content from your own server and then displayed band and venue information in your Mapplet. I’ll now walk you through this example, covering the new
additions.
You added some simple CSS to the application, changing the font to Arial 12 pixels by placing some CSS in the Mapplet code:
<style type="text/css"> <!--
body,div,span,p {
font-family: arial, sans-serif; font-size: 12px;
} --> </style>
To help make the application more interactive, you added a simple link that loads the data when clicked. Using the onclick attribute of the anchor tag, the
loadData() function is called whenever a user clicks the Load Data link:
<p><a href="#" onclick="loadData();">Load Data</a><p>
Next, you added two new sections to help you display the application’s status as well as the content that you’ve fetched:
<p>status: <span id="status">Nothing loaded yet. Click Load Data above.</span></p>
<p id="content"></p>
To update the status and content, you’re using the function _gel() to get access to the DOM element that you need to update (status and content in this case).
_gel() is Google’s wrapper for the JavaScript function getElementById(), which gives you the DOM element for the specified ID. So, to update the HTML between the <span id="status"> and </span> tags, you use the following:
Notice that you update the status with “loading” when you first call loadData()
and then update it again if either an error occurs when fetching the data or you successfully fetch the remote data.
After you successfully fetch the band and venue data, you parse the data (which is one long string of comma-delimited fields) into an array using the JavaScript
split() function. Once you have the data in the array markerData, you loop over the array, adding each field to the displayHTML variable. Notice that you need to add a line break (<br/>) after every fourth field is pulled from the array; you do this since the marker data holds four fields for every marker: band name, venue name, latitude, and longitude.
// use the split to parse the incoming marker data var markerData = responseText.split(",");
// loop over the individual marker data fields for (var i = 0; i < markerData.length; i++) { //...
}
You finally update the application’s content section with the following command:
_gel("content").innerHTML = displayHTML;
Retrieving XML
Chances are good that most of the third-party data that you’ll be dealing with when creating mashups will be some flavor of XML. Fortunately, using Google’s
_IG_FetchXmlContent() API as well as built-in JavaScript functions to parse the XML, it’s fairly easy to use XML content in Mapplets. Over the next few examples, you’ll see how to create a Mapplet that fetches remote XML data.
1. Place the file markers.xml on a public web server. Again, if you don’t have access to a public web server, you can upload the file to your account at
http://pages.google.com. The data in markers.xml looks like the following:
<?xml version="1.0" encoding="UTF-8"?> <markers>
<marker title="the redwalls" venue="Knitting Factory" ¬ lat="40.7173" lng="-74.0053" />
<marker title="dirty projectors" venue="Bowery Ballroom" ¬ lat="40.7205" lng="-73.9937" />
</markers>
2. In the Mapplet Scratch Pad, click the “Go back to editor” button to display the scratch pad editor.
3. Edit the Mapplet source in example_2_3_fetch_xml.xml, and make sure the URL in the following line points to your markers.xml file:
var url = "http://yourserver.com/path/to/markers.xml";
4. After editing example_2_3_fetch_xml.xml, copy and paste the contents of the file into the Mapplet Scratch Pad.
5. Click the Preview button in the scratch pad. You should see the Mapplet shown in Figure 2-3.
Examining the Code
So, there you have it—you just retrieved and parsed some XML from a remote server! Let’s take a quick look at what’s new in this one.
First, you should have changed the url to point to your own markers.xml file:
var url = "http://yourserver.com/path/to/markers.xml";
Next, inside the loadData() function, you called the Google API to fetch XML content: _IG_FetchXmlContent(). Like the API to fetch text, this takes a URL to an XML document as an argument and returns the XML as a DOM object. You can then use standard JavaScript functions to extract the data from the DOM object.
_IG_FetchXmlContent(url, handleFetchContent);
Once the XML content is fetched, the Google API will call the function
handleFetchContent(), passing the fetched data into the function. At the top of
handleFetchContent(), you do some error checking to make sure the data is valid XML. The first check is to make sure response is not null. Second, you check whether the response is a valid JavaScript object. Last, you use the DOM attribute firstChild to ensure response is a valid DOM object. If any of those checks fail, something went wrong in fetching the data or the data isn’t valid XML.
if (response == null || typeof(response) != "object" || ¬ response.firstChild == null) {
_gel("status").innerHTML = "Failed to load valid XML data"; return;
}
If you have valid XML to work with, the previous validation checks will all pass with flying colors. Next, you use the getElementsByTagName() DOM function to get each of the markers from the XML. getElementsByTagName() will search the DOM object and return an array of DOM elements matching the name you are looking for (marker in this case). You use the following line to get each of the marker elements:
The variable markers now contains an array of DOM elements. Next, it’s a matter of looping over the markers array, extracting all the information for each
marker—band/title, venue name, latitude, and longitude. Since all this information was stored as attributes in the marker XML elements (<marker title="the redwalls" venue="Knitting Factory" lat="40.7173" lng="-74.0053" />), you can use the DOM function getAttribute() to extract each of the fields from the marker element. After you extract each of the fields, you add the title and venue to the displayHTML variable, which is then rendered to the screen of the application.
for (var i = 0; i < markers.length; i++) { var marker = markers[i];
var title = marker.getAttribute("title"); var venue = marker.getAttribute("venue"); var lat = marker.getAttribute("lat"); var lng = marker.getAttribute("lng");
displayHTML += "<div>" + title + " - " + venue + "</div>"; }
Notice that you didn’t do anything with the latitude and longitude? That’s
coming in the next example, when you combine everything you’ve learned from this chapter with some of the Mapplet APIs from the previous chapter. Are you ready? Good, let’s move on.
Mapping Remote XML Data
At this point, you have a lot of tools that you can pull together into a single application. You now know how to retrieve XML content from a remote server, as well as plot data on a map using the Mapplet APIs. Let’s use all your new skills to plot some remote data on a map! It’s about time, right? You’ll even add a little interactivity so that your map responds to clicks from your user.
markers on the map and center the map so that you can view all the markers on the map at the same time.
Before you get started with the code, let’s first take a look at the Mapplet you are going to create. Notice in Figure 2-4 that you have a list of the bands and venues on the left side and markers placed on the maps for the venue locations? You’re adding some new interactivity to this application. When you click one of the band/venue links on the left, the info window for that corresponding marker will open on the map. It’s always a good idea to let your user navigate the content through either the list or the map.
Follow these steps to view the latest Mapplet:
1. You’ll be using the same markers.xml file you set up in the previous example.
2. In the Mapplet Scratch Pad, click the “Go back to editor” button to display the scratch pad editor.
3. Edit the Mapplet source in example_2_4_plot_remote_data.xml, and make sure the URL in the following line points to your markers.xml file:
var url = "http://yourserver.com/path/to/markers.xml";
4. After editing example_2_4_plot_remote_data.xml, copy and paste the contents of the file into the Mapplet Scratch Pad.
5. Click the Preview button in the scratch pad. You should see the Mapplet shown in Figure 2-4.
6. Once the Mapplet loads, click the Load Data link to load the remote marker data. Once the band and venue data is loaded, you should see markers on the map as well as a list of band and venue links on the left side of your
application. Click the band/venue links on the left, and notice how the appropriate info window appears.
Examining the Code
You have seen most of the code in this example, but a few new things are happening. Let’s take a look at these now.
After you successfully load the data, you first check to make sure you have at least one marker in your XML file. If not, you show an error message:
if (concertData.length == 0) {
_gel("status").innerHTML = "Sorry, we don't have any concert data at this time";
return; }