Postharvest Biology and Technology 21 (2000) 213 – 223
Effect of modified atmosphere packaging (MAP) and
controlled atmosphere (CA) storage on the quality of snow
pea pods (
Pisum sati
6
um
L. var.
saccharatum
)
Juan A.T. Pariasca
a, Takeshi Miyazaki
c, Hiroyuki Hisaka
c,
Hiroki Nakagawa
b, Takahide Sato
a,b,*
aGraduate School of Science and Technology,Chiba Uni6ersity,1Yayoi-cho,Inage,Chiba263-8522, Japan bFaculty of Horticulture,Chiba Uni6ersity,648Matsudo,Chiba271-8510,Japan
cChiba Prefectural Experimental Agriculture Station,808Daizenno,Chiba266-0066,Japan Received 17 January 2000; accepted 25 July 2000
Abstract
The effects of precooling, modified atmosphere packaging (MAP) and controlled atmosphere (CA) storage on the storability of snow pea pods (Pisum sati6um L. var. saccharatum) at 5°C were determined. Bagging pods with
polymethyl pentene polymeric films (PMP) of 25 and 35mm thickness, in conjunction with precooling, modified the
in-bag atmosphere concentration to approximately 5 kPa O2and 5 kPa CO2, leading to better maintenance of the pod
external quality (appearance and color), as well as internal quality (chlorophyll, ascorbic acid, and sugar contents). Sensory scores were also maintained. Under CA storage at 5°C, gas compositions ranging from 5 to 10 kPa O2with
5 kPa CO2were the best storage conditions of those tested, since changes in organic acid, free amino acid and sugar
contents, and pod sensory attributes were slight, corroborating the MAP results. The appearance of pods stored under CA conditions was much better than that of air-stored pods (control). Low O2(2.5 kPa with 5 kPa CO2) and
high CO2 (10 kPa with 5 kPa O2) concentrations have a detrimental effect on quality of stored pods since they
developed slight off-flavors, but this effect is reversible since it was partially alleviated after ventilation. © 2001 Elsevier Science B.V. All rights reserved.
Keywords:Snow pea pods; MAP; CA; Precooling; Storage; Quality
www.elsevier.com/locate/postharvbio
1. Introduction
Western consumers have begun to prefer the edible podded pea (snow pea pods), a special type of pea in which the pods rather than the seeds are eaten (Splittstoesser, 1978). The demand for snow pea pods has been increasing steadily in some markets such as the US and Japan.
* Corresponding author. Tel.:+81-47-3088863; fax:+ 81-47-3088863.
E-mail address:[email protected] (T. Sato).
J.A.T.Pariasca et al./Posthar6est Biology and Technology21 (2001) 213 – 223 214
Most studies conducted on peas have dealt with the green shell seed crop, which is grown almost exclusively for processing. Very little in-formation is available on the optimum storage conditions of snow pea pods. Kader (1992) stated that the pea is a highly perishable immature commodity that can be cooled and stored at temperatures near 0°C to extend its shelf life, has an extremely high respiration rate and is classified as a non-climacteric com-modity. To retain the best quality, edible-pod-ded peas are harvested before physiological maturity is reached (Basterrechea and Hicks, 1991). Shortly after harvest, loss of sweetness and crispness, as well as degreening and the de-velopment of mealiness, may degrade the qual-ity.
Low temperature storage when combined with controlled atmospheres (CA) or modified atmo-sphere packaging (MAP), results in reduced res-piration and ethylene production rates, retarded softening, and a slowing down of compositional changes associated with ripening and senescence (Wills et al., 1981; Zagory and Kader, 1989; O’Beirne, 1991).
Previous experiments combining low tempera-ture storage and CA have revealed that an at-mosphere of 5 kPa CO2 at 5°C maintained the color and flavor of unshelled peas (Tomkins, 1957). Also, increasing the CO2 concentration to 2.6 or 4.7 kPa, combined with 21 or 2.4 kPa O2, at 1°C maintained the appearance, as well as chlorophyll, soluble sugar and protein con-tents of stored snow peas (Ontai et al., 1992). Another related study reported by KPAES (1983) showed that storing snow pea pods at either 0 or 5°C did not cause any substantial difference in their appearance or taste during the first week of storage.
This study has been conducted to evaluate the effects of MAP and CA on the maintenance of quality of snow pea pods stored at 5°C. The effects of gas concentrations achieved by using different plastic film materials (MAP) in con-junction with precooling on pod quality were evaluated first, and the effect of different CA
compositions on pod quality was then deter-mined in order to improve their storability.
2. Materials and methods
2.1. Plant material
Samples of snow pea pods (Pisum sati6um L. var. saccharatum cv. Ichihara wase) were ob-tained from the Sodegaura packing house, in Chiba Prefecture, Japan.
2.2. Experiment I: Effects of precooling and MAP on the quality of snow pea pods stored at
5°C
Samples free of visual defects were divided into two portions. One portion was precooled using a vacuum cooling system, wherein the in-ternal pod temperature was reduced to approxi-mately 4°C. The remaining portion was not precooled.
Subsequently, all samples (precooled and non-precooled) were rapidly weighed to 10092 g and placed in bags composed of different poly-meric films: 25 mm polymethyl pentene (PMP-1) and 35 mm (PMP-2), 25 mm low-density polyethylene (LDPE), and 25mm oriented polypropylene (OPP); non-sealed LDPE (LD-PEns) with folding was used as control. The sealed package size was 13.5 cm×19.5 cm (263.3 cm2). Afterwards, all bags except LD-PEns were heat-sealed, and stored at 5°C.
Oxygen permeances were 79.4×10⁻¹² mol·s−1·m−2·Pa−1 for PMP-1, 56.0×10⁻¹² for PMP-2, 31.3×10⁻¹² for LDPE and 6.5×10⁻¹² for OPP. The permeance data were provided by the manufacturer and converted into S.I. units according to Banks et al. (1995).
2.3. Experiment II: Effects of CA compositions on the quality of snow pea pods stored for 3
weeks at 5°C
J.A.T.Pariasca et al./Posthar6est Biology and Technology21 (2001) 213 – 223 215
outlet ports, at 5°C. Three replicates of each sample were used.
The CA compositions studied were (a) 2.5, 5 and 10 kPa O2with 5 kPa CO2, and control (air-stored pods); and (b) 0, 5 and 10 kPa CO2with 5 kPa O2, and control. These gas compositions were adjusted using a flowmeter for the combination of air, CO2 and nitrogen (balance) with a total flow rate of 200 ml min−1. The gas compositions were monitored using a gas chromatograph (GC) at both inlet and outlet ports.
Samples were taken after 7, 14 and 21 days of storage (CA pods). Some were transferred to air after CA storage (ventilated pods) and held for 2 days at 20°C. All samples were stored at −80°C until the analyses were carried out.
2.4. Assessment and measurement
2.4.1. Atmosphere composition in the head space of bags
A 1 ml gas sample was drawn into a syringe, through a piece of rubber stuck to the bags, and injected into a GC (Shimadzu, Japan) equipped with a thermal conductivity detector (TCD), and molecular sieve 5A (60 – 80 mesh), resistor (shi-malite) Q (100 – 180 mesh) and activated charcoal (60 – 80 mesh) columns (Shimadzu). Helium was used as the carrier gas at a flow rate of 25 ml min−1. The injector and column temperatures were 100 and 80°C, respectively. Standard calibra-tion curves for O2, CO2and N2were obtained and used for calculations. The O2 content was cor-rected for argon.
2.4.2. External quality
Color was measured using a hand-held col-orimeter (model CR-200, Minolta, Japan). Numer-ical values of L*, a* and b* were recorded and converted to hue angle (H0
=tan−1
b*/a*) and chroma (chroma=(a*2
+b*2 )1/2
) (Francis, 1980). Appearance, a subjective index, was modified from KPAES (1983): (1) free from defects and firm; (2) minor defects appearing and slightly wilted pods; (3) obvious minor defects and wilted pods; (4) saleable (brown calyx, discolored pods, obvious defects on pods and completely wilted pods).
2.4.3. Internal quality
2.4.3.1.Total chlorophyll. Chlorophyll content was analyzed as described by Hisaka (1992), with mod-ifications. Five grams of a sample were homoge-nized with 20 ml of 90% acetone and 0.1 g of MgCO3 in a mortar. The homogenate was trans-ferred into a 50 ml volumetric flask which was then filled with 80% acetone and centrifuged, and the supernatant was filtered through paper No. 2 (Toyo Ltd., Japan). The filtrate was measured using a spectrophotometer (model UV2100, Shi-madzu, Japan) at A 663 and A 645 nm. There were three replicates.
2.4.3.2. Ascorbic acid. Ten grams of pod tissue were ground thoroughly in a mortar with 40 ml of 0.9 M H3PO4. The mixture was poured into a 100 ml volumetric flask which was then filled with distilled water and filtered through paper No. 2 (Toyo Ltd., Japan). The ascorbic acid content of the sample was measured by injecting 5 ml of the filtrate into a food analyzer (model NH-FO41, Ajinoki, Japan) that was previously corrected with a standard of 50 mg ascorbic acid/100 ml distilled water. Two readings were obtained from each sample, and the average was used for calculations (Miyazaki, 1985).
J.A.T.Pariasca et al./Posthar6est Biology and Technology21 (2001) 213 – 223 216
2.4.3.4. Total sugars and free amino acids. Sugar content was analyzed as described by Iwatsubo et al. (1992) with some modifications. Five grams of tissue were homogenized with 100 ml of 80% ethanol and immersed in water at 80°C for 30 min, then cooled and supplemented with 80% ethanol in a 200 ml volumetric flask. Subse-quently, the homogenate was filtered through pa-per No. 2 (Toyo Ltd., Japan), and the ethanol in an aliquot of 50 ml of the filtrate was evaporated off in a rotary vacuum evaporator. The concen-trated sample was transferred to a 25 ml volumet-ric flask which was then filled with distilled water, and filtered through a 0.45 mm membrane filter. This filtrate was used to measure the sugar and free amino acid contents.
To determine the amount of total sugar, 20 ml of the filtrate was injected into an HPLC (model LC-3A, Shimadzu, Japan) equipped with a refrac-tive-index (RI) detector and a SCR101N column (Shimadzu, Japan), under the following condi-tions: column temperature of 50°C, mobile phase of distilled water, and flow rate of 1 ml min−1. Standard calibration curves for glucose, fructose and sucrose were obtained and used to estimate the sample contents. The sum of the above three sugars was considered as the amount of total sugar.
For the determination of free amino acids, the above filtrate was diluted with 0.05 M boric acid – NaOH buffer, pH 8.0, at a ratio of 1:20. An aliquot of 30ml of the dilution was mixed with 10 ml of 50 mM 4-fluoro-7-nitrobenzofurazan/ aceto-nitrile (for fluorescence detection), incubated at 60°C for 90 s, and injected into an automated Gilson HPLC system (Gilson Med. Elect., USA) equipped with a fluorometer detector (model M-121, Gilson) and an ODS-A column (YMC Co., Japan). The column temperature was 30°C and the mobile phase was composed of buffer A (0.2 M H3PO4:acetonitrile, 10:2) and buffer B (0.1 M K2HPO4·3H2O, 0.1 M H2KPO4:methanol: aceto-nitrile, 4:3.9:2.1), with a flow rate of 1.2 ml min−1, under gradient conditions in which the A:B ratio was 100:0 for the first 20 min, 80:20 from 21 to 30 min, and 0:100 from 31 to 40 min. The concentrations of amino acids were quantified using a 2.5 nM ml−1 amino acid
stan-dard kit (type H, Wako, Japan). Asparagine and glutamine standards were also used.
2.4.4. Sensory analysis
At each sampling time, some pods were boiled for 2 min, and evaluated by a panel of five untrained persons, based on the following grades modified from Miyazaki (1985). Off-flavor: (1) none (no off-flavor can be detected); (2) slight; (3) strong; (4) severe (extremely strong off-flavor can be detected). Palatability: (1) good (liked or pre-ferred taste); (2) fair; (3) poor; (4) inedible (severely disliked taste).
2.4.5. Statistical analysis
Data were organized in a completely random-ized block design (CRBD) with a split-plot ar-rangement, with three repetitions, in which each repetition was considered as a block. The analysis of variance (ANOVA) of the main effects, and mean separations were obtained using Systat statistical software (version 8.0, SPSS Inc., USA). Data transformations were carried out according to the requirements (Little and Hill, 1978).
3. Results
3.1. Experiment I: Effects of precooling and MAP on the quality of snow pea pods stored at
5°C
All treatments resulted in the same pattern of O2 and CO2 concentrations within the bags. Within 2 weeks of storage, all treatments resulted in lower O2 contents (Fig. 1). Oxygen in PMP bags decreased to around 8 kPa, but in OPP bags rapidly decreased to nearly 1 kPa. After 2 weeks, the O2content was near a steady-state level for all treatments. Oxygen in PMP bags reached around 5 – 6 kPa, while in LDPE bags 2 kPa and in OPP bags 3 kPa (Fig. 1A). Non-precooled treatments resulted in higher O2 contents (Fig. 1B).
J.A.T.Pariasca et al./Posthar6est Biology and Technology21 (2001) 213 – 223 217
at around 29 kPa after 1 week, which then de-creased steadily thereafter.
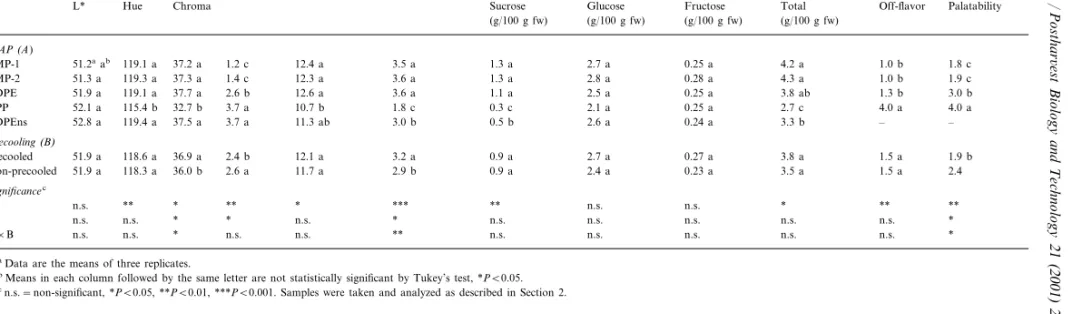
The gas concentration within the package sig-nificantly affected the external quality of stored pods (Table 1). Pod lightness (L*) did not vary, but OPP-bagged pods had increased yellowing (hue angle reduced), and non-precooled OPP pods were less intensely green (chroma reduced). Ap-pearance was better maintained in precooled pods, wherein PMP pods were the best, and OPP-and LDPEns-bagged pods the worst, having reached a completely saleable condition.
MAP had a dramatic effect on the chlorophyll contents of stored pods (Table 1). The reduction for LDPEns- and OPP-bagged pods was higher than for PMP- and LDPE-bagged pods. With regard to the ascorbic acid content, precooled pods had higher contents than the non-precooled ones, whereas PMP- and LDPE-bagged pods maintained higher contents than LDPEns- and OPP-bagged pods.
MAP had significant effects on the pod sugar content. PMP-bagged pods had the highest con-tent among the treatments (Table 1). OPP-bagged pods, on the other hand, exhibited a significant reduction. PMP- and LDPE-bagged pods had a twofold-increase in sucrose contents, while those of OPP-bagged pods decreased. LDPEns-bagged
pods did not show any significant variation among the sugar components.
Precooled PMP-bagged pods showed better ac-ceptability than the others (Table 1). OPP- and LDPE-bagged pods developed strong off-flavors and non-sealed pods reached an extremely wilted condition, and both were graded inedible.
3.2. Experiment II: Effects of CA compositions on the quality of snow pea pods stored for 3
weeks at 5°C
3.2.1. Effects of 2.5, 5 and 10 kPa O2 combined
with 5 kPa CO2 on stored pod quality
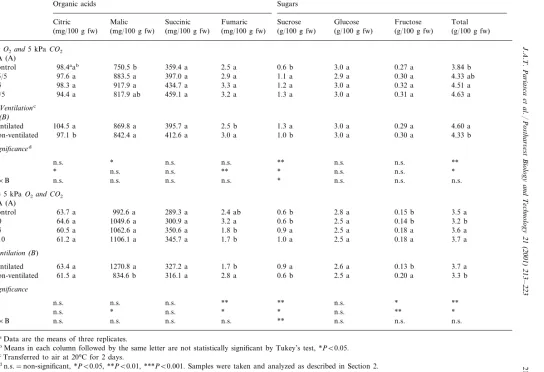
Treatments with low O2 combined with 5 kPa CO2 resulted in increased malic acid contents (Table 2). When CA-stored pods were ventilated for 2 days at 20°C, the malic acid content did not vary, although the fumaric acid content of pods increased and citric acid decreased after ventilation.
The tested CA compositions were found to increase the total sugar content as well as the sucrose component, although, sucrose content was reduced through ventilation. Glucose and fructose contents, on the other hand, were unaf-fected either by low O2 treatments or by ventila-tion (Table 2).
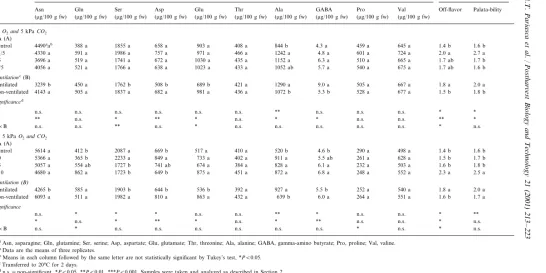
The tested CA compositions also increased the alanine content of pods (Table 3). When pods were ventilated, however, alanine and gamma-amino butyrate (GABA) contents were reduced while asparagine, serine, aspartate and glutamate contents were increased.
Sensory scores were also affected by low O2 concentration. Better acceptability was observed for control, 5 and 10 kPa O2treatments than for the 2.5 kPa O2 treatment which resulted in the development of off-flavor. However, pod accept-ability improved after ventilation (Table 3).
3.2.2. Effects of 5 kPa O2 combined with0,5
and 10kPa CO2 on stored pod quality
Elevated CO2 concentrations decreased the fu-maric acid contents of pods (Table 2). Ventilation of CA pods increased the fumaric acid but de-creased the malic acid contents.
J
.
A
.
T
.
Pariasca
et
al
.
/
Posthar
6
est
Biology
and
Technology
21
(2001)
213
–
223
218
Table 1
Effect of precooling and MAP on the variation of color, appearance scores, chlorophyll, ascorbic acid and sugar contents, and sensory scores of snow pea pods stored at 5°C for twenty-eight-day period
Ascorbic acid Sugars Sensory scores Color Appearance Chlorophyll
(mg/100 g fw) (mg/100 g fw)
Sucrose Glucose Fructose Total Off-flavor
Hue Palatability
L* Chroma
(g/100 g fw) (g/100 g fw)
(g/100 g fw) (g/100 g fw)
MAP(A)
3.5 a 1.3 a 2.7 a 0.25 a 4.2 a 1.0 b
12.4 a 1.8 c
1.2 c PMP-1 51.2aab 119.1 a 37.2 a
3.6 a 1.3 a 2.8 a 0.28 a 4.3 a 1.0 b
PMP-2 51.3 a 119.3 a 37.3 a 1.4 c 12.3 a 1.9 c
3.6 a 1.1 a 2.5 a 0.25 a 3.8 ab 1.3 b
12.6 a 3.0 b
LDPE 51.9 a 119.1 a 37.7 a 2.6 b
1.8 c 0.3 c 2.1 a 0.25 a
OPP 52.1 a 115.4 b 32.7 b 3.7 a 10.7 b 2.7 c 4.0 a 4.0 a
3.0 b 0.5 b 2.6 a 0.24 a 3.3 b – – 11.3 ab
LDPEns 52.8 a 119.4 a 37.5 a 3.7 a
Precooling(B)
3.2 a 0.9 a 2.7 a 0.27 a 3.8 a 1.5 a
Precooled 51.9 a 118.6 a 36.9 a 2.4 b 12.1 a 1.9 b
2.9 b 0.9 a 2.4 a 0.23 a 3.5 a 1.5 a 2.4 11.7 a
Non-precooled 51.9 a 118.3 a 36.0 b 2.6 a
Significancec
n.s. ** * * *** ** n.s. n.s. * ** **
A **
* n.s. n.s. n.s. n.s. n.s.
n.s. *
* B n.s. n.s. *
**
A×B n.s. n.s. * n.s. n.s. n.s. n.s. n.s. n.s. n.s. *
aData are the means of three replicates.
J
Effect of different CA compositions on the variation of organic acid and sugar contents of snow pea pods stored for a twenty-one-day period at 5°C
Organic acids Sugars
Succinic
Citric Malic Fumaric Sucrose Glucose Fructose Total
(g/100 g fw)
Non-ventilated 842.4 a 412.6 a
Significanced
Control 63.7 a 992.6 a 289.3 a
0.6 b
Ventilated 1270.8 a 327.2 a
2.5 a 0.20 a 3.3 b
0.6 b 61.5 a
Non-ventilated 834.6 b 316.1 a 2.8 a
Significance
aData are the means of three replicates.
bMeans in each column followed by the same letter are not statistically significant by Tukey’s test, *PB0.05. cTransferred to air at 20°C for 2 days.
J
Effect of different CA compositions on the variation of free amino acid contents and sensory scores of snow pea pods stored for a twenty-one-day period at 5°C
Amino acids Sensory scores
Ser
Gln Asp
Asn Glu Thr Ala GABA Pro Val Off-flavor Palata-bility
(mg/100 g fw)
Ventilated 3239 b 1762 b
436 a 1072 b 5.3 b 528 a 677 a
Ventilation(B)
Ventilated 4265 b 585 a 1903 b 644 b 536 b 392 a 927 a 5.5 b 252 a 540 a 1.8 a 2.0 a 432 a 639 b 6.0 a 264 a 551 a 1.6 b
863 a 1.7 a
Non-ventilated 6093 a 511 a 1982 a 810 a
Significance
8Asn, asparagine; Gln, glutamine; Ser, serine; Asp, aspartate; Glu, glutamate; Thr, threonine; Ala, alanine; GABA, gamma-amino butyrate; Pro, proline; Val, valine.
aData are the means of three replicates.
bMeans in each column followed by the same letter are not statistically significant by Tukey’s test, *PB0.05. cTransferred to 20°C for 2 days.
J.A.T.Pariasca et al./Posthar6est Biology and Technology21 (2001) 213 – 223 221
Total sugar content was also affected by the CO2 concentration (Table 2). Sucrose and fruc-tose contents were significantly higher with 5 and 10 kPa CO2 treatments than with other treat-ments. There were no significant variations in glucose content. Ventilation resulted in lower su-crose and fructose contents compared with unven-tilated treatment. Glucose content, however, remained at the same level after ventilation.
The CO2 combined with 5 kPa O2 treatments significantly reduced the contents of some free amino acids, such as serine and aspartate, but increased glutamine, alanine and GABA contents (Table 3). Glutamine content did not vary after ventilation, while serine, aspartate, asparagine, glutamate and GABA content increased and ala-nine content decreased.
Also, high CO2 concentrations had a detrimen-tal effect on pod sensory attributes. A develop-ment of slight off-flavor which led to decrease in the acceptability was observed with the 10 kPa CO2 treatment. However, such an effect dimin-ished slightly after ventilation (Table 3).
4. Discussion
A gas concentration of around 5 kPa O2 and 5 kPa CO2at a storage temperature of 5°C resulted from bagging snow pea pods with a PMP poly-meric plastic film (having the highest gas perme-ance) (Fig. 1). PMP resulted in the 4.6 kPa CO2 concentration recommended by Ontai et al. (1992) for storing snow pea pods either at 10 or 1°C, but not the O2 content which was higher than the recommended 2.4 kPa O2.
This level of gas concentration within a PMP package had a significant effect on the external quality of stored snow pea pods, either by inhibit-ing shrivelinhibit-ing or by better maintenance of pod color and appearance (Table 1). Likewise, the maintenance of pod internal quality components was also achieved. The degradation of chlorophyll and sugar content was reduced, corroborating the results of Ontai et al. (1992). Weichman (1986) and Zagory and Kader (1989) have noted that high CO2 and/or low O2 concentrations reduce the breakdown of chlorophyll to pheophytin.
The degradation of ascorbic acid was also avoided by MAP, precooling and low-tempera-ture storage. According to Zagory and Kader (1989), degradation of ascorbic acid is associated with wilting in some green leafy vegetables after harvesting. However, the optimum low O2content can prevent ascorbic acid losses, presumably through prevention of oxidation.
On the other hand, greater accumulation of CO2 and reduction in O2 (29 and 1 kPa, respec-tively) resulted from bagging pods with OPP film, which has the lowest permeance (Fig. 1). This gas concentration within the OPP bag led to anaero-bic respiration, causing a severe deterioration of the overall appearance of stored pods, and a greater degradation of chlorophyll, ascorbic acid and sugar contents.
In the case of LDPEns-bagged pods, the overall pod appearance severely deteriorated due to ex-cessive weight loss of more than 6% (Hardenburg et al., 1986) causing a reduction in the ascorbic acid content (Zagory and Kader, 1989). The in-crease in PMP- and LDPE-bagged pod sugar contents during storage may be explained by the accumulation of sucrose.
In terms of the sensory attributes of pods, PMP-bagged pods showed better acceptability due to a better taste and an absence of off-flavor. Our results also showed that the precooling effect on the maintenance of pod quality was not signifi-cant, as expected, because the delay in cooling the non-precooled pods was short.
Weight losses were minimal for all the CA treatments, due to the humidified flow-through system used. The overall appearance, however, was better maintained for pods under all CA compositions than for control pods.
J.A.T.Pariasca et al./Posthar6est Biology and Technology21 (2001) 213 – 223 222
However, since the mechanism remains unclear, the results are varied and sometimes contradictory (Weichman, 1986; Zagory and Kader, 1989; Ke et al., 1993).
Total sugar content was affected by the CA composition as well as the sucrose component, corroborating our results obtained under MAP conditions (Table 1 and Table 2). Low O2 treat-ment could induce an accumulation of sucrose in pods, although no differences that might suggest an effect due to either low O2 or 5 kPa CO2were found among the different treatments. On the other hand, when high CO2 treatments were eval-uated, pods stored under 5 and 10 kPa CO2 had significantly higher sucrose contents than those in 0 kPa CO2 and in control conditions. Further-more, when pods were ventilated, the sucrose content diminished, indicating that increasing the CO2 concentration led to an accumulation of sucrose. Ontai et al. (1992) revealed that snow pea pods stored under the previously mentioned con-ditions exhibited an increase in their total sugar content, but no information was provided regard-ing the component variations. Furthermore, Miller and Brooks (1932) showed that treating peas with high CO2 increased sugar levels. The increase in sucrose in our results was clearly an effect of high CO2, since increased amounts of sucrose were observed under MAP and CA condi-tions, but not in air-stored pods, at storage tem-peratures of both 5 and 20°C (data not shown). This is corroborated by the results of Weichman (1986), in which sucrose accumulation was ob-served as a result of a CO2 concentration much higher than the optimal one, for horseradish, brussels sprouts and carrots.
The major free amino acids found in snow pea pods were asparagine, serine, alanine and aspar-tate, which accounted for 60% of the total con-tent. Another 25% was accounted for by glutamine, glutamate, threonine, proline and va-line. Free amino acid contents were affected by both low O2 with 5 kPa CO2 and high CO2 with 5 kPa O2 concentrations. Furthermore, results after ventilation showed that the tested CA com-positions suppressed or enhanced pod amino acid contents (Table 3). Similar results with high CO2 concentrations have been found by Wankier et al.
(1970), where alanine content increased in apricot and peaches. Glutamate content decreased and GABA content increased in tomato (Saijo et al., 1989) and lettuce (Ke et al., 1993) under similar conditions. This indicates that amino acids in pods can likewise be differentially affected by CA composition as occurs with organic acids. Accord-ing to Wills et al. (1981), a decrease in free amino acids reflects an increase in protein synthesis, while an increase reflects a breakdown of enzymes and decrease in metabolic activity.
CA compositions as low as 2.5 kPa O2 and as high as 10 kPa CO2 reduced pod acceptability. However, this detrimental effect was alleviated after ventilation, indicating a reversible process (Table 3). The taste of pods could be affected not only by the changes in types and amounts of carbohydrates, organic acids, amino acids, lipids and phenolics (Pesis, 1995), but also by the varia-tions in their proporvaria-tions.
The favorable effect achieved by the PMP gas concentration, which was further corroborated by the CA results, indicated that the 2.4 kPa O2 recommended by Ontai et al. (1992), did not result in a better maintenance of pod quality at 5°C.
Based on our results, it can be suggested that the deterioration of appearance, shriveling, and reduction in the ascorbic acid and sugar contents, are the primary factors limiting the storage of snow pea pods. Polymethyl pentene films (PMP) attained a suitable gas composition, which length-ened the storage life to about 4 weeks at 5°C. Furthermore, our study has also revealed that an atmosphere composition ranging from 5 to 10 kPa O2 and approximately 5 kPa CO2 is optimal for maintaining pod quality. Storing pods under CA compositions other than in the above-men-tioned range, may lead to the development of off-flavors and a reduction in pod acceptability. However, such effects are partially reversible by ventilation.
Acknowledgements
J.A.T.Pariasca et al./Posthar6est Biology and Technology21 (2001) 213 – 223 223
References
Banks, N.H., Cleland, D.J., Cameron, A.C., Beaudry, R.M., Kader, A.A., 1995. Proposal for a rationalized system of units for postharvest research in gas exchange. HortScience 30, 1129 – 1131.
Basterrechea, M., Hicks, J.R., 1991. Effect of maturity on carbohydrate changes in sugar snap pea pods during stor-age. Sci. Hortic. 48, 1 – 8.
Francis, F.J., 1980. Colour quality evaluation of horticultural crops. HortScience 15, 58 – 59.
Hardenburg, R.E., Watada, A.E., Wang, C.Y., 1986. The commercial storage of fruits, vegetables, and florist and nursery stocks. USDA, Handbook 66, USA.
Hisaka, H., 1992. Studies of the relationship between storage temperature and the quality of leafy vegetables. Special Bulletin of the Chiba Prefecture Agricultural Experiment Station No.20, Japan (in Japanese with English abstract). Iwatsubo, T., Nakagawa, H., Ogura, N., Hirabayashi, T., Sato, T., 1992. Acid invertase of melon fruits. Immuno-chemical detection of acid invertases. Plant Cell Physiol. 33, 1127 – 1133.
Kader, A.A., 1992. Postharvest Biology and Technology: An overview, and modified atmosphere during transport and storage. In: Kader, A.A. (Ed.), Postharvest Technology of Horticultural Crops. University of California Pub. 3311, USA, pp. 15 – 17, 85 – 92.
Ke, D., Mateos, M., Siriphanich, J., Li, Ch., Kader, A., 1993. Carbon dioxide action on metabolism of organic and amino acids in crisphead lettuce. Postharvest Biol. Tech-nol. 3, 235 – 247.
KPAES, 1983. Ryutsu to riyou ni kansuru shikken seisekisho. Kagoshima Prefecture Agricultural Experiment Station, Japan (in Japanese).
Little, T.M., Hill, F.J., 1978. Agricultural experimentation. Design and analysis. Wiley and Sons, Inc., USA. Miller, E.V., Brooks, C., 1932. Effect of carbon dioxide
con-tent of storage atmosphere on carbohydrate transforma-tion in certain fruits and vegetables. J. Agr. Res. 45, 449 – 459.
Miyazaki, T., 1985. Keeping qualities of broccoli by seal-pack-aging with plastic bags and ethylene removing agent. Japan Packaging Research 6, 1 – 6 (in Japanese with English abstract).
O’Beirne, D., 1991. Modified atmosphere packaging of fruits and vegetables. In: Gormley, T.R. (Ed.), Chilled Foods: The State of the Art. Elsevier Applied Science, UK, pp. 183 – 189.
Ontai, S.L., Paull, R.E., Saltveit, M.E., Jr., 1992. Controlled-atmosphere storage of sugar peas. HortScience 27, 39 – 41.
Pesis, E., 1995. Induction of fruits aroma and quality by post-harvest application of natural metabolites or anaero-bic conditions. In: Linskens, H.F., Jackson, J.F. (Eds.), Modern Methods of Plant Analysis, vol. 18, Fruit Analy-sis, Germany, pp. 19 – 35.
Saijo, N., Nagata, M., Ishii, G., 1989. Changes in chemical components of tomatoes during CA storage. In: Fellman, J.K. (Ed.), Proc. Intl. Cont. Atm. Res. Conf., 1989, vol. 2, Wenatche, WA, pp. 151 – 159.
Splittstoesser, W.E., 1978. Vegetable Growing Handbook. AVI Publishing Co. Inc, Westport, Connecticut. Tomkins, R.G., 1957. Peas kept for 20 days in gas storage.
The Grower 48, 226 – 227.
Wankier, B.N., Salunkhe, D.K., Campbell, W.F., 1970. Effect of controlled atmosphere storage on biochemical changes in apricot and peach fruits. J. Am. Soc. Hort. Sci. 95, 604 – 609.
Weichman, J., 1986. The effect of controlled atmosphere stor-age on the sensory and nutritional quality of fruits and vegetables. In: Janick, J. (Ed.), Horticultural Reviews 8. AVI Publishing Co., USA, pp. 101 – 127.
Wills, H.H.R., Lee, T.H., Graham, D., McGlasson, W.B., Hall, E.G., 1981. An Introduction to the Physiology and Handling of Fruits and Vegetables. New South Wales University Press Limited, Australia.
Zagory, D., Kader, A., 1989. Quality maintenance in fresh fruits and vegetables by controlled atmospheres. In: Jen, J. (Ed.), Quality factors of fruits and vegetables. American Chemical Society, USA, pp. 175 – 188.