Carlos Ordonez
Ladjel Bellatreche (Eds.)
123
LNCS 11031
20th International Conference, DaWaK 2018
Regensburg, Germany, September 3–6, 2018
Proceedings
Big Data Analytics
Commenced Publication in 1973 Founding and Former Series Editors:
Gerhard Goos, Juris Hartmanis, and Jan van Leeuwen
Editorial Board
David HutchisonLancaster University, Lancaster, UK Takeo Kanade
Carnegie Mellon University, Pittsburgh, PA, USA Josef Kittler
University of Surrey, Guildford, UK Jon M. Kleinberg
Cornell University, Ithaca, NY, USA Friedemann Mattern
ETH Zurich, Zurich, Switzerland John C. Mitchell
Stanford University, Stanford, CA, USA Moni Naor
Weizmann Institute of Science, Rehovot, Israel C. Pandu Rangan
Indian Institute of Technology Madras, Chennai, India Bernhard Steffen
TU Dortmund University, Dortmund, Germany Demetri Terzopoulos
University of California, Los Angeles, CA, USA Doug Tygar
University of California, Berkeley, CA, USA Gerhard Weikum
Big Data Analytics
and Knowledge Discovery
20th International Conference, DaWaK 2018
Regensburg, Germany, September 3
–
6, 2018
Proceedings
Carlos Ordonez University of Houston Houston, TX
USA
Ladjel Bellatreche LIAS/ISAE-ENSMA Chasseneuil-du-Poitou France
ISSN 0302-9743 ISSN 1611-3349 (electronic) Lecture Notes in Computer Science
ISBN 978-3-319-98538-1 ISBN 978-3-319-98539-8 (eBook) https://doi.org/10.1007/978-3-319-98539-8
Library of Congress Control Number: 2018950524
LNCS Sublibrary: SL3–Information Systems and Applications, incl. Internet/Web, and HCI ©Springer Nature Switzerland AG 2018
This work is subject to copyright. All rights are reserved by the Publisher, whether the whole or part of the material is concerned, specifically the rights of translation, reprinting, reuse of illustrations, recitation, broadcasting, reproduction on microfilms or in any other physical way, and transmission or information storage and retrieval, electronic adaptation, computer software, or by similar or dissimilar methodology now known or hereafter developed.
The use of general descriptive names, registered names, trademarks, service marks, etc. in this publication does not imply, even in the absence of a specific statement, that such names are exempt from the relevant protective laws and regulations and therefore free for general use.
The publisher, the authors and the editors are safe to assume that the advice and information in this book are believed to be true and accurate at the date of publication. Neither the publisher nor the authors or the editors give a warranty, express or implied, with respect to the material contained herein or for any errors or omissions that may have been made. The publisher remains neutral with regard to jurisdictional claims in published maps and institutional affiliations.
Big data analytics and knowledge discovery remain hot research areas for both aca-demia and the software industry, further fueled by advances in hardware and software. Important research topics associated with these major themes include data lakes (schema-free repositories), database design (ER modeling, prototyping), data integra-tion (especially linking structured and semistructured data sources), big data man-agement (mixing relational tables, text and any files), query languages (SQL and beyond), scalable analytic algorithms, parallel systems (cloud, parallel database sys-tems, Spark, MapReduce, HDFS), theoretical foundations, and practical applications.
With a track record of 20 editions, the International Conference on Big Data Analytics and Knowledge Discovery (DaWaK) has established itself as a high-quality forum for researchers, practitioners and developers in thefield of big data analytics. This year’s conference (DaWaK 2018) built on this tradition, facilitating the inter-disciplinary exchange of ideas, theory, techniques, experiences, and future research directions. DaWaK 2018 aimed to introduce innovative principles, methods, models, algorithms, industrial products, and experiences to solve challenging problems faced in the development of new-generation data management and analytic systems in the big data era.
Our call for papers attracted 76 papers, from which the Program Committeefinally selected 13 full papers and 16 short papers, yielding an acceptance rate of 17% for full papers and 38% overall. Each paper was reviewed by at least three reviewers and in some cases up tofive. Accepted papers cover a number of broad research areas on both theoretical and practical aspects. Some trends found in accepted papers include new generations of data warehouses, data lakes, data pre-processing, data mining, cloud computing, query processing, sequences, graph analytics, privacy-preserving data mining, and parallel processing. On the other hand, the program featured interesting case studies on social networks, Twitter sentiment analysis, understanding ground transportation modes, and E-commerce, among others.
For this 20th edition of DaWaK, we were pleased to have Prof. Il-Yeol Song from Drexel University (USA) as keynote speaker, giving an intriguing talk entitled:“Smart Aging: Topics, Applications, Technologies, and Agenda.”Il-Yeol is an ACM Distin-guished Scientist, an ER Fellow, and recipient of the 2015 Peter P. Chen Award in Conceptual Modeling.
Thanks to the history and reputation of DaWaK, editors of well-known journals agreed to receive extended versions of best papers selected from our program. This year, we were pleased to have two special issues in:Data and Knowledge Engineering (DKE, Elsevier) and Transactions on Large-Scale Data- and Knowledge-Centered Systems(TLDKS, Springer).
efforts of Amin Anjomshoaa for helping extend the confdriver system with several innovations to improve paper reviews, to help in deciding between full and short length, to manage a conference-to-journal long-term review process, and to create an interesting, packed, thought-provoking conference program. Finally, we would like to especially thank Gabriela Wagner for her endless help and patience.
For conference attendees, we hope they enjoyed the technical program, informal meetings, and interaction with colleagues from all over the world; and of course, we are confident they liked the picturesque city of Regensburg, Germany. For the readers of these proceedings, we hope these papers are interesting and they give you ideas for future research.
September 2018 Carlos Ordonez
Program Committee Co-chairs
Carlos Ordonez University of Houston, USA Ladjel Bellatreche ISAE-ENSMA, France
Program Committee
Alberto Abelló Universitat Politècnica de Catalunya, Spain Toshiyuki Amagasa University of Tsukuba, Japan
Elena Baralis Politecnico di Torino, Italy Ladjel Bellatreche ENSMA, France
Sadok Ben Yahia Faculty of Sciences of Tunis, Tunisia
Jorge Bernardino ISEC - Polytechnic Institute of Coimbra, Portugal Vasudha Bhatnagar Delhi University, India
Omar Boussaid University of Lyon/Lyon 2, France
Stephane Bressan National University of Singapore, Singapore Wellington Cabrera Teradata, USA
Sharma Chakravarthy The University of Texas at Arlington, USA Isabelle Comyn-Wattiau ESSEC Business School, Paris, France Alfredo Cuzzocrea University of Trieste, Italy
Laurent d’Orazio University of Rennes 1, France
Soumyava Das Teradata, USA
Karen Davis Miami University, USA
Claudia Diamantini UniversitàPolitecnica delle Marche, Italy Josep Domingo-Ferrer Universitat Rovira i Virgili, Spain Dejing Dou University of Oregon, USA Curtis Dyreson Utah State University, USA Markus Endres University of Augsburg, Germany
Leonidas Fegaras The University of Texas at Arlington, USA Filippo Furfaro DIMES, University of Calabria, Italy Pedro Furtado Universidade de Coimbra, Portugal Carlos Garcia-Alvarado Autonomic LLC, USA
Javier Garcia-Garcia C3 UNAM University, Mexico Kazuo Goda The University of Tokyo, Japan Matteo Golfarelli DISI, University of Bologna, Italy Sergio Greco University of Calabria, Italy Abdelkader Hameurlain Paul Sabatier University, France Takahiro Hara Osaka University, Japan
Frank Hoppner Ostfalia University of Applied Sciences, Germany Yoshiharu Ishikawa Nagoya University, Japan
Lili Jiang UmeåUniversity, Sweden
Selma Khouri LCSI/ESI (Algeria) and LIAS/ISAE-ENSMA (France), Algeria
Uday Kiran Rage University of Tokyo, Japan
Nhan Le-Thanh Nice Sophia Antipolis University, France
Jens Lechtenboerger Westfalische Wilhelms–Universität Münster, Germany Carson Leung University of Manitoba, Canada
Sofian Maabout University of Bordeaux, France
Yannis Manolopoulos Aristotle University of Thessaloniki, Greece Patrick Marcel UniversitéFrançois Rabelais Tours, France Jun Miyazaki Tokyo Institute of Technology, Japan Anirban Mondal Ashoka University, India
Yasuhiko Morimoto Hiroshima University, Japan Makoto Onizuka Osaka University, Japan Carlos Ordonez University of Houston, USA
Alex Poulovassilis Birkbeck, University of London, UK Praveen Rao University of Missouri-Kansas City, USA Goce Ristanoski Data61, CSIRO, Australia
Oscar Romero Universitat Politècnica de Catalunya, Spain
Laura Rusu IBM, Australia
Ilya Safro Clemson University, USA
Sherif Sakr Software Systems Research Group, NICTA, University of New South Wales, Australia
Abhishek Santra University of Texas at Arlington, USA
Alkis Simitsis HP Labs, USA
Emanuele Storti UniversitàPolitecnica delle Marche, Italy Aditya Telang University of Texas at Arlington, USA Olivier Teste IRIT, University of Toulouse, France Dimitri Theodoratos New Jersey Institute of Technology, USA Predrag Tosic Washington State University, USA Panos Vassiliadis University of Ioannina, Greece
Robert Wrembel Poznan University of Technology, Poland Yinghui Wu Washington State University, USA
Wai GenYee Grubhub, USA
Yinuo Zhang Teradata, USA
Yiqun Zhang VoltDB Inc., USA
Additional Reviewers
Mohammed El Malki Toulouse University/IRIT-UMR5505, France Sergio Martínez Universitat Rovira i Virgili, Catalonia Luis del Vasto Universitat Rovira i Virgili, Catalonia Michael Bamiloshin Universitat Rovira i Virgili, Catalonia Calvin S. H. Hoi University of Manitoba, Canada
Oluwafemi A. Sarumi Federal University of Technology–Akure, Nigeria Neelabh Pant Walmart, Plano, Texas, USA
Abhishek Santra University of Arlington, Texas, USA
Soumyava Das Teradata, CA, USA
Aggeliki Dimitriou National Technical University of Athens, Greece Michael Lan New Jersey Institute of Technology, USA Xiaoying Wu Wuhan University, China
Daniele Apiletti Politecnico di Torino, Italy Andrea Pasini Politecnico di Torino, Italy Eliana Pastor Politecnico di Torino, Italy
Anastasios Gounaris Aristotle University of Thessaloniki, Greece Irina Trubitsyna University of Calabria, Italy
Gianvincenzo Alfano University of Calabria, Italy Francesco Parisi University of Calabria, Italy Sharanjit Kaur University of Delhi, India Daniel Ernesto Lopez
Barron
Technologies, and Agenda
(Abstract of Keynote Speaker)
Il-Yeol Song
College of Computing and Informatics, Drexel University, Philadelphia, PA, USA
Abstract.Aging is a rapidly growing social problem in the developed world. It is critically important to mitigate the effects of aging, improve elderly people’s life, and improve overall quality of healthcare environments. Smart aging addresses those challenges by intelligently utilizing modern biomedical, digital healthcare, big data computing & analytics, IOT, and communication tech-nologies. In this talk, I willfirst review several innovative R&D projects and services for smart aging. I will then present a comprehensive review of various research activities on smart aging from the content analysis of public web pages and the web pages of NIH funded research projects related to smart aging. I will then cover recent developments in big data technologies for smart health, including healthcare data warehouses, data lakes and big data analytics. I will conclude my talk with a summary of suggestions on smart aging projects and research topics in smart aging.
Graph Analytics
Graph BI & Analytics: Current State and Future Challenges . . . 3 Amine Ghrab, Oscar Romero, Salim Jouili, and Sabri Skhiri
Community Detection in Who-calls-Whom Social Networks. . . 19 Ciprian-Octavian Truică, Olivera Novović, Sanja Brdar,
and Apostolos N. Papadopoulos
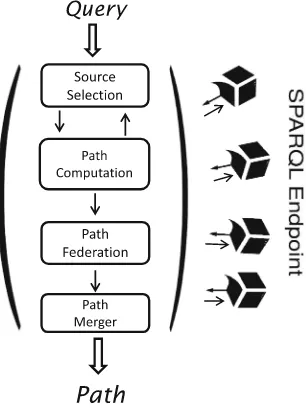
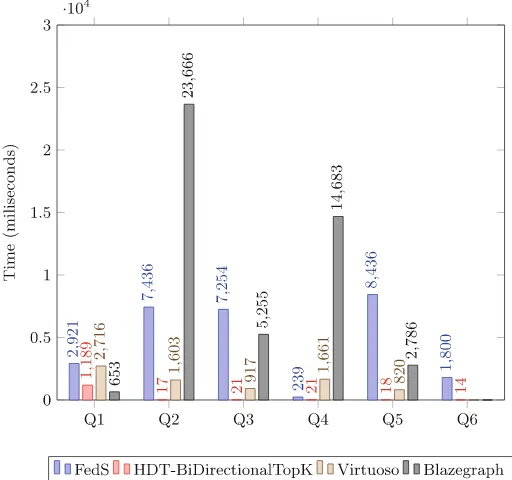
FedS: Towards Traversing Federated RDF Graphs . . . 34 Qaiser Mehmood, Alokkumar Jha, Dietrich Rebholz-Schuhmann,
and Ratnesh Sahay
Case Studies
Adversarial Spiral Learning Approach to Strain Analysis for Bridge
Damage Detection . . . 49 Takaya Kawakatsu, Akira Kinoshita, Kenro Aihara, Atsuhiro Takasu,
and Jun Adachi
CoRe: Generating a Computationally Representative Road Skeleton
-Integrating AADT with Road Structure . . . 59 Rohith Reddy Sankepally and K. S. Rajan
E-Commerce Product Recommendation Using Historical Purchases
and Clickstream Data. . . 70 Ying Xiao and C. I. Ezeife
Effective Classification of Ground Transportation Modes for Urban
Data Mining in Smart Cities . . . 83 Carson K. Leung, Peter Braun, and Adam G. M. Pazdor
Location Prediction Using Sentiments of Twitter Users . . . 98 Ritu Singh and Durga Toshniwal
Classification and Clustering
A Clustering Model for Uncertain Preferences Based on Belief Functions . . . 111 Yiru Zhang, Tassadit Bouadi, and Arnaud Martin
KMN - Removing Noise from K-Means Clustering Results . . . 137 Benjamin Schelling and Claudia Plant
Subset Labeled LDA: A Topic Model for Extreme
Multi-label Classification . . . 152 Yannis Papanikolaou and Grigorios Tsoumakas
Third Party Data Clustering Over Encrypted Data Without Data Owner
Participation: Introducing the Encrypted Distance Matrix . . . 163 Nawal Almutairi, Frans Coenen, and Keith Dures
Pre-proccesing
An Efficient Prototype Selection Algorithm Based on Spatial Abstraction . . . 177 Joel Luís Carbonera and Mara Abel
Web Usage Data Cleaning: A Rule-Based Approach for Weblog
Data Cleaning. . . 193 Amine Ganibardi and Chérif Arab Ali
Anonymization of Multiple and Personalized Sensitive Attributes . . . 204 Jerry Chun-Wei Lin, Qiankun Liu, Philippe Fournier-Viger,
Youcef Djenouri, and Ji Zhang
TRANS-AM: Discovery Method of Optimal Input Vectors Corresponding
to Objective Variables . . . 216 Hiroaki Tanaka, Yu Suzuki, Koichiro Yoshino, and Satoshi Nakamura
Sequences
Discovering Periodic Patterns Common to Multiple Sequences . . . 231 Philippe Fournier-Viger, Zhitian Li, Jerry Chun-Wei Lin,
Rage Uday Kiran, and Hamido Fujita
Discovering Tight Space-Time Sequences . . . 247 Riccardo Campisano, Heraldo Borges, Fabio Porto, Fabio Perosi,
Esther Pacitti, Florent Masseglia, and Eduardo Ogasawara
Cloud and Database Systems
CloudDBGuard: Enabling Sorting and Searching on Encrypted Data
in NoSQL Cloud Databases . . . 261 Tim Waage and Lena Wiese
Querying Heterogeneous Data in Graph-Oriented NoSQL Systems . . . 289 Mohammed El Malki, Hamdi Ben Hamadou, Max Chevalier,
AndréPéninou, and Olivier Teste
Selection of Bitmap Join Index: Approach Based
on Minimal Transversals . . . 302 Issam Ghabry, Sadok Ben Yahia, and M. Nidhal Jelassi
Scalable Random Sampling K-Prototypes Using Spark . . . 317 Mohamed Aymen Ben HajKacem, Chiheb-Eddine Ben N’cir,
and Nadia Essoussi
Data Mining
ERAPN, an Algorithm for Extraction Positive and Negative Association
Rules in Big Data . . . 329 Parfait Bemarisika and AndréTotohasina
Multistep-ahead Prediction: A Comparison of Analytical
and Algorithmic Approaches . . . 345 Fouad Bahrpeyma, Mark Roantree, and Andrew McCarren
Novel Data Segmentation Techniques for Efficient Discovery of Correlated
Patterns Using Parallel Algorithms . . . 355 Amulya Kotni, R. Uday Kiran, Masashi Toyoda, P. Krishna Reddy,
and Masaru Kitsuregawa
Time Series Distance Density Cluster with Statistical Preprocessing . . . 371 Ruizhe Ma, Soukaina Filali Boubrahimi, and Rafal Angryk
Debate Stance Classification Using Word Embeddings. . . 382 Anand Konjengbam, Subrata Ghosh, Nagendra Kumar,
and Manish Singh
and Future Challenges
Amine Ghrab1,2(B), Oscar Romero2, Salim Jouili1, and Sabri Skhiri1 1 EURA NOVA R&D, Mont-Saint-Guibert, Belgium
{amine.ghrab,salim.jouili,sabri.skhiri}@euranova.eu 2 Universitat Polit`ecnica de Catalunya, Barcelona, Spain
Abstract. In an increasingly competitive market, making well-informed decisions requires the analysis of a wide range of heterogeneous, large and complex data. This paper focuses on the emerging field of graph ware-housing. Graphs are widespread structures that yield a great expres-sive power. They are used for modeling highly complex and intercon-nected domains, and efficiently solving emerging big data application. This paper presents the current status and open challenges of graph BI and analytics, and motivates the need for new warehousing frame-works aware of the topological nature of graphs. We survey the topics of graph modeling, management, processing and analysis in graph ware-houses. Then we conclude by discussing future research directions and positioning them within a unified architecture of a graph BI and analytics framework.
1
Introduction
Graphs are fundamental and widespread structures that provide an intuitive abstraction for the modeling and analysis of complex, heterogeneous and highly interconnected data. They have the benefit of revealing valuable insights from content-based and topological properties of data. The great expressive power of graphs, along with their solid mathematical background, encourages their use for modeling domains having complex structural relationships. In the context of Big Data, the focus of organizations is often on handling the rising volume of their data. However the variety and complexity of data through the different phases of data capturing, modeling and analysis is at least equally important. The variety challenge is the most critical challenge in big data nowadays, and efficiently handling the variety of data sources is considered to be the main driver of success for data-driven organizations [1]. Graphs meet the requirements to be the perfect canonical data model for data integration systems [2] given (1) their capability to deal with semantic relativism and semantic heterogeneities, (2) they are semantically richer at least as any other model (so they can represent any semantics), (3) they allow to create multiple views from the same source, (4) and most importantly, graphs are extremely flexible to compose new graphs.
c
Springer Nature Switzerland AG 2018
That is given two graphs, with one single edge a new graph could be directly created without affecting the existing ones. Therefore, graphs are suitable to deal with big data variety better than any other data model.
Furthermore, in industry, graph analysis is considered as“possibly the single most effective competitive differentiator for organizations pursuing data-driven operations and decisions after the design of data capture”according to Gartner, Inc., a research and advisory firm [3]. Indeed, large complex graphs have emerged in various fields and graph analytics are being increasingly used to solve complex real-world problems. In the financial sector for example, several types of fraud could be detected and prevented in auction and transaction networks [4]. In [5], the authors used bank transaction to build a financial transactions network, where each node represents a client, and each edge represents a transaction. As fraudsters tend to collaborate to orchestrate complex fraud at large scale, the probability that a customer is involved in a fraud depends on his neighborhood in the transaction graph. Graph analytics could be used to define and retrieve complex fraud patterns, or to score customers by fraud exposure. In [6], the authors built a Call Detail Record graph to understand the call routines and interactions between customers. This information can later be used to prepare marketing campaigns or to prevent customer churn.
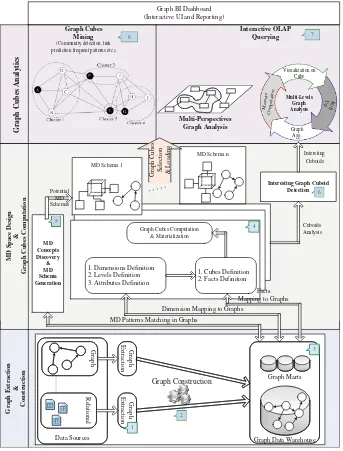
Figure1 provides an overview of the different components of the envisioned graph BI system. While adopting a similar template as the traditional BI systems (i.e., it preserves the familiar data analytics workflow), graph BI extends current systems with graph-aware components that deliver graph-derived insights.
Fig. 1.Integration of Graph and Traditional BI
Note that through this paper the terms “graph and network”, “node and ver-tex”, and “edge and relationship” are often used interchangeably. The remainder of this paper presents the current state and the open challenges of graph BI & analytics, with a focus on graph warehousing. Section2 discusses the topic of graph data modeling and management. Section3surveys the existing frameworks for graph analytics. Section4 identifies future research directions and position them within a unified architecture of a graph BI & analytics framework.
2
Graph Data Modeling
2.1 Graph Models
According to the literature, the two main families of graphs are property graphs and knowledge graphs:
Property Graphs: Property graphs describe a directed, labeled and attributed multi-graph. Each real-world entity is represented by a node that contains its label and properties. The label denotes the “type” of the node (i.e., the class to which it belongs). Relationships between entities are represented using edges. The flexibility of property graph models allows the representation of rich struc-tural properties, such as hierarchies and assertions. Property graphs were intro-duced in the database community to store schemaless data (due to their flexibil-ity to absorb any semantics and attach data with metadata). In the literature, multiple query languages were designed to enable graph-oriented querying of property graphs [14]. However, there is no standard query language for property graphs. Therefore, graph database vendors defined their own graph traversal and query languages, such as Cypher and Gremlin. Cypher is an SQL-like declara-tive language, that uses isomorphism-based no-repeated-edges bag semantics. It was introduced by Neo4j, and is centered around pattern matching enriched by built-in algorithmic operators. Gremlin is a graph traversal language, built using Groovy, introduced by Apache TinkerPop3, that uses the homomorphism-based bag semantics.
databases. One key aspect with regard to property graphs is that they provide means (i.e., URI) to universally identify graph vertices and edges from exter-nal sources. This facilitates linking and sharing of data and metadata. However, unlike property graphs and traditional graph databases, which are optimized for graph traversal, they are primarily optimized for handling RDF triples. Another difference is that in property graphs properties could be directly added to edges as well as vertices. In essence, however, knowledge graphs are also graphs and can benefit from the traditional graph algebras presented in the database field.
2.2 Graph Management
Orthogonal to the previous classification there are two main approaches widely used for graph data management (regardless of property or knowledge graphs) at the logical/physical level. The first consists on the use of native graph data mod-els and database engines. The second leverages alternative modmod-els, mainly the relational model. For the latter, the graph data is represented by a set of tables, i.e., node tables and edge tables. Traditionally, relational-based graph database engines have been related to triplestores and knowledge graphs, whereas native graph database engines were related to property graphs. Nevertheless, this is nowadays changing and it is currently possible to find native databases for knowl-edge graphs. These approaches are discussed next:
Native Graph Data Models: In recent years, the trend in developing graph data management systems has shifted to the development of native, relationship-oriented graph databases. Most native graph databases implement the property graph model or a variation of it. The problem of impedance mismatch is resolved since relationships are first-class citizen, and the data is represented as it is per-ceived without the need to project it on an intermediate representation. The data model is more straightforward to design, and the queries are more intuitive to formulate [15]. From a performance perspective, graph databases are optimized for graph traversals. The cost of traversing an edge is constant, and the overall cost of arbitrary navigation through the graph is much lower than the equiva-lent joins in relational tables. Subsequent implementation aspects such as graph query processing, indexing, storage, matching and retrieval which are specifically developed and tuned for graph workloads lead to better performances, especially for queries requiring multiple joins, or containing cycles or other complex pat-terns. However, they perform worse than the relational-based engines for ana-lytical queries that perform scans over the whole graph. In the software market, established BI vendors are aware of the potential of native graph solutions and have already developed many graph databases such as Neo4j, DataStax Enter-prise Graph, Oracle Spatial and Graph, Microsoft GraphEngine, IBM Graph, and Amazon Neptune.
wide range of relational platforms. However, the relational model and its imple-mentations fall short of meeting the requirements for (1) intuitive data model-ing, (2) topology-aware graph querying (such as path retrieval and comparison, and graph pattern matching), and (3) traversal-optimized performances. Map-ping graph data to relational representation raises the problem of impedance mismatch at the modeling and querying levels. For example, due to the funda-mental difference between the two models, transformation of graph data to the relational model is a manual, complicated process, with a high risk of informa-tion loss during the transformainforma-tion process. The relainforma-tional model was designed to handle data such as sets of records and transactions instead of entities and connections. The relational query languages and query processing engines are optimized to perform table scans instead of traversals. Graph traversal is often simulated using expensive join operations, which incurs a heavy workload espe-cially for highly interconnected tables. Moreover, the SQL is not suited to target the topology of the graph with queries such as pattern matching, neighborhood or path retrieval.
3
Graph Analytics
A plethora of graph analysis techniques were proposed in the literature to reveal interesting properties about the graph topology and the connectivity between graph elements. The core analysis operations of graphs are (1) graph traversal to assess reachability, find shortest paths, and retrieve the neighborhood, (2) met-rics computation of local (e.g., centrality), and global properties (e.g., diameter), and (3) graph matching, such as subgraph isomorphism and pattern matching [14]. Most of these operations are supported by graph database engines. This section describes more advanced graph analytics and focuses on three pillars of graph analytics: graph OLAP, graph mining, and graph processing.
3.1 OLAP on Graphs
single nodes. In the first case, the attributes of the snapshots are called informa-tional dimensions. The aggregations of the graph are performed by overlaying a collection of graph snapshots and merging those with shared informational values. The analysis is referred to as informational OLAP aggregations, and consists in edge-centric snapshot overlaying. Thus only edges are merged and changed, with no changes made to the nodes. In the second case, the attributes of the nodes are called topological dimensions. Topological OLAP aggregations consist on merging nodes and edges by navigating through the nodes hierarchy. Qu et al. introduced a more detailed framework for topological OLAP analysis of graphs [16]. The authors discussed the structural aggregation of the graph fol-lowing the OLAP paradigm. They presented techniques based on the properties of the graph measures for optimizing measure computations through the differ-ent aggregation levels. Berlingerio et al. [17] defined a multidimensional model similar to Graph OLAP, but where the dimensions are the labels of the edges, and presented a set of analytical graph-based measures.
Graph Cube is a framework for multidimensional analysis and cube computation over the different levels of aggregations of a graph [18]. It targets single, homo-geneous, node-attributed graphs. A subset of the attributes of the nodes is con-sidered as the dimensions. Following these so-called dimensions, the graph cube is obtained by restructuring the initial graph in all possible aggregation. Given n dimensional attributes, the framework introduces the cuboid query, which generates 2n
not until the definition of the QB4OLAP vocabulary that cubes on RDF graphs could not be guaranteed to be MD-compliant. In [24], Varga et al. discusses the drawbacks of previous vocabularies, such as QB, to properly represent MD data and how QB4OLAP overcomes them. This way, resulting cubes can be prop-erly analyzed with traditional OLAP algebras. Relevantly, Nath et al. present a framework to conduct ETL transformations on top of graph data to produce QB4OLAP-based cubes [25].
3.2 Graph Mining
Data mining refers to the process of discovering patterns or models for data. In contrast to querying that retrieves known patterns, mining enable the discovery of previously unknown, implicit information and knowledge embedded within a dataset. Traditionally, data mining techniques process data as collection of inde-pendent instances (i.e. observations). However, the recent emergence of graph structure as a rich data model involves a paradigm shift on how data mining algorithms can be applied. In fact, graph mining algorithms provide a new way of extracting and discovering latent insight from graphs by leveraging the rela-tionships between entities. However, graph mining algorithms face three main challenges: (1) adapting the mining algorithms to make them graph-aware, (2) redesigning the algorithms to be implemented by those new high-performance techniques, and (3) storing and exploiting multiple but related graphs that serve for the same business purpose as in the graph warehouse.
A plethora of graph mining techniques were proposed in the literature such as graph clustering, frequent subgraph mining, proximity pattern mining and link prediction. These techniques are relevant in the BI context as they reveal interesting properties about the topology and the connectivity between business entities. For example, consider the case of recommender systems in e-commerce [26]. The domain could be a represented as a bipartite purchase graph, with two types of nodes representing products and customers. An edge is added between a product and a customer if the latter has bought the product. Using graph mining such as graph clustering, two other graphs could be derived: (1) client similarity graph, and (2) product similarity graph. Mining these three graphs enables advanced analysis scenarios such as (1) customer profiling by detecting customer groups using community detection, and the leaders within each group using centrality, (2) product segmentation by detecting products representative of each segment, and (3) using link prediction, targeted marketing personalized to the customer’s profile and tailored by current product trends.
could assist the analyst in complex tasks such as building summarized business-oriented views of the graph, providing new perspectives to analyze the graph, or discovering interesting or anomalous patterns within the large graph cube space. In the context of outlier detection, graphs provide an elegant framework to predict and describe outliers. For example, in the context of graph cubes mining, [27] developed a measure of interestingness of patterns in a graph cube, while [28] proposed an entropy-based filter to detect interesting associations between attributed nodes in a graph cube.
3.3 Graph Processing
To deal with large and evolving graphs, which is the case in data warehouses, graph BI systems need to integrate large-scale graph processing frameworks. Graph processing frameworks are designed to natively support the graph topol-ogy, and they offer graph programming models and abstractions to easily imple-ment a multitude of graph algorithms. These frameworks have the capabilities to efficiently perform large scale, ad-hoc, and distributed computations over large graph data that exceed a single machine capacity. They offer features such as automatic graph partitioning, load balancing, network and disk transfer opti-mization, and fail-over of the processing tasks.
However, distributed graph processing poses additional challenges to cen-tralized or traditional parallel data processing in that [29]: (1) graph structure is irregular which poses challenges to the graph data partitioning and limits parallelism, (2) computation is driven by the structure, which causes a poor memory locality and poses data transfer issues, and (3) algorithms traverse the partitioned graph in an exploratory way, and are iterative by nature, which is I/O intensive. To tackle these challenges and enable efficient large-scale graph analytics, different processing paradigms were introduced [30]:
– Hadoop Family frameworks: MapReduce denotes a programming model for large-scale data processing. Hadoop is an open-source framework that sup-ports data-intensive distributed applications and clones the Google’s MapRe-duce framework. It is designed to process large amount of unstructured and complex data and runs on shared-nothing architectures. MapReduce frame-works are useful for content-based aggregation of graphs (e.g., graph cube aggregation), but they are not efficient for graph-specific computations [31]. – Synchronous frameworks: Pregel [32], and its open source implementation
and it waits for the rest of processes to finish before proceeding to the next super-step. The advantage of this paradigm is that it ensures a deadlock-free computation. However, the downside is the execution time, where the system has to wait for the slowest machines to finish before proceeding.
– Asynchronous frameworks: In contrast to the synchronous shared-nothing processing frameworks, GraphLab [33] and PowerGraph [34] are asynchronous and follows the Gather-Apply-Scatter computational model, with shared memory abstraction. These frameworks might provide better performances, but incur more complexity and higher scheduling and consistency costs. – Hybrid Systems: These frameworks enable a mixed workload of graph-parallel
and data-parallel processing. GraphX [35] is a component of Apache Spark [36] developed for graph processing. It is a fault-tolerant, distributed, in-memory graph processing framework built on top of the Resilient Distributed Dataset abstraction. GraphX provides a set of primitive operators to load and interactively query the graph data. GRADOOP is a distributed framework for graph management and querying [37]. It introduces a new graph model that extends property graphs, support Cypher queries, and the queries are processed using of Apache Flink [38].
4
Future Research Directions
This paper calls for the development of novel intelligent, efficient and industry-grade graph warehousing systems. The potential directions include (1) further research on solving complex graph problems (e.g., subgraph isomorphism and graph partitioning), (2) building native graph components (e.g., native graph ETL operations, graph OLAP engines, and a multidimensional query language for graphs), and (3) the integration of artificial intelligence techniques to enable self-service BI for business users. To this end, machine learning should be inte-grated within the BI systems to automate the warehousing tasks from data preparation, to complex modeling and augmented analytics of graphs (e.g., auto-mated discovery of multidimensional concepts, detection of interesting patterns, and forecasting of business KPIs evolution).
The modules missing for developing an industry-grade graph BI and analytics system are unified in the envisioned architecture presented in Fig.2, and they summarize the future research directions as follows:
– Graph Extraction (1): This module allows the extraction of graph data from different data sources that could initially be in various formats and flowing at various rates such as graph streams. The data is cleaned to only capture enti-ties that satisfy the quality constraints (e.g., contains the required attributes with valid values), which guarantees the reliability of data.
Multi-Perspectives
ML techniques such as Information Retrieval and Automatic Natural Lan-guage Processing could help in the automated extraction and construction of multidimensional graphs from unstructured data such as text. For example, geo-location and sentiment analysis could be applied to enrich the attributes of the data entities and therefore equip businesses with the capability to ana-lyze data from new perspectives. New graph entities could be discovered as well. For instance, using community detection, new labels could be added to the nodes, and using similarity, new edges could be added between the similar node. Multiple variation of the traditional ETL approach exist in the literature, and might be worth exploring for Graph ETL such as the Extract-Load-Transform, or the Capture-Transform-Flow.
– Graph Data Warehouse (3): The graph data warehouse is the reference central information repository for graph-based decision making. Data is extracted from different sources and integrated using a common graph model. The cleansed and integrated data is natively stored and managed as a multidimen-sional graph in the graph warehouse. Whereas that data would be transformed to tables in traditional data warehouses. Nevertheless, the conceptual layer remains the same (i.e., represented as dimensions and facts). The changes are related to the logical and physical levels. The graph warehouse provides a suitable backbone for natively analyzing graphs with BI tools such as graph OLAP and graph mining.
– Cube Design and Computation (4): The semantic relativism inherent in graphs allows to create several views from the same data and make them co-exist in a much simpler way than other data models. Afterwards, given a graph lattice, the graph cubes enable the computation and the aggregation of corresponding graph cuboids. Once the required graph cuboids are com-puted, the result is persisted in the corresponding data marts. To leverage graph properties, graph cubes embed graph-structured measures and dimen-sions. There is a need for cube computation and aggregation libraries capable of efficiently handling graphs. This line of research includes optimizations such as graph cuboids materialization, indexing, and graph icebergs.
– Discovery of multidimensional concepts and definition of potential multidi-mensional schemas (5): Multiple multidimultidi-mensional schemas could be built from the same graph warehouse to satisfy the various analysis needs. Real-world graphs, such as social networks, are complex, dynamic and flexible. Interesting graph entities might be hidden in the large data sources. There-fore, there is need for novel graph-aware approaches that enables automatic detection and extraction of multidimensional concepts from large complex graphs. This could be done through the analysis of the topological aspects of graphs, and the projection of the properties of the multidimensional models on them. This will help end-users cope with the complexity and large volume of graphs, and expose potential interesting discovery to decision makers. – Assistance with the analysis and synthesis of graphs (6): Given the
self-service BI and facilitate complex tasks such as the extraction of mean-ingful graph summaries, the discovery of interesting phenomena in the graph cuboids such as frequent graph patterns and outlier relationships.
– Mining and querying OLAP cubes (7–8): Complex and interactive OLAP analysis and mining of graph cubes is performed at this phase. In contrast to traditional OLAP, graph cubes enable the multidimensional analysis of graph metrics stored in the graph cuboids. For example, analysts could examine the centrality of leaders from multiple perspectives, or identify the communities and their connections at different levels of aggregations. To this end, there is a need to develop graph OLAP engines that support graph-structured cubes. In addition, Online Analytical Mining of graph data is a promising research direction to empower graph OLAP with mining capabilities. Graphs are dynamic and enabling OLAP on evolving networks by analyzing changing facts and dimensions will help in understanding the structural and informa-tional evolution of networks. Many BI vendors have already integrated graphs into their BI solutions. However, the support for graphs is still limited and there is still a need to push further the integration of graph-derived insights into the decision-making process.
5
Conclusion
Graphs are interesting structures that provide a solid foundation for intuitively representing various domains and solving complex problems, while enabling bet-ter performance. Graph analytics leverage structural and content-based infor-mation to create added-value services, and extend current solutions with new topology-enabled capabilities. In this paper, we surveyed the state of the art on graph BI and analytics, and proposed an architecture of Graph BI and Analytics platform augmented with machine learning capabilities, which lays the founda-tions for promising future research direcfounda-tions. In all, graph analytics have a bright future, and this paper calls for more attention from academia and industry to build next-generation graph-powered BI and analytics frameworks.
References
1. Bean, R.: Variety, not volume, is driving big data initiatives (2016). https:// sloanreview.mit.edu/article/variety-not-volume-is-driving-big-data-initiatives/. Accessed 25 Jan 2018
2. Garc´ıa-Solaco, M., Saltor, F., Castellanos, M.: In: Bukhres, O.A., Elmagarmid, A.K. (eds.) Object-Oriented Multidatabase Systems, pp. 129–202. Prentice Hall International (UK) Ltd, Hertfordshire, UK (1995)
3. Feinberg, D., Heudecker, N.: IT market clock for database management sys-tems (2014). https://www.gartner.com/doc/2852717/it-market-clock-database-management. Accessed 02 Jan 2018
5. Van Vlasselaer, V., Bravo, C., Caelen, O., Eliassi-Rad, T., Akoglu, L., Snoeck, M., Baesens, B.: Apate: a novel approach for automated credit card transaction fraud detection using network-based extensions. Decis. Support Syst.75, 38–48 (2015) 6. Dasgupta, K., Singh, R., Viswanathan, B., Chakraborty, D., Mukherjea, S.,
Nanavati, A.A., Joshi, A.: Social ties and their relevance to churn in mobile tele-com networks. In: Proceedings of the 11th International Conference on Extending Database Technology, EDBT 2008. Advances in database technology, New York, USA, pp. 668–677. ACM (2008)
7. Duan, L., Da Xu, L.: Business intelligence for enterprise systems: a survey. IEEE Trans. Industr. Inform.8(3), 679–687 (2012)
8. Lim, E.P., Chen, H., Chen, G.: Business intelligence and analytics: Research direc-tions. ACM Trans. Manag. Inf. Syst.3(4), 17 (2013)
9. Cuzzocrea, A., Bellatreche, L., Song, I.Y.: Data warehousing and OLAP over big data: Current challenges and future research directions. In: Proceedings of the Sixteenth International Workshop on Data Warehousing and OLAP, pp. 67–70. ACM (2013)
10. Skhiri, S., Jouili, S.: Large graph mining: recent developments, challenges and potential solutions. In: Aufaure, M.-A., Zim´anyi, E. (eds.) eBISS 2012. LNBIP, vol. 138, pp. 103–124. Springer, Heidelberg (2013). https://doi.org/10.1007/978-3-642-36318-4 5
11. Shi, C., Li, Y., Zhang, J., Sun, Y., Philip, S.Y.: A survey of heterogeneous infor-mation network analysis. IEEE Trans. Knowl. Data Eng.29(1), 17–37 (2017) 12. Chen, C., Yan, X., Zhu, F., Han, J., Yu, P.S.: Graph OLAP: a multi-dimensional
framework for graph data analysis. Knowl. Inf. Syst.21(1), 41–63 (2009)
13. Hannachi, L., Benblidia, N., Boussaid, O., Bentayeb, F.: Community cube: a semantic framework for analysing social network data. Int. J. Metadata Semant. Ontol.10(3), 155–169 (2015)
14. Angles, R., Arenas, M., Barcel´o, P., Hogan, A., Reutter, J., Vrgoˇc, D.: Foundations of modern query languages for graph databases. ACM Comput. Surv. 50(5), 68 (2017)
15. H¨olsch, J., Schmidt, T., Grossniklaus, M.: On the performance of analytical and pattern matching graph queries in neo4j and a relational database. In: Ioanni-dis, Y.E., Stoyanovich, J., Orsi, G. (eds.) Proceedings of the Workshops of the EDBT/ICDT 2017 Joint Conference (EDBT/ICDT 2017), Venice, Italy, March 21–24, 2017. Volume 1810 of CEUR Workshop Proceedings, CEUR-WS.org (2017) 16. Qu, Q., Zhu, F., Yan, X., Han, J., Yu, P.S., Li, H.: Efficient topological OLAP on information networks. In: Yu, J.X., Kim, M.H., Unland, R. (eds.) DASFAA 2011, Part I. LNCS, vol. 6587, pp. 389–403. Springer, Heidelberg (2011). https://doi. org/10.1007/978-3-642-20149-3 29
17. Berlingerio, M., Coscia, M., Giannotti, F., Monreale, A., Pedreschi, D.: Multidi-mensional networks: foundations of structural analysis. World Wide Web16(5–6), 567–593 (2013)
18. Zhao, P., Li, X., Xin, D., Han, J.: Graph cube: On warehousing and OLAP mul-tidimensional networks. In: Proceedings of the 2011 ACM SIGMOD International Conference on Management of data, pp. 853–864. ACM (2011)
20. Ghrab, A., Romero, O., Skhiri, S., Vaisman, A., Zim´anyi, E.: A framework for building OLAP cubes on graphs. In: Morzy, T., Valduriez, P., Bellatreche, L. (eds.) ADBIS 2015. LNCS, vol. 9282, pp. 92–105. Springer, Cham (2015).https://doi. org/10.1007/978-3-319-23135-8 7
21. Nebot, V., Berlanga, R.: Building data warehouses with semantic web data. Decis. Support Syst.52(4), 853–868 (2012)
22. K¨ampgen, B., Harth, A.: Transforming statistical linked data for use in OLAP systems. In: Proceedings of the 7th International Conference on Semantic Systems, pp. 33–40. ACM (2011)
23. Beheshti, S.M.R., Benatallah, B., Motahari-Nezhad, H.R.: Scalable graph-based olap analytics over process execution data. Distrib. Parallel Databases34(3), 379– 423 (2016)
24. Varga, J., Vaisman, A.A., Romero, O., Etcheverry, L., Pedersen, T.B., Thomsen, C.: Dimensional enrichment of statistical linked open data. Web Semant. Sci. Serv. Agents World Wide Web40, 22–51 (2016)
25. Nath, R.P.D., Hose, K., Pedersen, T.B., Romero, O.: SETL: a programmable semantic extract-transform-load framework for semantic data warehouses. Inf. Syst.68, 17–43 (2017)
26. Lee, K., Lee, K.: Escaping your comfort zone: a graph-based recommender system for finding novel recommendations among relevant items. Expert Syst. with Appl. 42(10), 4851–4858 (2015)
27. Demesmaeker, F., Ghrab, A., Nijssen, S., Skhiri, S.: Discovering interesting pat-terns in large graph cubes. In: 2017 IEEE International Conference on Big Data (Big Data), pp. 3322–3331 (2017)
28. Bleco, D., Kotidis, Y.: Entropy-based selection of graph cuboids. In: Proceedings of the Fifth International Workshop on Graph Data-management Experiences & Systems, vol. 2. ACM (2017)
29. Lumsdaine, A., Gregor, D., Hendrickson, B., Berry, J.: Challenges in parallel graph processing. Parallel Process. Lett.17(01), 5–20 (2007)
30. Batarfi, O., El Shawi, R., Fayoumi, A.G., Nouri, R., Barnawi, A., Sakr, S., et al.: Large scale graph processing systems: survey and an experimental evaluation. Clus-ter Comput.18(3), 1189–1213 (2015)
31. Denis, B., Ghrab, A., Skhiri, S.: A distributed approach for graph-oriented mul-tidimensional analysis. In: 2013 IEEE International Conference on Big Data, pp. 9–16, October 2013
32. Malewicz, G., Austern, M.H., Bik, A.J., Dehnert, J.C., Horn, I., Leiser, N., Czajkowski, G.: PREGEL: a system for large-scale graph processing. In: Proceed-ings of the 2010 ACM SIGMOD International Conference on Management of Data, pp. 135–146. ACM (2010)
33. Low, Y., Bickson, D., Gonzalez, J., Guestrin, C., Kyrola, A., Hellerstein, J.M.: Distributed graphlab: a framework for machine learning and data mining in the cloud. Proc. VLDB Endow.5(8), 716–727 (2012)
34. Gonzalez, J.E., Low, Y., Gu, H., Bickson, D., Guestrin, C.: Powergraph: Dis-tributed graph-parallel computation on natural graphs. In: OSDI, vol. 12, p. 2 (2012)
35. Gonzalez, J.E., Xin, R.S., Dave, A., Crankshaw, D., Franklin, M.J., Stoica, I.: Graphx: Graph processing in a distributed dataflow framework. OSDI.14, 599– 613 (2014)
37. Junghanns, M., Petermann, A., G´omez, K., Rahm, E.: Gradoop: Scalable graph data management and analytics with hadoop. arXiv preprint arXiv:1506.00548 (2015)
in Who-calls-Whom Social Networks
Ciprian-Octavian Truic˘a1(B), Olivera Novovi´c2, Sanja Brdar2, and Apostolos N. Papadopoulos3
1
Computer Science and Engineering Department, Faculty of Automatic Control and Computers, University Politehnica of Bucharest, Bucharest, Romania
BioSense Institute, University of Novi Sad, Novi Sad, Serbia [email protected],[email protected]
3
Department of Informatics, Aristotle University of Thessaloniki, Thessaloniki, Greece
Abstract. Mobile phone service providers collect large volumes of data all over the globe. Taking into account that significant information is recorded in these datasets, there is a great potential for knowledge discov-ery. Since the processing pipeline contains several important steps, like data preparation, transformation, knowledge discovery, a holistic app-roach is required in order to avoid costly ETL operations across different heterogeneous systems. In this work, we present a design and implemen-tation of knowledge discovery from CDR mobile phone data, using the Apache Spark distributed engine. We focus on the community detec-tion problem which is extremely challenging and it has many practical applications. We have used Apache Spark with theLouvaincommunity detection algorithm using a cluster of machines, to study the scalability and efficiency of the proposed methodology. The experimental evaluation is based on real-world mobile phone data.
Keywords: Data mining
·
Big data analytics·
Community detection1
Introduction
Mobile phone service providers collect large amount of data to monitor user interactions. Each time a user is using a mobile device (for sending an SMS or performing a call), a Call Detail Record (CDR) is created in the database of the service provider. Graphs have a central role in the analysis of mobile phone data collected by service providers. Due to their mathematical formalism and the variety of existing graph-based algorithmic techniques, they can be used efficiently and effectively in social networks, to solve specific problems.
C.-O. Truic˘a and O. Novovi´c contributed equally to this work. c
Springer Nature Switzerland AG 2018
Graph mining is a heavily active research direction with numerous appli-cations [1]. One of the core research directions in the area is the discovery of meaningful communities in a large network [11]. In the majority of real-life applications, graphs are extremely sparse usually following power-law degree distribution. However, the original graph may contain groups of vertices, called communities, where vertices in the same community are more well-connected than vertices across communities.
The efficiency of community detection algorithms is heavily dependent on the size of the input graph, i.e., the number of vertices and/or the number of edges, and also on its structural complexity. In addition to the main processing task that must be performed, preprocessing is also a significant step that in many cases is computationally intensive. To handle both preprocessing and main processing efficiently, a potential solution is to use multiple resources and apply parallel or distributed computing techniques, aiming at reducing the overall processing time.
In this work, we focus on the analysis of real world CDR data, and more specifically on scalable community detection. CDRs are in general large in vol-ume, and therefore scalable algorithmic techniques are required. In particular, we demonstrate the use of Apache Hadoop [26], Apache YARN [30], Apache Spark [15], and Apache Hive [28] in the mining process as a proof of concept.
In our previous work [20], we had used a conventional DBMS and Python to extract knowledge from raw telecom data. The experiments were very time consuming and we could analyze only a subset of the data in due time. The results that we obtained have motivated us to apply different processing techniques in order to speed up the experimental evaluation and to be able to analyze the complete dataset.
2
Related Work
During the last few years, there is a tremendous growth of new applications that are based on the analysis of mobile phone data [6]. Among them there are many applications with significant societal impact such as, urban sensing and planning [5,10], traffic engineering [2,14], predicting energy consumption [8], dis-aster management [18,22,33], epidemiology [9,17,32], deriving socio-economical indicators [21,27].
To enable development and run of applications and services on such data, current efforts are directed toward providing access to these large scale human behavioral data in a privacy-preserving manner. Recent initiative of Open Algo-rithms (OPAL) has suggested approach of moving the algorithm to the data [16]. In this model, raw data are never exposed to outside parties, only vetted algo-rithms run on telecom companies’ servers. This poses huge challenge on efficient processing of data, especially when array of parties is interested in extracting information and getting insights from data.
A significant graph mining task with important applications is the discovery of meaningful communities [11]. In many cases, community detection is solved by using graph clustering algorithms. However, a major limitation of graph clus-tering algorithms is that they are computationally intensive, and therefore their performance deteriorate rapidly, as we increase the size of the data.
An algorithm that has been used for community detection in large networks is the Louvainalgorithm, proposed in [7]. This algorithm has many practical applications and it scales well with the size of the data. Moreover, it has been used in several studies related to static or evolving community detection [3].
In this work, we combine the efficiency of theLouvainalgorithm with the power of the Apache Spark distributed engine, to demonstrate that we can sup-port the full pipeline of community detection in a efficient manner.
3
Proposed Methodology
In this section, we describe our approach in detail, explaining the algorithms for community detection and filtering as well as the evaluation methods used.
3.1 Graph Mining and Community Detection
the algorithms used must be flexible enough to be able to infer the number of communities during the course of the algorithm.
To meet the aforementioned requirements, we have chosen to apply a modularity-based algorithm proposed in [7]. The concept of modularity [19] pre-sented by Eq. (1), is used to estimate the quality of the partitions, where Aij is the weight of the edge connecting the i-th and the j-th node of the graph,
jAij is the sum of the weights of the edges attached to thei-th node,ci is the community where thei-th node is assigned to, m= (1/2)
i,jAij, andδ(x, y) is zero if nodesxandy are assigned to the same community and 1 otherwise.
Q= 1
Unfortunately, computing communities based on the maximization of the modularity, is anN P-hard problem. To provide an efficient solution, the algo-rithm proposed in [7] uses an iterative process that involves shrinking the graph, every time modularity converges. In each phase, each node is assigned to a neighboring community that maximizes the modularity of the graph. As long as nodes are moving around communities and modularity grows, we keep on executing this process. When there are no more changes, a shrinking process is executed. Upon shrinking the graph, each community produced during the previous phase is assigned to the same super node of the new graph. Then, the same technique is applied to the new graph. The algorithm terminates when the modularity detected in the new graph is less than the modularity detected in the previous graph. The set of communities that maximize the modularity is returned as an answer. The outline of the technique is depicted in Algorithm1. The network we are studying is undirected and weighted, but elimination of some edges by simple thresholding the weight values is not going to reveal the core backbone of the network. Moreover, we needed a method for graph filtering that will consider local properties of the nodes, such as weight over all edges linked to specific node. To meet the aforementioned requirements we have chosen to apply the disparity filter [25]. The disparity filter uses the null model to define significant links, where the null hypothesis states that weighted connections of the observed node are produced by a random assignment from a uniform distribution. The disparity filter proceeds by identifying strong and weak links for each node. The discrimination is done by calculating for each edge the probabilityαijthat its normalized weightpijis compatible with the null hypothesis. All the links withαij < αreject the null hypothesis. The statistically relevant edges will be those whose weights satisfy the Eq. (2).
αij = 1−(n−1) pij
0
(1−x)n−2dx < α (2)
Algorithm 1.Louvain(G(V, E))
Input:the graphG
Result:the communities ofG
1 n← |V|/* number of graph nodes */ 2 done←f alse
3 whilenot donedo
4 assign eachu∈V to a different community 5 whilethere is a change do
6 forevery nodeu∈V do
7 C←a community that maximizes modularity/*C is a
neighboring community or u’s community */
8 if newModularity >oldModularity then
9 G←shrink graph based on communities/* each community
becomes a super node in the new graph */
10 else
11 returncommunities
with small significance focusing on more relevant edges. The αij represent the statistical probability, so it’s value is in range [0, 1]. The threshold alpha value is set in regards to the significance level with which we want to apply the filtering. In our experiments, we applied three different filtering levels with probability 95%, 99% and 99.9%, where corresponding α values are 0.05, 0.01 and 0.001 respectively.
3.2 Clustering Evaluation Methods
To evaluate the community detection, we will use classical cluster evaluation methods, i.e. Purity, Entropy, Rand Index and Adjusted Rand Index.
The Purity (Definition1) of a cluster measures the extent to which each cluster contains elements from primarily one class [34].
Definition 1 (Purity). Given a set S of size nand a set of cluster C of size
k, then, for a clusterci∈Cof sizeki, the purity isp(ci) = maxi(n i j)
ki , wheren i j is
the number of elements of thej-th class assigned to the i-th cluster. The overall purity is defined as P(C) =ki=1kin ·p(ci).
Entropy(Definition2) is an evaluation method that assumes that all elements of a set have the same probability of being picked and, by choosing an element at random, the probability of this element to be in a cluster can be computed [31].
clusterci∈C of size ki isp(ci) = ki
n. Then, the overall entropy associated with C isH(C) =−ki=1p(ci)·log2(p(ci)).
TheRand Index (RI)(Definition3) is a measure used to determine the sim-ilarity between two data clusterings [23].
Definition 3 (Rand Index). Given a set S = {s1, s2, ..., sn} of n elements
Adjusted Rand Index (ARI)(Definition4) is a cluster evaluation method that calculates the fraction of correctly classified (respectively misclassified) elements to all elements by assuming a generalized hypergeometric distribution as null hypothesis [31]. ARI is the normalized difference of the Rand Index and its expected value under the null hypothesis [29]. ARI uses the contingency table.
Definition 4 (Adjusted Rand Index). Given a setS ofnelements and two groupingsX ={X1, X2, ..., Xr}andY ={Y1, Y2, ..., Ys}, the overlap betweenX
and Y, can be summarized in a contingency table[nij], where nij =|Xi∩Yj|,
ai = sj=1nij and bj = ri=1nij. Using the contingency table, the Adjusted Rand Index is defined in Eq.(3).
Telecommunication interaction between mobile phone users is managed by Radio Base Stations (RBS) that are assigned by the operator. Every RBS has aunique id, alocationand acoverage mapthat provides approximate user’s geographical location. CDRs contain the time of the interaction and the RBS which han-dled it. In available data collection CDRs are spatially aggregated on the grid containing 10,000 cells and temporally aggregated on time slots of ten minutes. Evidently, the final network is composed of 10,000 nodes. However, if we change the granularity and the level of the detail as well as the geographical area that we are interested in, the number of nodes can grow easily to millions.
obtain graphs with fewer edges. We are using these graphs to demonstrate the performance of community detection as we grow the number of edges in the input graph.
The dataset (C) provides real world information regarding the directional interaction strength (DIS) based on call exchanged between different areas of the city of Milan [4] and it’s publicly available online1. TheDIS between two areas (SID1 andSID2) is proportional to the number of calls issued from area SID1 to areaSID2. The temporal values, given as a timestamp, are aggregated in time slots which represent the beginning of the interval. The dataset represents a directed graph. For our experiments, two transformations are applied on the original corpus: (i) the directed graph is transformed into an undirected graph, i.e. the edges (SIDi,SIDj) and (SIDj,SIDi) are going to be represented as a single edge (SIDi,SIDj) with the edgeCostij =DISij +DISji for the same timestamp, and (ii) the timestamp is aggregated to a calendar date (Date), i.e. for an edge (SIDi, SIDj) for each Date the cost is Cost = DISij. Using this information we compute for each edge the parameter αij using Eq. (2). Moreover, an Edge Cost Factor (ECF) is used to normalize the values for the edges’Cost∈[9·10−13,466] when applyingLouvain. This information is stored in a Hive database installed on top of Hadoop’s HDFS and MapReduce. Figure1 presents the database diagram where the information about edges is stored in the Edges (E) table, while the information about communities is stored in the Louvain (L) table, whereLevel is the algorithm’s iterations.
Fig. 1.The Hive database schema.
4.2 System Architecture
Apache Spark is a unified distributed engine with a rich and powerful APIs for different programming languages [15], i.e. Scala, Python, Java and R. One of its main characteristics is that (in contrast to Hadoop MapReduce) it exploits main memory as much as possible, being able to persist data across rounds to avoid unnecessary I/O operations. Spark jobs are executed based on a master-slave model in cooperation with the cluster manager YARN.
1
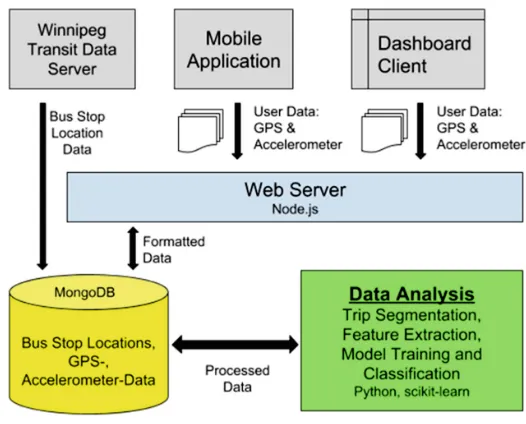
The proposed architecture is based on the Apache Spark engine using the Scala programming language together with the Spark Dataframes, HiveContext and GraphX libraries. The information is stored in an Apache Hive database which is installed on top of HDFS. The cluster resource manager used is YARN. Our methodology utilizes the following pipeline (Fig.2):
1. CDRs are aggregated in such a way that each graph node corresponds to a spatial area. This task has been performed by the mobile operator before releasing the data.
2. The original directed graph is aggregated to obtain an undirected one, as the orientation of edges is ignored in our case.
3. Filtering is applied in order to sparsify the network.
4. Community detection is applied using theLouvainalgorithm. 5. Visualization is applied.
Fig. 2.Architecture
4.3 Queries
The Table of Edges.To create the edges (E), theDISfor attributesDAT E, SID1 andSID2, which represent a compound primary key that uniquely iden-tify each record, is aggregated. The aggregation constructs an undirected graph using the union between the records where SID1≤SID2 andSID1> SID2. The resulting graph is stored in the Hive database. The following query, expressed in relational algebra, is used to populate theEdgestable:
E=ρCost
F0 (πDate,SID1,SID2,F0(γL0(πDate,SID1,SID2,DIS(σSID1≤SID2(C)) πDate,SID2,SID1,DIS(σSID1>SID2(C)))))
DISfor all the pairs (Date, SID1, SID2) andG0= (Date, SID1, SID2) is the list of attributes in the GROUP BY clause.
Strong and Weak Ties. To determine the strong and weak ties for filtering,αij from Eq. (2) is computed for each unique key (Date, SID1, SID2). Therefore, the integral must be solved in order to use directly the information stored in the database and to improve the time performance:α= 1−(k−1)·pij query, given in relational algebra, is used:
R1=ρΣc
F1(πDate,SID1,F1(γL1(σSID1=SID2(E))))
where γL1 is the aggregation operator with L1 = (F1, G1),F1 =sum(Cost) =
c, the sum is the aggregation function that sums the Cost for all the pairs (Date, SID1), and G1 = (Date, SID1) is the list of attributes in the GROUP BY clause.
The following query is used to compute the number of distinct nodes for each Date:
R2=ρN
F2(πDate,SID1,F2(γL2(E)))
where γL2 is the aggregation operator with L2 = (F2, G2), F2 = count(DISTINCT SID1)=N, the count is the aggregation function that counts the distinct number of nodes for aDateandG2= (Date) is the list of attributes in the GROUP BY clause.
To compute αij, R1 must be joined with R2. The result is stored in the database either as a separate table or by updating the Edges’s table column Alpha. The query expressed in relational algebra is:
A=πDate,SID1,SID2,Cost,Alpha(σSID1=SID2(E)⊲⊳θR1⊲⊳E.Date=R2.DateR2) The θ condition in the first join operator is defined as: E.Date = R1.Date∧
E.SID1 =R1.SID1.
Community Detection. To apply the Louvain algorithm and detect com-munities for a given date (pDate) and alpha threshold (pAlpha), the following query is used to extract the information from the database:
LM =πSID1,SID2,Cost(σDate=pDate∧Alpha≤pAlpha(A))
TheLouvainalgorithm is implemented in the Spark engine using the Scala programming language and the GraphX, Dataframes and HiveContext library. Our implementation extends an existing implementation2 so that it works with our architecture. In order to apply Louvain, a graph should be given in the input, i.e., using the queryLM. The result of the algorithm is stored in the Hive database in table Louvain.
2
5
Performance Evaluation
The goal of the evaluation is to demonstrate the performance of community detection with and without filtering, using Apache Spark. Two diverse systems have been used: (i) a multi core server machine running CentOS with 16 Intel Xeon E5-2623 CPUs with 4 cores at 2.60 GHz, 126 GB RAM and 1 TB HDD, and (ii) a cluster with 6 nodes running Ubuntu 16.04×64, each with 1 Intel Core i7-4790S CPU with 8 cores at 3.20 GHz, 16 GB RAM and 500 GB HDD. The Hadoop ecosystem is running on Ambari and has the following configuration for the 6 nodes: 1 node acts as HDFS NameNode and SecondaryName Node, YARN ResourceManager, and Hive Metastore and 5 nodes, each acting as HDFS DataNodes, YARN NodeManagers, Spark Client, and Hive Client.
For the experiments we fix the number of Spark executors to 16 with one vnode and 3 GB memory each. The same settings have been used in both the Single Machine and Cluster Mode. The complete pipeline has been implemented in Scala, whereas the code is publicly available on GitHub3.
5.1 Runtime Evaluation
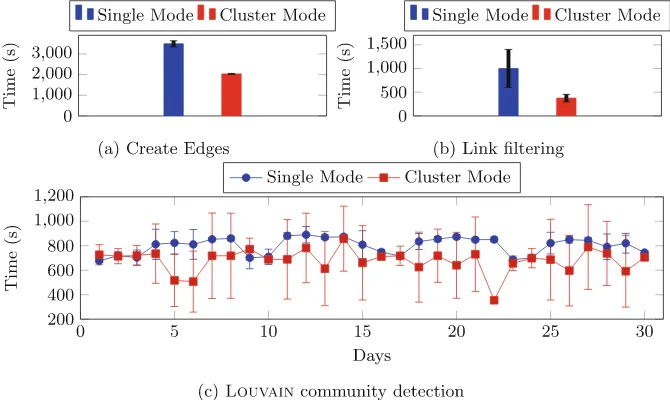
The first experiment measures the performance of edge generation from raw data. The second experiment measures the performance of computingαvalues (see Eq. (2)). The third experiment is related to the performance of Louvain algorithm over a filtered graph whereα= 0.05 andECF = 1,000,000.
For each experiment we measure the average runtime over a series of 10 runs. For the first task (creating edges), the cluster environment showed 42% better runtime than the single mode case, whereas the standard deviation is relatively small in both cases. For the task related to computingα values, the cluster showed again better performance, since the computation is 63% faster. In this case, the standard deviation is higher for both environments in compari-son to the previous task. Finally, the performance of community detection using Louvain differ for each graph, but in most cases the cluster showed the best performance. In most of the cases the mean values of runtime forLouvainare higher in the case of single machine, whereas the standard deviation is higher in the cluster environment. We hypothesize that these results are a direct con-sequence of how YARN’s ResourceManager schedules the ApplicationManager and NodeManager and Spark’s directed acyclic graph (DAG) execution engine optimizes the graph construction for the GraphX library. Figure3 shows some representative comparative results.
5.2 Community Detection and Evaluation
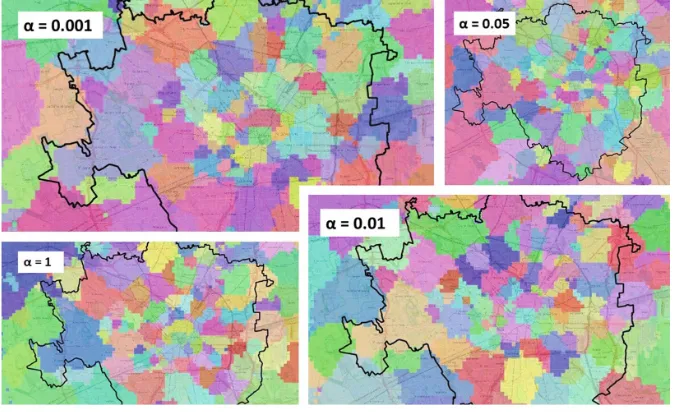
For community visualization, the QGIS software has been used. We have cho-sen to precho-sent the set of communities generated by using the 8th of November, because the network for this particular day contains the highest number of edges.
3
Fig. 3.Runtime results.
Experiments are performed on the cluster for three different threshold values, i.e., α ={0.001,0.01,0.05}, and ECF = 1012. We used the results of commu-nity detection performed over unfiltered graph as the ground truth result, and compare it with the results when the filtering was applied. After filtering is per-formed, theLouvaincommunity detection algorithm is executed on Spark. The first level of filtering eliminates more then 50% of edges, while the runtime for Louvain clustering algorithm improves with a factor of 2.46. When α= 0.01 almost 70% of edges are eliminated, and the algorithm runtime improves with a factor of 3.7. Filtering withα= 0.001 eliminates almost 80% of the edges, the algorithm’s runtime improves by a factor of 6.88.
Table 1. Number of nodes and edges after applying different filtering levels, number of communities and runtime community detection.
α # nodes # edges # communities Time (sec.)
1 10,000 29,099,392 175 2,229.73±340.14 0.05 10,000 12,942,551 174 906.43±279.79 0.01 10,000 9,003,404 176 603.20±174.28 0.001 10,000 6,043,769 186 324.21±127.73