Approximating Urban Wind Interference
Samuel Wilkinson, Gwyneth Bradbury, and Sean Hanna
University College London 14 Upper Woburn Place
London, WC1H 0NN
[email protected] [email protected]
Keywords: Computational Fluid Dynamics (CFD), Generative Design, Machine Learning Approximation, Urban Wind Interference, Tall Buildings.
Abstract
A new approach is demonstrated to approximate computational fluid dynamics (CFD) in urban tall building design contexts with complex wind interference. This is achieved by training an artificial neural network (ANN) on local shape and fluid features to return surface pressure on test model meshes of complex forms. This is as opposed to the use of global model parameters and Interference Factors (IF) commonly found in previous work. The ANN is trained using shape and fluid features extracted from a set of evaluated principal (design) models (PMs). The regression function is then used to predict results based on shape features from the PM and fluid features from a one-off obstruction model (OM), context only, simulation. For the application of early-stage generative design, the errors (against CFD validation) are less than 10% centred standard deviation σ, whilst the front-end prediction times for the test cases are around 20s (up to 500 times faster than the CFD).
INTRODUCTION
CFD analysis in architectural design typically involves response times that are obstructive to the fast iterations of contemporary generative practice. In this parametric paradigm, architects can easily generate immense numbers of alternative scenarios but are then faced with the time-consuming task of evaluation and selection. One earlier solution focusses on early-stage design of tall buildings, using pre-computed procedural model sets, local morphological shape features, and machine learning via an artificial neural network (Wilkinson et al. 2013). It was shown that significantly faster prediction times can be
achieved whilst minimising approximation errors to task-appropriate levels.
A limitation of this previous work, however, was the exclusion of surrounding context. That is, the approach treated the buildings in isolation, with unrealistically simplistic boundary conditions. In this work, the morphological features are extended with local fluid properties (upstream wind speed) to support complex urban scenarios. This is achieved by effectively superimposing an isolated building prediction of an infinitely variable generative model onto the surrounding conditions (a one-off, context-only simulation.
Many attempts have been made to approximate or generalise this kind of complex wind interference, i.e. the effect of multiple buildings in the domain (see Table 1). However, all have relied on a top-down problem definition in relating the position of identical surrounding building cuboids with a global Interference Factor (IF) for the design building. The new approach seeks to improve this significantly by: (i) allowing surrounding context of any degree of complexity; and (ii) giving vertex-level resolution rather than global effect factors. A background review, general methodology, and experimental results for two test case complexities are presented in this paper, alongside a discussion on speed and accuracy.
Performative Generative Design
for structural or façade aerodynamics, pedestrian comfort, or pollution dispersal).
Air movement, predicted through CFD, suffers the most from restrictive response times, predominantly because of the historical focus on accuracy rather than speed (due to low-tolerance high-risk scenarios in aircraft and spacecraft engineering). Arguably, the margins for acceptable error are more tolerant in building design, meaning that the simulation accuracy requirements can be relaxed or traded off for speed improvements (particularly at early design stages).
In these early stages of light-weight (fast and less-accurate) performance feedback, there can be more allowance for design exploration and optimisation. This is supported by the idea of speed-accuracy trade-offs (SATs, Chittka et al. 2009), which suggests that for low-risk problems, it is often better to make faster, less accurate decisions. In other words, in the scope of the larger problem of building design, it is better to have a broader perspective on the performance variability rather than an extremely accurate but narrow perspective on fewer cases.
LITERATURE REVIEW
The background review will cover various methods for approximative CFD, and the state of urban wind interference with machine learning. The intention is to highlight a gap in the research, specifically on approaches to CFD approximation and interference generalisation that do not rely on global parameters or over-simplification.
Approximating Computational Fluid Dynamics
CFD is one of the most intensive and time-consuming simulations in the performance assessment of tall building design. Specifically for wind analysis, it is of great accurate CFD simulation is better invested at later stages. It is therefore prudent to consider compromises in the speed-accuracy trade-off, sacrificing speed-accuracy for speed, during these early stages so that many more design options can be explored. The need for application-specific simulation accuracy and speed that meets the demands of early design stages is proposed by Lu et al. (1991). They generate a
range of reduced-order models of a combustion engine simulation, with varying accuracies and speed that can be used throughout the design process. The solution is posed as a Pareto front of non-dominated solutions, rather than a simpler trade-off curve based on biological decision making (Chittka et al., 2009).
Most approaches towards CFD approximation focus on simplification of the solver itself. For instance: simplified meshing routines; the use of lower-order discretisation; particle-based solvers; or the avoidance of turbulence models. These methods can be classed as type-one, solver approximation.
A typical example of this is the use of the 'Stable Fluids' fast fluid dynamics (FFD) solver developed by Stam (1999) for the computer graphics and games industry, which subsequently underwent some development for use in architectural practice (Chronis et al. 2011, 2012). Development and application for architectural design was motivated by three factors: a limited, low Reynolds number validation which suggested it as suitable for purposes beyond the scope of the validation (Zuo and Chen 2009, 2010); the qualitative appearance of accuracy for turbulent flows; and its remarkable speed. Zuo and Chen (2009) implemented the FFD with a zero-equation turbulence model but found that it performed worse since it was not designed or suited to the FFD approach. It should be noted, however, that with a lack of turbulence model, the solver relies on continuous interaction (such as game character movement) to compensate for numerical dissipation. The benefit is the availability of full fluid field data, although production of surface data is more difficult.
One other possible approach to this problem, type-two, is solution approximation. CFD originated in aeronautics and astronautics, as such there is a large quantity of work directed towards modelling and optimisation of airfoils, fuselages, and turbine blades. An optimisation routine will often generate large data sets of simulation data, from which knowledge of the problem can be extracted.
Graening (2009) extend this work further to incorporate an training an ANN on shape features extracted from a set of evaluated procedural tall building models.
Interference
Interference refers to the increased or decreased effect that nearby buildings may have upon the wind behaviour of one another. Within an urban situation this is very common, and since the effects can be significant it is necessary to consider the context within the simulation. That is, independently designed buildings can not be treated in isolation. Along with the large research fields of bluff bodies and computational wind engineering, interference is also a significant area of study. Research on interference is especially concerned with creating generalised recommendations, a difficult issue due to the huge variation in potential scenarios.
A common misconception is that interference always reduces wind loads from the isolated case. Whilst this may be true for a uniformed array of similar buildings in close proximity, wind loads can be increased in the more complex, realistic case. The key factors in determining the effects of interference are the size, shape, and configuration of the buildings with respect to the direction of flow. The effects have been shown to be as great as up to 46% under-prediction and 525% over-under-prediction from regulatory loads on simple prismatic buildings (Stathopoulos 1984). An over-prediction of wind pressure is less dangerous than an under-prediction, since the latter may cause comfort or safety issues. Khanduri et al. (1998) present a thorough review of the full past and present state of interference. A summary of typical studies can be found in Table 1.
In all the cases shown in Table 1, simple cuboids were used with typical variables such as aspect ratio and position configuration. In other words, translating the objects over the two-dimensional horizontal plane. No studies have been performed which consider realistically complex shapes or
contexts because the knowledge attained in evaluating them is typically esoteric and difficult to generalise.
A number of studies have, however, analysed the effects of a small number of adjacent structures, leading to the development of the Interference Factor (IF). This is a ratio between the wind loads with and without the interference from adjacent structures (see Table 1). In a few cases generalisation, or regression, has been attempted (the last three cases in Table 1) with the IF used as output response and basic scenario parameters as input features.
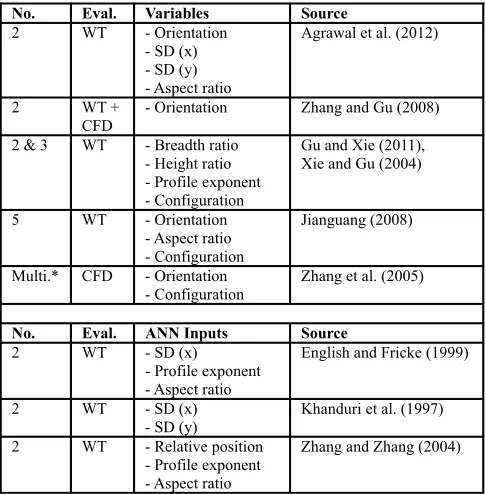
No. Eval. Variables Source
Table 1: Summary of selected interference sensitivity studies (No. = Number of surrounding buildings in study, WT = Wind-Tunnel, SD = Separation Distance, x = along-wind, y = across-wind). * Multiple cuboids in a small number of configurations.
METHODOLOGY
The approach taken here is towards performance prediction of wind-induced surface pressure from shape analysis, developing previous work on morphological prediction (Wilkinson et al. 2013). It has previously been shown that it is possible, with a reasonable degree of accuracy and speed, to predict surface pressure for early-stage tall building design. The limitation of their work was that the models were treated in isolation without any urban context or interference: a simplification which is addressed here.
Considerable time and effort can be saved if it can be demonstrated that independent CFD simulations can be 'super-imposed' on one another with a reasonable accuracy. The end goal is to use a single, 'context-only' simulation, the
Obstruction Model (OM), to make a limitless number of predictions for different designs, Principal Models (PM), using the fluid field data alone. The clear advantage of this is that the entire OM does not need to be re-run with every change of PM.
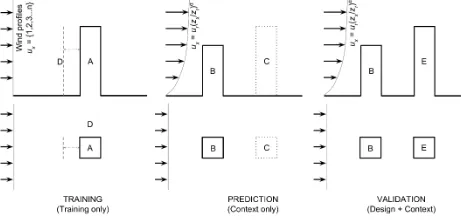
Figure 1: Local fluid features general method. (top) elevation view, (bottom) plan – (left) Training, A=Training model (in this case = PM), D=A projected upstream; (centre) Prediction, B=OM, C=Location of PM in field; (right) Validation, B=OM, E=PM.
The simulation of a complex urban wind environment without the PM is used as input feature for predictions on the PM in context. This is done by simulating the isolated PM under a variety of different wind speeds, and using the shape and fluid features to train an ANN and make predictions for the PM using the context-only model. The advantages of this method are in avoiding simulation of the full PM-in-context model and being able to use an existing context model to make predictions on a new PM. However, it is noted that in order to generalise this method to arbitrary PMs, a much greater training set would be required.
Simulation Methodology
The CFD solver used for the steady-state Reynolds-Averaged Navier-Stokes (RANS) simulations with a k-ε turbulence model is ANSYS CFX 13.0. Typically the models are meshed with roughly an equal number of cells (up to the maximum available computational resources), of around four million elements. The PM simulations, for the training set, therefore have a finer resolution than the OM used as the test case. The models themselves are created in Bentley's GenerativeComponents.
The following simulation parameters were assigned: high-resolution advection and turbulence numerics; isothermal fluid at 25ºC; a scalable wall function; a convergence residual target of 1.0e-6 RMS; and a minimum
mesh edge size of 0.3m. With these parameters, the simulations take 30±10 minutes to converge to steady-state. A transient large eddy simulation (LES) could alternatively be used instead of RANS to achieve more accurate and time-dependent surface pressures. However, due to time and resource limitations it was not possible to include a comparison in this study.
In both test cases, the wind speed is applied at an upstream inlet, with a reference speed (Ur) of 10ms−1 at a reference height (Zr) of 10m. The most commonly used distribution of mean wind speed with height is the 'power-law' expression:
Ux = Ur ( Zx / Zr ) α
The exponent α is an empirically derived coefficient that is dependent on the stability of the atmosphere. For neutral stability conditions it is approximately 0.143, and is appropriate for open-surroundings such as open water or landscape (Hsu et al., 1994). In the training models a constant wind profile is used, albeit with varying speeds, so as to generate a range of upstream wind speeds for every vertex.
Learning Methodology
In all cases, the learning process consists of a training and a test set of features. For a training set, STr, consisting of
vertex feature vectors and simulated pressure extracted from the CFD, the ANN approximates the function fANN:X → P where X is the vertex feature vector and P is the vertex
pressure. X is defined as follows:
Where Vupstream is the wind speed at the vertex's projected position upstream at a distance of 20m (approximately midway between PM and upstream OM), Nx,y,z are the vertex
normal components, Nσ1-5
x,y,z are the vertex-ring (one
through five) neighbourhood curvature (non-absolute) standard deviation components, and Tx,y,z are the normalised vertex position within the model limits. For the test prediction, Vupstream is replaced by V, the wind speed at the vertex's position on the PM but measured in the OM fluid field.
From the 15 training set models that have been evaluated with various wind speeds, a total of 210,000 vertex features are extracted (14,000 per model), from which 10,000 are randomly selected for training the model. This number is sufficient for convergence of the ANN. An ANN with a non-linear RBF activation function is used, with a network structure of 22:20:1, i.e. 22 inputs in the feature vector, X, 20 neurons in the hidden layer, and one output response, Y. The error is calculated as:
% Diff. = (Pprediction - Psimulation) / (Psimulation range) * 100
The errors, or difference between the predicted and simulated model pressures, are reported as: the range's minimum and maximum; the mean of the absolute errors; and the standard deviation of the absolute errors (see Table 2). For both cases, a kernel density estimation is given which gives a continuous error density estimation. The smoothing kernels use a normal distribution and width of 0.1%.
RESULTS
There are two experimental cases: the first of simple geometric complexity, perhaps at the level of what may be found in the literature; and the second, of a real context and design case as might be found in practice.
Multiple Cuboid Context and Design
In the first case, five surrounding cubic buildings constitute the OM, with the PM at the centre. As training data, the PM is run independently with different wind speeds (1, 2, …, 15ms-1) without any wind profile. The shape and fluid features are extracted from each of these models and used in the training set. The OM is also run, and the fluid features extracted from the appropriate positions to use as test features. Finally, the surface pressures on the PM are extracted from the full model for validation. The
geometric setup of the full design and context (validation) model is shown in Figure 2. Context buildings, OM, are labelled as A and design building, PM, as B.
Figure 2: Case 1 – validation model setup: (left) perspective; (centre) elevation; and (right) plan views with respective wind profiles.
For each feature, or vertex, in the PM test case, the difference in pressure between the prediction and simulation is calculated. It is seen to converge with a mean absolute error of 6.73%, a standard deviation absolute of 4.02%, a maximum error of 33.76%, and a minimum of -26.37%. The distribution of prediction errors is shown by the kernel density estimation in Figure 3, giving a continuous error probability estimation (see Table 2 for percentiles).
Figure 3: Case 1 – kernel density estimation of errors.
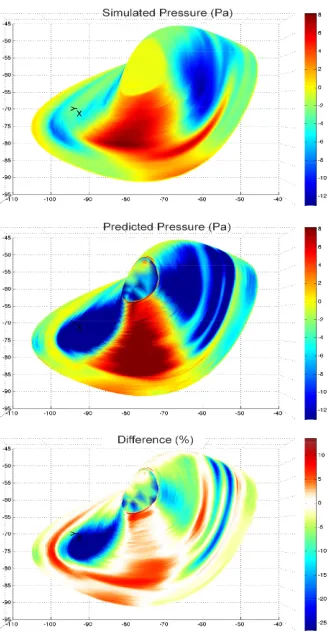
The difference between prediction and simulation is visualised in Figure 4: on the left is the surface pressure on the design model in the full context validation simulation; the centre is the predicted surface pressure; and on the right is the vertices % pressure difference between the two.
Considering the complexity of the problem, this is a solid first step towards interference approximation in tall building design. The majority of the errors are less than 10 to 15% and the general pressure distribution is qualitatively correct, suggesting that the method has application in situations where accuracy can be compromised in order to facilitate rapid feedback.
Realistic Context and Design
In the second case, a realistic context model, the OM, of the dense City district in London is used (Figure 5), along with a realistic PM, design model (Figure 6), put together for the validation model (Figure 7). The PM is relatively arbitrary, but is based on prior models generated at competition, massing, or form-finding project stages. The design model is 310m tall, as compared to the upstream Swiss Re (180m) and downstream Tower 42 (183m). The wind direction is shown in Figure 8.
Figure 5: Case 2 – Context only model, OM, of the City, London. Raw geometry before simplification for meshing.
Figure 6: Case 2 – Design model, PM - wire-frame elevations and plan. Created in GenerativeComponents.
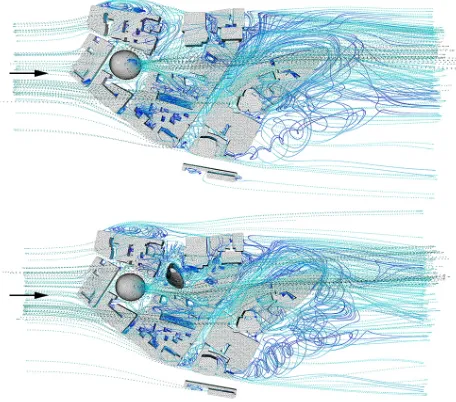
Figure 8 shows the test and validation CFD simulation results. Note that the lower image has the design model and the change in flow streamlines is visualised. It is also interesting to note that the addition of the new design model has effects on the entire flow field, upstream and downstream. It is evident that the use of a simple, global interference factor can not do justice to the change in wind environment brought on by a new tall building.
Figure 7: Case 2 – validation model setup. After simplification for meshing. Detail resolution greater than 1m.
Figure 8: Case 2 – CFD simulation, streamline visualisation: (upper) context only for test data; (lower) context and design for validation.
The errors converge to a mean absolute of 5.80%, with a standard deviation of 9.01%, a maximum error of 11.99%, and a minimum of -55.71%. The distribution of prediction errors is shown by the kernel density estimation in Figure 9, giving a continuous distribution.
Figure 9: Case 2 – kernel density estimation of errors.
prediction, and the lower the % difference between the simulated and predicted pressures.
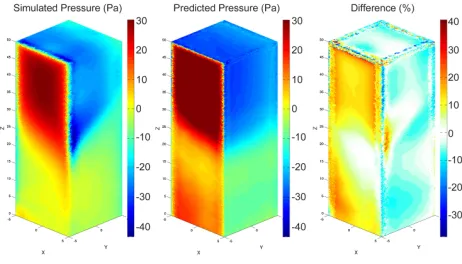
Figure 10: Case 2 – Design model in full context, plan view. (upper) Simulation; (centre) Prediction; (lower) Difference.
Figure 11: Case 2 – Design model in full context. (left) Simulation; (centre) Prediction; (right) Difference.
DISCUSSION
Compared to solver approximation techniques, such as the FFD solver and other low accuracy simulations, this solution approximation has the benefit of being based on a
widely-used, validated CFD solver. In fact, it may be feasible to use a solver of any accuracy (such as LES or DNS, where the time improvements will be even greater). The comparative disadvantage is that the FFD can produce field rather than surface data which is useful for identifying flow patterns, assessing pedestrian comfort, and to gauge the secondary downstream effects that a new building will have on others.
These developments represent an alternative approach that is fundamentally different to previous attempts at interference generalisation found in the literature. The use of local features rather than global parameters allows for arbitrary complexity in the obstruction model and for vertex surface pressure visualisation rather than the global interference factor.
Response Times versus Accuracy
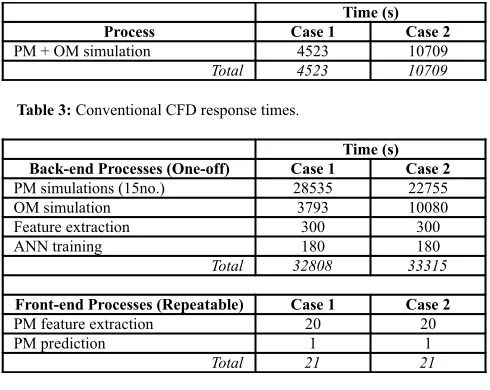
The errors are summarised in Table 2, and the process times for both cases and for the conventional and new approaches are given in Tables 3 and 4 respectively. Whilst the response times for the new method are approximately seven (case 1) and three (case 2) times greater than the conventional method, the true benefits are with repeatability. Therefore, in separating out the processes into front-end and back-end, the new method becomes 215 (case 1) and 510 (case 2) times faster.
CONCLUSION
The methodology and results presented here demonstrate an alternative approach to urban wind interference approximation for tall building design. Through the two cases it is demonstrated that significant improvements in response time (215 and 510 times faster when comparing front-end prediction times with conventional CFD) can be made with a reasonable trade-off in accuracy (mean absolute errors of 5.8 to 6.7%) . Further improvements and generalisation can be made through the use of a procedural model to generate the training shape features, as well as through further testing on alternative models and optimisation of the training and test features.
Case 1 Case 2
Min. / Max. range (%) * -26.37 / 33.76 -55.71 / 11.99
Mean absolute (%) 6.73 5.80
Standard deviation absolute (%) 4.02 9.01
Time (s)
Process Case 1 Case 2
PM + OM simulation 4523 10709
Total 4523 10709
Table 3: Conventional CFD response times.
Time (s)
Back-end Processes (One-off) Case 1 Case 2
PM simulations (15no.) 28535 22755
OM simulation 3793 10080
Feature extraction 300 300
ANN training 180 180
Total 32808 33315
Front-end Processes (Repeatable) Case 1 Case 2
PM feature extraction 20 20
PM prediction 1 1
Total 21 21
Table 4: Proposed methodology response times.
Acknowledgements Interference Effects on Tall Buildings. In National Conference on Wind Engineering, India. pp. 193–204.
CHITTKA, L., SKORUPSKO, P. AND RAINE, N.E. 2009. Speed-Accuracy Tradeoffs in Animal Decision Making. Trends in Ecology and Evolution, 24(7), pp.400–7.
CHRONIS, A., TURNER, A. AND TSIGKARI, M. 2011. Generative Fluid Dynamics: Integration of Fast Fluid Dynamics and Genetic Algorithms for wind loading optimization of a free form surface. In SimAud 2011. pp. 79–86.
CHRONIS, A., TSIGKARI, M., DAVID, A. AND AISH, F. 2012. Design Systems, Ecology and Time. In ACADIA conference proceedings.
ENGLISH, E.C. AND FRICKE, F.R. 1999. The Interference Index and its
Power-Law Wind-Profile Exponent under Near-Neutral Stability Conditions at Sea. Journal of Applied Meteorology, 33(6), pp.757-772.
JIANGUANG, Z. 2008. Interference Effects on Wind Loading of a Group of Tall Buildings in Close Proximity. The University of Hong Kong.
KHANDURI, A.C., BEDARD, C. AND STATHOPOULOS, T. 1997. Modelling Wind-Induced Interference Effects using Back-Propagation Neural Networks. JWEIA, 72, pp.71–79.
KHANDURI, A.C., STATHOPOULOS, T. AND BEDARD, C. 1998. Wind-Induced Interference Effects on Buildings - A Review of the State-of-the-Art. Engineering Structures, 20(7), pp.617–630.
LU, S.C.-Y., TCHENG, D.K. AND YERRAMAREDDY, S. 1991. Integration of
Simulation, Learning and Optimization to Support Engineering Design. Annals of the CIRP, 40(1), pp.143–146.
STAM, J. 1999. Stable Fluids. Proceedings of the 26th annual conference on Computer graphics and interactive techniques.
STATHOPOULOS, T. 1984. Adverse Wind Loads on Low Buildings Due to Buffeting. Journal of Structural Engineering, 110(10), 2374–2392.
WILKINSON, S., HANNA, S., HESSELGREN, L. AND MUELLER, V. 2013.
Inductive Aerodynamics. In: STOUFFS, R. and SARIYILDIZ, S., (eds.) Proceedings of eCAADe 2013: Computation and Performance.
XIE, Z.-N. AND GU, M. 2004. Mean Interference Effects among Tall Simulations of Wind Pressures on Buildings in Staggered Arrangement. JWEIA, 96(10-11), pp.2067–2079.
ZHANG, A. AND ZHANG, L. 2004. RBF Neural Networks for the Prediction of Building Interference Effects. Computers & Structures, 82(27), pp.2333–2339.
ZUO, W. AND CHEN, Q. 2009. Real-Time or Faster-than-Real-Time Simulation of Airflow in Buildings. Indoor Air, 19(1), pp.33–44.