POSITIONAL ACCURACY ASSESSMENT OF THE OPENSTREETMAP BUILDINGS
LAYER THROUGH AUTOMATIC HOMOLOGOUS PAIRS DETECTION: THE METHOD
AND A CASE STUDY
M. A. Brovelli *, M. Minghini, M. E. Molinari, G. Zamboni
Department of Civil and Environmental Engineering, Politecnico di Milano, Como Campus, Via Valleggio 11, 22100 Como, Italy - (maria.brovelli, marco.minghini, moniaelisa.molinari, giorgio.zamboni)@polimi.it
Commission II, ThS 14 - Recent Developments in Open Data
KEY WORDS: Accuracy, Building, Open Data, OpenStreetMap, Quality, Volunteered Geographic Information
ABSTRACT:
OpenStreetMap (OSM) is currently the largest openly licensed collection of geospatial data. Being OSM increasingly exploited in a variety of applications, research has placed great attention on the assessment of its quality. This work focuses on assessing the quality of OSM buildings. While most of the studies available in literature are limited to the evaluation of OSM building completeness, this work proposes an original approach to assess the positional accuracy of OSM buildings based on comparison with a reference dataset. The comparison relies on a quasi-automated detection of homologous pairs on the two datasets. Based on the homologous pairs found, warping algorithms like e.g. affine transformations and multi-resolution splines can be applied to the OSM buildings to generate a new version having an optimal local match to the reference layer. A quality assessment of the OSM buildings of Milan Municipality (Northern Italy), having an area of about 180 km2, is then presented. After computing some measures of completeness, the algorithm based on homologous points is run using the building layer of the official vector cartography of Milan Municipality as the reference dataset. Approximately 100000 homologous points are found, which show a systematic translation of about 0.4 m on both the X and Y directions and a mean distance of about 0.8 m between the datasets. Besides its efficiency and high degree of automation, the algorithm generates a warped version of OSM buildings which, having by definition a closest match to the reference buildings, can be eventually integrated in the OSM database.
1. INTRODUCTION
OpenStreetMap (OSM) is nowadays the most popular project of Volunteered Geographic Information or VGI (Goodchild, 2007). It was born in 2004 with the only purpose of mapping streets, but its mission has later evolved into the creation of “a free, editable map of the whole world built by volunteers” (http://wiki.openstreetmap.org/wiki/About_OpenStreetMap).An increasingly higher number of people is contributing to the project, which in early 2016 counts almost two and half million registered users (http://wiki.openstreetmap.org/wiki/Stats). The database of the OSM project has thus become the largest and most diverse worldwide. It includes hundreds of geographical objects which are created and updated daily by thousands of volunteers from all over the world. OSM data creation mainly happens in three ways: through digitization of aerial or satellite imagery (remote mapping); through the upload of GPS traces or other data that was physically collected (field mapping); and through the upload of openly available datasets (bulk import). A considerable strength for the success of OSM is the open license of its database, that allows everyone to copy, distribute, transmit and adapt the data provided that credit is made to the project and its contributors (http://www.openstreetmap.org/copyright).
All those factors have increased the exploitation of OSM data as an alternative to expensive or proprietary datasets and in all the situations where no other map is available (e.g. for humanitarian applications). Interest from the academic community has grown as well (Jokar Arsanjani et al., 2015a). Research efforts have focused on a rich variety of topics including the nature, history and evolution of OSM database, OSM data quality, motivations for contributing to OSM, and interactions between contributors. Of particular interest for this paper is the research on OSM data
quality. A number of studies have been conducted so far which have assessed OSM data quality through intrinsic and extrinsic approaches. Intrinsic approaches evaluate data quality by only looking at the OSM database itself (Keßler and de Groot, 2013) or the activities of volunteers (Jokar Arsanjani et al., 2015b). On the contrary, extrinsic approaches assess OSM data quality using proprietary or third-party datasets as a reference source for comparison (e.g. Haklay, 2010; Girres and Touya, 2010). Most of the studies available in literature, as well as the present study, fall into this second category. Comparisons of OSM data against external datasets are currently favoured by the increased release of proprietary or commercial datasets, e.g. from National Mapping Agencies (NMAs), with open licenses. Nevertheless, executing these comparisons represents a typically challenging geocomputation problem, because OSM and reference datasets exist for very different purposes and derive from distinct genesis and update processes (Brovelli et al., 2016). In general, the emerging body of literature on OSM data quality shows that: a) OSM data are highly heterogeneous across the globe; and b) in some areas the quality of OSM data exceeds that of the proprietary counterparts.
The purpose of this study is to contribute to the research on OSM data quality by proposing a novel approach for assessing the positional accuracy of OSM building datasets. Exploiting an external building dataset as the reference source for comparison, the procedure is based on the detection of homologous pairs (points representing the same detail of a feature, e.g. the corner of a building, on the two datasets). This happens in an almost automated way, because the user is required a very little effort before the automated homologous detection can begin. Based on the homologous pairs detected the positional accuracy of the OSM building dataset can be measured. This is in contrast with
the vast majority of the studies available in literature, which are limited to the assessment of OSM building completeness. The approach is implemented in a graphical application, which also allows to apply warping transformations to the original OSM building dataset to derive a new version having an optimal local match to the reference building dataset. An application of this method is presented to assess the quality of the OSM building dataset of Milan Municipality (Northern Italy) by comparison against the building dataset belonging to the official vector cartography of the city.
The rest of the paper is structured as follows. First, the available literature on OSM data quality – with a special focus on OSM building datasets – is briefly recalled. This is followed by a description of the research methods and procedures used for OSM quality assessment. The results of this analysis are then presented and discussed. Finally, implications, limitations, and directions for future research are offered.
2. RELATED WORK
Earliest works on OSM quality assessment were all focused on streets, that were the initial mapping target of the OSM project. A number of studies were performed between 2010 and 2011 to evaluate different quality indicators (e.g. positional accuracy, completeness, and semantic accuracy) of road networks in UK (Haklay, 2010), France (Girres and Touya, 2010), Germany (Zielstra and Zipf, 2010), Greece (Kounadi, 2011), Ireland (Ciepluch et al., 2011) and Florida (Zielstra and Hochmair, 2011). An exception to this trend was a work by Mooney et al. (2010) who investigated the quality of OSM natural features (lakes and forests) in several European countries.
In recent years, studies on OSM road data quality were carried out in other areas of the world (Graser et al., 2014; Forghani and Al-Bakri, 2014; Antunes et al., 2015) and researches on other objects of OSM database began to appear. As an example Jackson et al. (2013) evaluated the completeness and accuracy of OSM point features related to schools in Denver. Studies on the accuracy of OSM land use features were performed by Estima and Painho (2013) and Jokar Arsanjani et al. (2015c) in Portugal and German metropolitan areas, respectively. Kalantari and La (2015) studied the completeness and accuracy of the public properties mapped in OSM for Victoria, Australia.
Finally, many authors have focused their attention on building footprints in OSM. To investigate the suitability of OSM data for the generation of 3D building models, Goetz and Zipf (2012) provided a first quantitative analysis of OSM buildings in Germany. They found that OSM covered only the 30% of the total buildings, and that only the 0.5% of these buildings were provided with information about height or number of levels. Hecht et al. (2013) evaluated OSM building completeness in North Rhine-Westphalia and Saxony (Germany) by means of a comparison against the official dataset performed through unit-based and object-unit-based methods. Overall results highlighted a low degree of completeness, which was higher in urban areas than rural areas. Fan et al. (2014) compared building datasets from OSM and ATKIS (Authority Topographic-Cartographic Information System) for Munich City (Germany) showing a high completeness of the OSM dataset but also deficiencies in the attribute availability. They also measured an average offset of 4 m between the OSM and ATKIS buildings and observed a high similarity in shape between the two datasets.
Törnros et al. (2015) assessed OSM building completeness for Ludwigshafen Municipality (Germany) comparing the OSM dataset with the dataset from the official cadastre. The authors applied two unit-based methods concluding that the measures of completeness are highly different according to the one selected.
Some suggestions are also provided to perform a more accurate estimation. In the same year, Fram et al. (2015) assessed the quality of OSM buildings in Sheffield, Leeds and London (UK) with the aim of investigating the potential of OSM data in Risk Management Solutions (RMS) applications such as natural catastrophe exposure models. The study was conducted through a comparison against the datasets from Ordnance Survey and showed that OSM building completeness is very variable both within and between UK cities. The authors also investigated whether population density can be used as a proxy variable for OSM building completeness in areas without official data, but no correlation was found between the variables. An interesting research was carried out by Klonner et al. (2015) that proposed a new approach to combine up-to-date OSM building data with the rarely up-to-date information derived from airborne laser scanner surveys to obtain a continuously updated digital surface model. To this purpose an analysis on OSM data quality was performed in the study area of Bregenz (Austria) with different methods. The intrinsic approach proposed by Barron et al. (2014) highlighted the satisfactory level of upgrade of OSM data (80% of buildings edited in the last year) and thus their suitability for the proposed application. Moreover, the applied object-based methods showed an overall high quality of OSM datasets in comparison with the official cadastral data.
3. METHODOLOGY
In this section the methods used to assess OSM building quality for Milan Municipality are presented. Subsections 3.1 and 3.2 describe the procedures for evaluating OSM completeness and positional accuracy, respectively. Both these methods make use of a grid-based approach to take into account the heterogeneous nature of OSM. In the following the reference dataset used for comparison will be indicated as REF.
3.1 Assessment of OSM building completeness
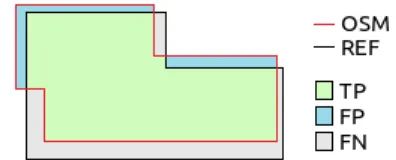
OSM building completeness is assessed by applying the area ratio unit-based method proposed by Hecht et al. (2013) which computes the completeness C as the percentage ratio between the total area of OSM buildings and the total area of REF buildings within a defined spatial unit (e.g. administrative or geometrical). To this purpose, the area of Milan Municipality is subdivided in sub-areas according to a regular grid of hexagons having an apothem of 0.5 km. The choice of this cell shape is suggested by Hecht et al. (2013) arguing that “hexagonal raster offers the advantage of more closely approximating the circle while providing the same complete coverage of the study area”. As remarked by Törnros et al. (2015), the area ratio method the overlapping building areas between OSM and REF, i.e. the areas of agreement between the datasets; the FP rate represents the OSM building areas which do not exist in the REF dataset, and the FN rate considers the REF building areas which do not exist in the OSM dataset. To assess the completeness of OSM buildings, the values of C, TP, FN and FP are computed for each cell of the hexagonal grid.
3.2 Assessment of OSM building positional accuracy
compares two maps, i.e. the visual search of the same features represented on the maps by making at the same time geometric, topological and semantic analyses. In other words, during the visual check the operator compares the shape of the features (in this case the buildings) on the two maps. This operation can be subdivided in three steps: an analysis of the positions of the points which geographically describe the objects; an analysis of the “directional” compatibility of the segments connecting the points and forming the objects; and a semantic analysis. The algorithm executes all these steps to automatically obtain the same results of a human search.
Figure 1. TP, FP and FN areas corresponding to OSM (red line) and REF (black line) buildings
Before the detection of homologous points, a raw fitting needs to be performed as the two maps may have different scales or orientations. This consists of an affine transformation, which is performed applying a least squares adjustment on five manually selected points which are more or less equidistant. For instance in the case of a rectangular map the best choice is to pick out four points at the corners and the fifth in the centre of the map. Applying this raw affine transformation, for each corner of each OSM building the algorithm selects a set of homologous candidate points from the corners of the REF buildings using a “statistical distance”. This takes into account the facts that the proximity of homologous points depends on the “quality” of the maps, and their intrinsic incompatibility is due to differences between their reference frames, survey techniques, conventions on representation of information, etc. (Brovelli and Zamboni, 2006). In a first approximation the mismatch can be numerically quantified using the estimated variance σ2 of the least squares adjustment of the affine transformation. We suppose that the lower is this estimated variance, the smaller are the distortions between the two maps and therefore the smaller should be – on the OSM map – the area around the building corners for which the algorithm has to identify the homologous points on the REF map. According to the Tchebycheff's inequality, the algorithm considers a square area centred on the OSM points with side length equal to 6σ2. Therefore the traditional geometric distance is replaced with a “statistical” one, where the metric depends on the precision of the estimated transformation model. The advantage of this approach is to have a probability index which expresses the precision and the correctness of each homologous points association.
To increase the accuracy in the choice of homologous points a “directional” analysis is also performed. For each homologous pair, the angles of all the segments outgoing from the points are compared, and the detection is validated only if the differences of all the angles are below a fixed tolerance. Starting from the coordinates of the candidate homologous points as well as the deterministic and stochastic model of least squares adjustment, the algorithm computes a variate F0, which is compared, using a fixed significance level α, with the critical value Fα of a Fisher distribution. The statistical test to accept the hypothesis H0:{P1 is homologous of P2} can be formulated as follows: if H0 is true, then F0 must be smaller than Fα with probability (1–α); otherwise H0 is false. Starting from the first set of candidate homologous points an iterative process is executed where, at each step, the parameters of the affine transformation and the
corresponding set of homologous pairs are determined. The procedure is repeated until the number of homologous points detected becomes stable.
The accuracy of the homologous points detection can be further improved using a semantic check implemented in the algorithm and based on the attributes associated to the geometries (e.g. the building type: residential, commercial, industrial, etc). Two points are considered to be homologous only if they pass the geometrical check, and if they belong to features with the same or compatible attribute (according to a corresponding table that needs to be previously defined). In the case study of Milan Municipality, as the OSM building dataset is considered to be not enough complete and accurate from the semantic point of view, the use of the semantic check is discarded.
Once the homologous points are detected the application allows users to apply a predefined set of warping transformations to the OSM dataset, in order to improve its match with the REF dataset. These are all inexact transformations, in other words they make use of a least squares adjustment to compute a new, warped version of the OSM building dataset having an optimal match to the REF dataset. The description and application of these transformations is given in Subsection 4.2.
4. RESULTS ON MILAN MUNICIPALITY
The methods described above are applied to the OSM buildings of Milan Municipality. The OSM dataset used was downloaded in January 2016. The reference dataset (REF) is the building layer of the official vector cartography of Milan Municipality, produced in 2012, having a scale of 1:1000 and a tolerance of 0.6 m. This dataset is provided as open data under the Italian Open Data License (IODL) v2.0 (Formez PA, 2012) and is available for download from the Lombardy Region Geoportal (http://www.geoportale.regione.lombardia.it). Results on OSM completeness and positional accuracy are shown in Subsections 4.1 and 4.2, respectively.
4.1 Assessment of OSM building completeness
Using the methods described in Subsection 3.1, OSM building completeness for Milan Municipality is computed on both the whole dataset and the single grid cells in order to detect local variations. Global results show that the total area of REF buildings is 9% larger than the area of OSM buildings (31.69 km2
against 28.98 km2
). The total area of TP (i.e. buildings mapped in both the REF and OSM datasets) is the 76.8% of the total area of REF buildings; the total area of FN (i.e. buildings mapped in the REF but not in the OSM dataset) is the 23.2% of the total area of REF, while the total area of FP (i.e. buildings mapped in the OSM but not in the REF dataset) is the 15.1% of the total area of REF.
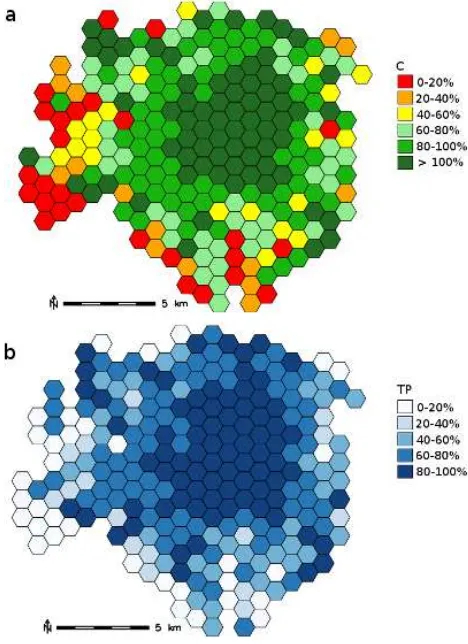
is considered as the ground truth, it may contain errors (i.e. missing buildings); and c) in OSM some elements which are not buildings are wrongly mapped as buildings. OSM building completeness is also very high in the areas just outside Milan city center, where most of the grid cells are characterized by C values ranging between 80% and 100%. The grid cells falling in this range represent the 27.7% of the total. The 18.5% and 8% of the remaining cells show C values in the ranges 60-80% and 40-60%, respectively, while cells having a completeness below 40% represent a small percentage of the total (16.9%) and are mainly located in the southwest periphery of Milan.
As the existence of OSM buildings without correspondence in the REF dataset leads to an overestimation of C, the spatial distribution of TP rate is also investigated. The value of this parameter is also very little affected by the updating difference of the two datasets. Results are shown in Figure 2b and largely confirm the trend observed for C, i.e. OSM completeness is high in the city center and gradually lower in the peripheral areas. In general, TP values are slightly lower than C values but results still remain satisfactory. Most of the cells (63.9%) have TP values higher than 60%; the 16% ranges between 40% and 60%, and the remaining 20.1% have TP rates lower than 40%.
Figure 2. Spatial distribution of C parameter (a) and TP rate (b) in Milan Municipality
4.2 Assessment of OSM building positional accuracy
The total number of homologous pairs detected by the algorithm described in Subsection 3.2 is approximately 100000. However to obtain not just global but also local measures of the OSM positional accuracy, OSM and REF building datasets are again split by means of a grid. More in detail, a square grid of 10 km x 10 km cells and a sub-grid of 5 km x 5 km cells are defined (see Figure 3). In the following focus is placed on the search of homologous points on cells 0 and 2 (wide areas including both
the city center and periphery of Milan), on sub-cell 1-2 (small area in the city center), and on sub-cell 3-1 (small area in the periphery).
Figure 3. Regular square grids and relative cell numbers used to create heterogeneous regions for local analysis
An example of homologous points detected is shown in Figure 4. For each of the four cells taken into account, Table 1 shows the total number of homologous points and their main statistics (mean μ and variance σ2
) on the horizontal shift ΔX, the vertical shift ΔY, and the euclidean distance d (see the row “None Transform.”). A meaningful result is that a systematic translation of about 0.4 m on both the X and Y directions and a mean distance of about 0.8 m exist between the datasets. This is independent of the area, in other words the positional accuracy is the same in both Milan city center and periphery.
Figure 4. Homologous points automatically detected between the OSM buildings (left) and the REF buildings (right)
Cell Homologous
Points Transform.
ΔY ΔX d
μ [m] σ2 [m2]μ [m] σ2 [m2]μ (m)σ2 [m2]
0 19135
None 0.45 0.18 0.46 0.19 0.81 0.13 Affine 0.00 0.18 0.00 0.19 0.56 0.06 Spline MR 0.00 0.16 0.00 0.16 0.50 0.06
1-2 16480
None 0.35 0.19 0.46 0.19 0.77 0.12 Affine 0.00 0.19 0.00 0.19 0.57 0.06 Spline MR 0.00 0.16 0.00 0.15 0.50 0.06
2 18732
None 0.44 0.18 0.43 0.18 0.79 0.13 Affine 0.00 0.18 0.00 0.18 0.55 0.06 Spline MR 0.00 0.15 0.00 0.15 0.49 0.06
3-1 4318
None 0.28 0.18 0.41 0.18 0.71 0.11 Affine 0.00 0.18 0.00 0.18 0.55 0.07 Spline MR 0.00 0.15 0.00 0.15 0.48 0.06
Table 1. Statistics on the homologous pairs detected in the four cells considered
zero while the mean distance d between the datasets is reduced to about 0.6 m.
A more advanced transformation based on multi-resolution splines can be also applied to detect local distortions in the OSM dataset. Multi-resolution splines are an inexact (i.e. based on a least squares adjustment), deterministic, and localized interpolation method. The main idea of this transformation is to combine spline functions with different domain dimensions to guarantee an accuracy adequate to the data density in each region of the map, in other words to exploit all the available information that is implicitly stored in the homologous points (Brovelli and Zamboni, 2004b). Compared to an affine or a polynomial interpolation, these spline functions make use of a higher number of coefficients which allows to compute more adaptive and localized transformations. The resolution of spline functions depends on the spatial density of homologous points: the denser the points in the area, the better the interpolating surface can adapt to them.
The results of the multi-resolution spline transformation on the OSM buildings are reported in Table 1 in the row “Spline MR Transform.”. The statistics show how the improvement of the mean distance d of about 6.5 cm is not significant with respect to the affine transformation (the reduction is limited to about 10%). Considering that the tolerance of the REF dataset is 0.6 m, the results confirm that OSM buildings have no particular local distortions, and the affine transformations is good enough to obtain an adequate improvement of their positional accuracy. This new warped version of the OSM building dataset, which by definition has a closest match to the REF dataset, can be eventually considered as a substitute of the original OSM building dataset in the OSM database.
5. CONCLUSIONS
The increasing popularity of VGI and OSM has attracted much attention from the academic world, in particular concerning the quality of its user-generated geospatial data and their potential applications. The frequent release of authoritative and official datasets with open licenses (e.g. by NMAs) has facilitated their use as reference sources for comparison to assess the quality of OSM data. The present work has used precisely this approach to compute measures of two quality parameters – completeness and positional accuracy – of the OSM building dataset in Milan Municipality. While the OSM completeness was assessed with traditional, well-known methods, the positional accuracy was evaluated through a novel, quasi-automated approach based on the detection of homologous pairs on the OSM and reference datasets. This is one of the first works on quality assessment of OSM buildings based on a matching algorithm.
Overall results have proven the very high quality of the OSM building dataset under analysis. In terms of completeness OSM shows a slightly decreasing trend from the city centre to the periphery, which is in line with previous studies (e.g. Zielstra and Zipf, 2010) where the completeness of an area is found to be a proxy of its urbanization and centrality. On the opposite the OSM positional accuracy is almost constant in all the sub-areas investigated. The reason is mainly represented by the fact that the main source of OSM buildings, i.e. the imagery provided by Microsoft Bing (which is the default basemap on the most used OSM editors), has a very good alignment with the REF dataset across Milan Municipality. In addition to the quasi-automated detection of homologous points, another possibility offered by the application is to execute warping transformations on the original OSM dataset to obtain a new version having an optimal match to the REF dataset. In case the improvement in positional accuracy introduced by the warping transformation is significant (which however is not much the case of this work),
the resulting OSM building dataset – which by definition has a closest match to the REF dataset – may be suggested as the new version of that OSM dataset in the project's database.
The main limitation of the study, which is common to all the comparisons between OSM and reference datasets, lies in the assumption that the official dataset used represents the ground truth, i.e. has no errors by hypothesis. It is well-known however that even authoritative and official datasets – although resulting from rigorous survey procedures carried out by experts, and although being strictly checked against quality requirements – are prone to errors. As an example, the REF building dataset exploited in the study is four years older than the OSM dataset considered. Therefore, the results of comparisons between OSM and reference datasets should be always interpreted by taking into account their completely diverse nature, i.e. the fact that they exist for different reasons and are subject to fully different processes of editing and update. In the specific case of Milan Municipality, an interesting direction to be considered for future work is to couple the extrinsic analysis presented in this paper with intrinsic approaches, i.e. techniques to assess OSM quality by only looking at the OSM data themselves and their history.
REFERENCES
Antunes, F., Fonte, C. C., Brovelli, M. A., Minghini, M., Molinari, M., Mooney, P., 2015. Assessing OSM Road Positional Quality with Authoritative Data. In: Proceedings of the VIII Conferência Nacional de Cartografia e Geodesia (VIII CNCG), Lisbon, Portugal, 29-30 October 2015.
Barron, C., Neis, P., Zipf, A., 2014. A Comprehensive Framework for Intrinsic OpenStreetMap Quality Analysis. Transactions in GIS, 18(6), pp. 877–895.
Brovelli M.A., Zamboni G., 2004a. A step towards geographic interoperability: the automatic detection of maps homologous pairs. In: Proceedings of Urban Data Management Society Conference (UDMS ’04), Chioggia, Italy, 27-29 October 2004.
Brovelli, M.A., Zamboni, G., 2004b. Adaptive transformation of cartographic base by means of multiresolution spline interpolation. In: The International Archives of the Photogrammetry, Remote Sensing and Spatial Information Sciences, Vol. XXXV, Part B2, pp. 206-211.
Brovelli, M.A., Zamboni, G., 2006. The usability of vectorialization and a new point matching procedure as a first step in conflation raster and vector maps. In: The International Archives of the Photogrammetry, Remote Sensing and Spatial Information Sciences, Vol.XXXVI-2/W40, pp. 85-91
Brovelli, M. A., Minghini, M., Molinari, M. E., Mooney, P., 2016. Towards an automated comparison of OpenStreetMap with authoritative road datasets. Transactions in GIS.
Ciepluch, B., Mooney, P., Jacob, R., Zheng, J., Winstanely, A. C., 2011. Assessing the quality of open spatial data for mobile location-based services: Research and applications. Archives of Photogrammetry, Cartography and Remote Sensing, 22, pp. 105-116.
Estima, J., Painho, M., 2013. Exploratory analysis of OpenStreetMap for land use classification. In: Proceedings of the Second ACM SIGSPATIAL International Workshop on Crowdsourced and Volunteered Geographic Information, Orlando, Florida, USA , 5-8 November 2013.
Journal of Geographical Information Science, 28(4), pp. 700-719.
Forghani, M., Delevar, M. R., 2014. A Quality Study of the OpenStreetMap Dataset for Tehran. ISPRS International Journal of Geo-Information, 3(2), pp. 750-763.
Formez PA, 2012. Italian Open Data Licence v2.0, http://www.dati.gov.it/iodl/2.0 (4 Apr. 2016)
Fram, C., Chistopoulou, K., Ellul, C., 2015. Assessing the quality of OpenStreetMap building data and searching for a proxy variable to estimate OSM building data completeness. In: Proceedings of the 23rd GIS Research UK (GISRUK) conference, Leeds, UK, 15-17 April 2015.
Girres, J. F., Touya, G., 2010. Quality assessment of the French OpenStreetMap dataset. Transactions in GIS, 14(4), pp. 435-459.
Goetz, M., Zipf, A., 2012. OpenStreetMap in 3D – Detailed Insights on the Current Situation in Germany. In: Proceedings of the 15th AGILE International Conference on Geographic Information Science, Avignon, France, 24-27 April 2012.
Goodchild, M. F., 2007. Citizens as sensors: the world of volunteered geography. GeoJournal, 69(4), pp. 211-221.
Graser, A., Straub, M., Dragaschnig, M., 2014. Towards an Open Source Analysis Toolbox for Street Network Comparison: Indicators, Tools and Results of a Comparison of OSM and the Official Austrian Reference Graph. Transactions in GIS, 18(4), pp. 510-526.
Haklay, M., 2010. How good is volunteered geographical information? A comparative study of OpenStreetMap and Ordnance Survey datasets. Environment and planning B: Planning and design, 37(4), pp. 682-703.
Hecht, C., Kunze, C., Hahmann, S., 2013. Measuring Completeness of Building Footprints in OpenStreetMap over Space and Time. ISPRS International Journal of Geo-Information, 2(4), pp. 1066-1091.
Jackson, S.P., Mullen W., Agouris, P., Crooks, A., Croitoru, A., Stefanidis, A., 2013. Assessing Completeness and Spatial Error of Features in Volunteered Geographic Information. ISPRS International Journal of Geo-Information, 2(2), pp. 507-530.
Jokar Arsanjani, J., Zipf, A., Mooney, P., Helbich, M., 2015a. An Introduction to OpenStreetMap in Geographic Information Science: Experiences, Research, and Applications. In: OpenStreetMap in GIScience. Springer International Publishing, pp. 1-15.
Jokar Arsanjani, J., Mooney, P., Helbich, M., Zipf A., 2015b. An exploration of future patterns of the contributions to OpenStreetMap and development of a contribution index. Transactions in GIS, 19(6), pp. 896-914.
Jokar Arsanjani, J., Mooney, P., Zipf , A., Schauss, A., 2015c. Quality Assessment of the Contributed Land Use Information from OpenStreetMap Versus Authoritative Datasets. In: OpenStreetMap in GIScience. Springer International Publishing, pp. 37-58.
Kalantari, M., La, V., 2015. Assessing OpenStreetMap as an Open Property Map. In: OpenStreetMap in GIScience. Springer International Publishing, pp. 255-272.
Keßler, C., de Groot, R. T. A., 2013. Trust as a proxy measure for the quality of volunteered geographic information in the case of OpenStreetMap. In: Geographic information science at the heart of Europe. Springer International Publishing, pp. 21-37.
Klonner, C., Barron, C., Neis, P., Höfle, B., 2015 Updating digital elevation models via change detection and fusion of human and remote sensor data in urban environments. International Journal of Digital Earth, 8(2), pp. 153-171.
Kounadi, O., 2011. Assessing the quality of OpenStreetMap data. MSc Thesis, University College of London, London.
Mooney, P., Corcoran, P., Winstanley, A., 2010. Towards quality metrics for OpenStreetMap. In: Proceedings of the 18th SIGSPATIAL International Conference on Advances in Geographic Information Systems, San Jose, CA, USA, 3-5 November 2010.
Törnros, T., Dorn, H., Hahmann, S., Zipf, A., 2015 Uncertainties Of Completeness Measures In Openstreetmap – A Case Study For Buildings In A Medium-Sized German City. In: ISPRS Annals of the Photogrammetry, Remote Sensing and Spatial Information Sciences, Vol. II-3/W5, ISPRS Geospatial Week 2015, La Grande Motte, France, 28 September-3 October 2015, pp. 353-357.
Zielstra, D., Zipf, A., 2010. A comparative study of proprietary geodata and volunteered geographic information for Germany. In: Proceedings of the 13th AGILE international conference on geographic information science, Guimarães, Portugal, 11-14 May 2010.