APPLICATION OF MODIS DATA TO ASSESS THE LATEST FOREST COVER
CHANGES OF SRI LANKA
Kithsiri Pereraa, *, Srikantha Herathb, Armando Apana, Ryutaro Tateishic
a
Engineering and Surveying and Australian Centre for Sustainable Catchments University of Southern Queensland, West Street, Toowoomba 4350 QLD Australia; email: [email protected]
b
Environment and Sustainable Development, United Nations University, 5-53-70, Jingumae, Shibuya-ku, Tokyo 150-0001, Japan
c
Center for Environmental Remote Sensing (CEReS), Chiba University, 1-33 Yayoi-cho, Inage-ku, Chiba 263-8522, Japan
Technical Commission VII/4
KEY WORDS: Satellite, Application, Monitoring, Measurement, Real-time, Spatial
ABSTRACT:
Assessing forest cover of Sri Lanka is becoming important to lower the pressure on forest lands as well as man-elephant conflicts. Furthermore, the land access to north-east Sri Lanka after the end of 30 years long civil war has increased the need of regularly updated land cover information for proper planning. This study produced an assessment of the forest cover of Sri Lanka using two satellite data based maps within 23 years of time span. For the old forest cover map, the study used one of the first island-wide digital land cover classification produced by the main author in 1988. The old land cover classification was produced at 80m spatial resolution, using Landsat MSS data. A previously published another study by the author has investigated the application feasibility of MODIS and Landsat MSS imagery for a selected sub-section of Sri Lanka to identify the forest cover changes. Through the light of these two studies, the assessment was conducted to investigate the application possibility of MODIS 250m over a small island like Sri Lanka. The relation between the definition of forest in the study and spatial resolution of the used satellite data sets were considered since the 2012 map was based on MODIS data. The forest cover map of 1988 was interpolated into 250m spatial resolution to integrate with the GIS data base. The results demonstrated the advantages as well as disadvantages of MODIS data in a study at this scale. The successful monitoring of forest is largely depending on the possibility to update the field conditions at regular basis. Freely available MODIS data provides a very valuable set of information of relatively large green patches on the ground at relatively real-time basis. Based on the changes of forest cover from 1988 to 2012, the study recommends the use of MODIS data as a resalable method to forest assessment and to identify hotspots to be re-investigated. It’s noteworthy to mention the possibility of uncounted small isolated pockets of forest, or sub-pixel size forest patches when MODIS 250mx250m data used in small regions.
* Kithsiri Perera. [email protected]
1. INTRODUCTION
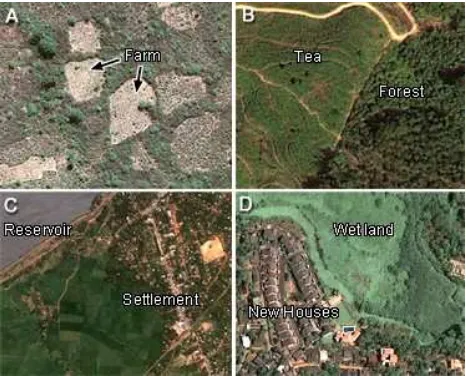
Sri Lanka is an island with 65,610 sq km land area and blessed with a rich biodiversity (27% of Sri Lanka’s plants are endemic) due to its tropical climate (Mongabay.com, 2006). The central hill country of the island is the source of over 103 major rivers flowing to all directions in radial shape. Sri Lanka is the house for over 20 million people and a rich array of flora and fauna. According to historical estimations, when the British Empire took the control in 1843, about 90% of the Island was covered by forest (Alagan, 2009). This lush forest cover of Sri Lanka has also experienced a rapid decrease in last 100 years parallel to most of other regions of the world. At the early stage of the decrease, forest has been lost due to the spread of plantation agriculture introduced by the British administration. In the twentieth century deforestation was caused by expansion of informal settlements due to population increase, national development projects and planned settlement programs of the government and land encroachments (Rathnayake et. al, 2002; Alagan, 2009; FRA, 2001). In figure 1, few typical causes for deforestation, monitored by very high resolution satellite data available through Google Earth are presented. These various historical and concurrent reasons are causing a significant pressure on the limited forest cover of Sri Lanka.
Figure 1. Major causes of deforestation in Sri Lanka; A – traditional cut and burn farms, B – large scale plantations, C – new agriculture settlements, D – filling wet lands for housing. See approximate image locations in figure 2.
Assessing this limited forest cover is critically important to ease the pressure on forest lands as well as to lower man-elephant conflicts. The new land access to north-east Sri Lanka after the end of the 30 years long civil war has further increases the need of regularly updated land cover information for proper planning. Other decisive reasons for present study were the availability of previously made land cover map from Landsat MSS data with extensive field data (Perera and Tateishi, 1991, Perera et al., 1992) and local research contacts. A consideration has also given to the resent fluctuations in annual rainfall pattern, when analysing the assessment.
2. SRI LANKA AND ITS FOREST COVER
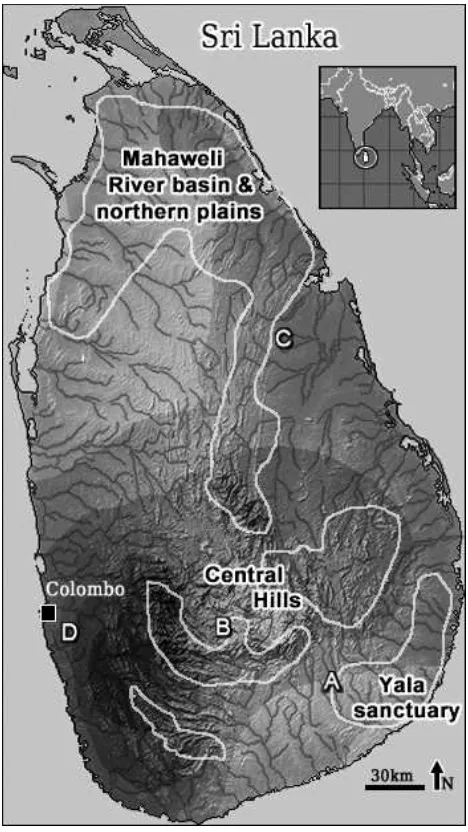
Figure 2. The central highlands, river network, mean annual rainfall and major forest locations of the island (A, B, C & D present approximate locations of figure 1 images). Darker areas are high in rainfall.
When conducting an assessment of forest cover, it’s vital to understand the geography, climate, history and socioeconomic background of the considered area. Sri Lanka is characterized with a considerable topographic diversity from high mountain peaks to flat low lands compared to its smaller size (FRA,
2001). The central region of Sri Lanka rises over 2,500m (Mt Pidurutalagala 2,524 m) and a sizable area in the country exceeds 1500 m above sea level, where a thick forest cover blanketed before large scale plantations begun in 18th century. A significant impact on the forest cover of the island has caused by the large scale plantations (coffee then tea, rubber, coconut, and cinnamon) started by British colonial rulers since mid 1800s. A vast flatland along the coastal belt lies below 500 m from sea level, where most of the present day forests are located. River network flow in a radial pattern from central hills of Sri Lanka divides the island into 103 river basins (Wijesuriya 1989; Perera & Tateishi, 1991).
Climatology of Sri Lanka works favourably to support the growth of a forest cover at nearly all locations of the country except Jaffna peninsula in north and few coastal dry lands due to soil and climatic reasons. The island gets rainfall from two major monsoons (south-west and north-east) and from inter-monsoon rains. The south-west inter-monsoon (May to September) poured over 55% of the annual rainfall (GFDRR, 2011). The average annual rainfall distribution of the island total rainfall often exceeds 3000mm (darker areas of figure 2).
The pattern of river network, mean annual rainfall, elevation, and the remaining forest in relatively dry regions of the country indicate clear evidences for the historical flush greenery in all regions. According to historical reports 70% of the land under forest in 1900, but reduced drastically in last 100 years. Through the population increase and economic activities, this forest cover reduction has taken place and remaining major forest areas have restricted to three key regions of the country, i.e., Mahaweli River basin and northern plains, Central Hills, and Yala sanctuary in southeast. When mean annual rainfall data layer overplayed with rivers and elevations, the geo-climatic background of these remaining forest areas becomes clearer, as compiled in figure 2. The most of the forest cover is located in relatively dry and flat terrain where less human activities are located.
The area under forest cover in recent years has given with different percentage values in different studies depending on the data source of the map, definition of the forest, and mapping methodology (Alagan, 2009; Perera & Tateishi, 1996; Rathnayake et al, 2002; Suzuki, 2007). Nearly all estimations have placed the percentage of forest cover of Sri Lanka as 25% - 30% of the total land area. A descriptive forest classification presented by the forest conservation department, Sri Lanka using government data of 1992 has given seven categories based on climate and elevation (WWCT, 2011). However, forest cover monitoring with satellite images are largely based on spectral information recorded by the satellite sensor and can be used to monitor vegetation cover regardless to elevation and climate conditions. This study investigated the applicability of MODIS 250m satellite images to classify total forest area and compare with as old forest cover data set produced in 1988 which has finer spatial resolution.
3. APPLICABILITY OF SATELLITE IMAGERY
The relationship between climate and elevation of Sri Lanka was discussed in this report in order to provide information on non-existing positive relation of present forest cover with high rainfall and elevation. The assessment discussed in this study is focused on quantitative change of the forest cover which is one of the most important factors to be considered in any forest conservation plan. However, field survey based forest investigations are costly for these assessment works. Here,
application of satellite images for forest cover investigations provides an ideal cost effective alternation. Since the launch of Landsat MSS (Multi-Spectral Scanner System) earth observation satellite in July 1972 (NASA, 2012), earth observation including forest cover monitoring from space ran into a technological revolution. In recent years there are many well developed operational satellite systems to support decision-making and forest management on, global, national and sub-national scale (Perera et al., 1992; Eurisy report, 2011; Lehmann et al. 2012). Through the advancements of the technology, high resolution imaging sensors have been launched and the data acquired by these satellites are becoming useful for producing detailed land cover maps.
While these advantages are promising, it is extremely difficult to get cloud-free satellite imagery for Sri Lanka due to the near-perennial tropical cloud coverage over the mountains and long recurrent periods of the satellites. The high cost of finer resolution satellite images is another very significant hurdle faces by developing nations. Apart from the economic hardships, Sri Lanka suffered 30 years long civil war which was just ended in 2009. Data acquired by MODIS system can be utilized as a reasonable solution under these circumstances. The table 1 presents some of the technical information of four major earth observation systems.
Source: NASA and SPOT web sites
Table 1. A comparison of basic components of four prominent earth observation satellites.
After MODIS (MODerate- resolution Imaging Spectrometer)( MODIS, About MODIS, 2012) images became available, many scientists have successfully produced land cover maps with MODIS data or combined with other GIS (Geographic Information Sysyems) data to make use the advantages of MODIS system (Friedl et al., 2002; Hall et al., 2002: Price, 2003; Zhan et al., 2002). Geometrically corrected MODIS data products such as MODIS NDVI (MODIS WEB, 2006) and true colour image data (NASA, MODIS Rapid Response Systems, 2011; Gumley et al., 2003) are available through NASA for the global community at no cost.
Landsat MSS 4 - 5 Terra/Aqua MODIS
Table 2. Similarities in spectral bandwidth between Landsat MSS and MODIS systems.
Taking advantage of these pre-processed NASA’s MODIS products and its inherited technical advantages (daily recurrent and broader swath), this study used a near-cloud free true colour
MODIS mosaic of Sri Lanka to conduct the forest cover assessment. The present study was supported by a recently published paper by the author on experimenting on application of MODIS and Landsat MSS data to observe land cover changes in a selected sub-region of Sri Lanka (Perera & Tsuchiya, 2009).
Table 2 presents spectral bandwidth information of two satellite systems used in the study. The old forest cover map was extracted from 1988 land cover map produced by the author using Landsat MSS images. Though spectral characters are not perfectly matching between MSS and MODIS, the table 2 compares some significant similarities in image bands. In the present study, application of two different satellite data sets to assess the “forest” category bears two important features. 1. Assessing forest cover of entire Sri Lanka at 23 years of time span using satellite image products.
2. Testing the applicability of two different satellite data sources at entirely different spatial resolutions for mapping task.
4. MAPPING THE FOREST COVER
4.1 Forest cover of 1988
The land cover map of 1988 was produced as one of first digital spatial data base produced for entire Sri Lanka in 1980s, using Landsat MSS data (Perera et al., 1991, 1992). The mapping process was extensively supported by ground truth surveys. Only a brief explanation is included in this study about the data processing methodology of 1988 map. After correction of geometric distortions of all MSS images using ground control points, the land cover classification of each image scene was performed separately applying the maximum likelihood classifier. About 50% of Sri Lanka was covered by Landsat MSS images of 2nd August, 1988 (scene number 55, 140-56, and 141-54) and remaining western part was covered by 16th March 1987 image (141-55). Based on spectral values and field investigations, forest cover has been classified under one category in 1988 land cover map and this forest area was extracted to produce the 1988 forest cover in present study.
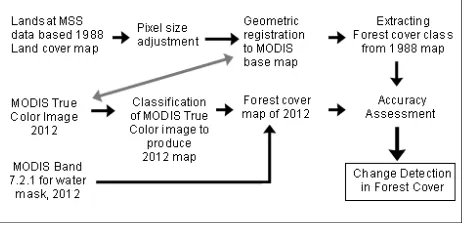
Figure 3. The flow of data processing. The production process of 1988 map is not included in detail here.
To prepare 1988 forest cover data set (MSS) to compare with the 2012 product (MODIS), an adjustment of pixel size of MSS image through aggregation of pixels was conducted. With regard to this aggregation process of high resolution satellite image data, Liang et al. (2002) wrote “In a recent study, Liang (2001) conduct an extensive simulation study using a three-dimensional atmospheric radioactive transfer model and found that up-scaling of reflectance and albedo products from the 30 m resolution ETM+ to the 1000 m resolution MODIS is highly linear. It implies that we can linearly average the ETM+
reflectance and albedo products of 30 m to the MODIS products of 1000 m without facing any significant amount of errors.” Based on the research finding of Liang et al.(2002), this study assumed characteristic of Landsat ETM+ is applicable to Landsat MSS data, and the pixel size adjustment of MSS image data were performed through aggregation of 3×3 pixels converting into 240 m resolution image. The resulted forest map was registered on 2012 map using map to map geometric transfer and presents in figure 4.
4.2 Forest cover of 2012
The near perennial cloud cover in tropical sky is one of the controlling factors for studies based on active remote sensing data in tropical regions. This obstacle was discussed in detailed in a study that used MODIS true colour images to classify land cover of Mekong River basin (Perera et al., 2010). However, unlike the complicated data processing for producing number of land cover categories, isolating forest only category is an achievable task with fewer difficulties. To meet the ISPRS standard length requirements of the report, some of the preliminary stage data mining and processing steps were not included in this report. In figure 3, the main steps of 2012 map production and comparison with 1988 map is presented.
Figure 4. Forest cover of 1988.
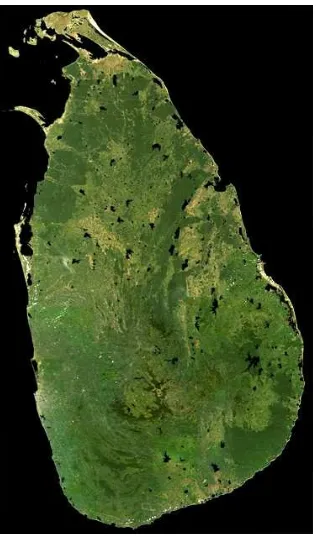
After a careful observation of MODIS images from Jan 2011 to Jan 2012, three images (2011067, 2012001, and 2012003) were selected to produce the true colour mosaic to extract the forest cover. The image dates were selected from same rainfall season to avoid any significant fluctuation in greenery. Image processing was conducted using ENVI 4.6 package. To delineate the clear coastal boundary and isolate inland water features (water mask), band 7(R), 2(G), 1(B), mosaic also produced using MODIS images of same dates. In band 7-2-1 combination, water is visible in dark blue and no sub colours are prominently appearing within water.
The true colour mosaic superimposed with the water mask produced using band 7, 2, and 1 combination is presented in figure 5. After interpolating and registering 1988 image with 2012 data set, same water mask was superimposed on 1988 data set too. As MODIS documentation explains, its true colour band combination is strongly representing vegetation information on the ground while keeping the soil and vegetation differences intact. The table 3 shows key uses of each band in true colour combination of MODIS. To integrate with Google Earth, MODIS KML files of same image dates were downloaded. The set of training sites was selected using the true colour mosaic and integrated with MODIS KML files to locate exact location in high resolution Google Earth images.
Figure 5. Cloud free MODIS image mosaic of Sri Lanka.
Band Range (nm)
Key use
MODIS true colour
1 (R) 620 - 670 Absolute Land Cover transformation, Vegetation Chlorophyll 2 (G) 545 - 565 Green Vegetation 3 (B) 459 - 479 Soil/Vegetation
differences
Table 3. The usages of MODIS true colour bands
When selecting training samples, it was assumed that the forest cover is having fewer fluctuations in green biomass if the images collected in same rainy season. Pixel values within each training site were used as the initial criteria to discriminate pre identified forest cover, with the support of knowledge about the region and existing map information, together with the very high resolution images in Google Earth. Each training sample contained well over 1000 pixels to give enough representation for each pre-identified forest and non forest areas. Due to the availability of reliable ground truth information and to match with 1988 classification procedure, the image classification was conducted using supervised maximum likelihood classifier and final forest map of 2012 was produced through combining initial forest classes (figure 6). The similar method used to generate training samples using Google Earth high resolution image was administrated to gather ground truth information for accuracy assessment of the 2012 forest cover map. Randomly selected 50 sample points within classified forest area were checked against Google Earth Image and calculated the mapping accuracy as over 85%.
5. ANALYSIS OF RESULTS AND CONCLUSIONS
Figure 6. Forest cover of 1988.
The assessment of forest cover of Sri Lanka was achieved using 1988 and 2012 forest cover maps produced using Landsat MSS
and MODIS images respectively. Area under forest has changed significantly within last 23 years, by 137,700 hectares (table 4). The total area under forest in 2012 map is lower than the calculated forest area figure (30.9%) published in 2000 (FRA, 2001), though the area is higher than according to a study which calculated the closed canopy forest area as 25.7% (Ratnayake et al, 2011). Total forest area (19,330 sq km) published by mongaday.com (2006) is much closer to the 2012 map figure.
1988 Sq km 2012 Sq km
Forest 31.72% 20,811 29.62% 19,434 Other 68.28% 44,799 70.38% 46,176
TOTAL 100% 65,610 100% 65,610
Table 4. Assessment of forest area changes.
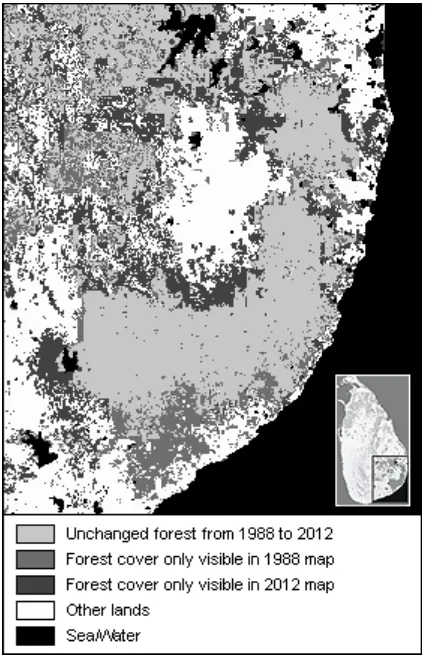
The spatial pattern of forest cover changes between 1988 and 2012 shows most of the major forest regions mentioned in figure 2 are intact apart from some large scale negative changes visible in southeast region and small scale positive and negative changes in various locations of the country.
Figure 7. Forest cover changes detected in southeast Sri Lanka.
Figure 7 shows forest cover change detection image of southeast Sri Lanka, where some major changes have highlighted. As possible reasons for the negative changes, recent large scale agriculture settlements can be pointed out. With the increase of population (16.5 million in 1988 and estimated 21 million in 2010), village expansion and large scale settlements have occurred and consumed 51,000 hectares of new lands between 1983 and 1992 throughout Sri Lanka (Ratnayake et al, 2002). Various positive changes in forest
cover may have caused by favourable weather conditions that created higher spectral values in 2012 MODIS images. The study showed the applicability of MODIS images to ascertain single land cover type (forest) changes with an acceptable level of information. Application of MODIS to update remote sensing data based old land cover products has a cost effective benefit, especially for developing nations, where acquiring high resolution satellite data is costly. Furthermore, MODIS based change detection and assessment is strong enough to identify hotspots that can be reinvestigated. However, it’s worth to mention the possible unaccountability of isolated forest pockets smaller than MODIS 250m x 250m spatial resolution.
References
Alagan, R., 2009, Sri Lanka’s Forest Cover: What We Know
and What we Don’t. Earthday 2009 publication,
http://www.gvglobalvision.org/publications/Earth%20Day %202009.pdf
Dela, J., De Silva, A., Amarasighe, A., Wijesighe, L., 2002, The South and Central Asian Man and the Biosphere Meeting of Experts on Environmental Conservation, Management and Research, http://dl.nsf.ac.lk/bitstream/1/5442/1/NA-280.pdf Eurisy report, 2011. Forest and biomass management using
satellite information and services.
www.eurisy.org/index.php/news/item/download/94.html (20 Dec 2011)
FRA, 2001. Forestry Resources Assessment WP 17 under FAO, Forest Resources of Sri Lanka Country Report.
http://www.fao.org/docrep/007/ad678e/ad678e00.htm (12 Dec 2011)
Friedl, M.A., McIver, D. K., Hodges, J.C.F. , Zhang, X.Y., et al. Global land cover mapping from MODIS: algorithms and early results. Remote Sensing of Environment, 83, 287-302, 2002. pages, Univ. of Wisconsin-Madison, 2003.
Hall, D.K., Riggs, G.A. , Salomonson, V.V., DiGirolamo, N.E., Bayr, K.J. 2002. MODIS snow cover products. Remote Sensing of Environment, 83, pp. 181-194
http://www.fao.org/docrep/007/ad678e/ad678e00.htm. Lehmann, E. A.; Caccetta, P. A.; Zhou, Z.-S.; McNeill, S.
J.; Wu, X.; Mitchell, A. L.; 2012. Joint Processing of Landsat and ALOS-PALSAR Data for Forest Mapping and Monitoring, IEEE Transactions on Geoscience and Remote Sensing, vol. 50, no. 1, pp. 55-67
MODIS, About MODIS, 2012.
http://modis.gsfc.nasa.gov/about/specifications.php#1 (06 Jan 2012)
mongabay.com, 2006. Sri Lanka forest figures, http://rainforests.mongabay.com/20srilanka.htm
NASA , 2012. The Multispectral Scanner System
http://landsat.gsfc.nasa.gov/about/mss.html (06 Jan 2012) NASA, Rapid Response, 2011. MODIS Rapid Response
Systems, http://rapidfire.sci.gsfc.nasa.gov/
Perera, L. K., Herath, S., Apan, A., Samarakoon, L., 2010. Mapping Mekong land cover at 250m resolution without in situ observations, Asian Journal of GEOINFORMATICS, Vol. 10 No. 4, pp. 31-41
Perera, L.K., Tateishi, R. 1991. Forest cover monitoring in southern hill country of Sri Lanka using Landsat MSS data.
Proceedings of Annual Symposium of the Japan Society of Photogrammetry and Remote Sensing, pp. 115–120. Perera, L.K., Tateishi, R. 1996. ACRS 1996, 1 KM Land Cover
Data Base in Asia, GIS of management of forest in eastern Sri Lanka through a semi-knowledge based approach. http://www.a-a-r-Environmental Effects of such changes in Central South Sri Lanka. Journal of Geography, Tokyo Geographical Society, Vol. 101 N. 4, pp. 307-317
Price, J. C. 2003. Comparing MODIS and ETM+ data for regional and global land classification. Remote Sensing of Environment, 86, pp. 491-499
Ratnayake, J., Abeykoon, M., Chemin, Y., 2002. District-wise forest area variation in Sri Lanka from 1992 to 2001 for supporting the National Physical Planning Policy,
http://www.a-a-r-s.org/acrs/proceeding/ACRS2002/Papers/FR02-3.pdf SPOT, 2011. Resolution and Spectral Bands,
http://www.astrium-geo.com/en/194-resolution-and-spectral-bands
Suzuki, K., 2007, Global Japanese data ranking.
http://dataranking.com/table.cgi?LG=e&TP=Forestarea(ofla ndarea)&CO=Japan&RG=0&TM=2007
Wijesooriya, W. A. D. A., & Gunathilaka, C. V. S., 2003. Buffer Zones of the Sinharaja Biosphere Reserve in Sri Lanka and its Management Strategies, Journal of National Science Foundation, Sri Lanka, 31 (1&2) pp. 57-71 WWCT, 2011, The Wilderness and wildlife conservation trust,
Sri Lanka, http://www.wwct.org/forest_type.aspx