ESTIMATION OF INSULATOR CONTAMINATIONS BY MEANS OF REMOTE
SENSING TECHNIQUE
Ge Han a*,Wei Gong b,c, Xiaohui Cui a, Miao Zhangd,Jun Chene
a Wuhan University, International School of Software, 430079 Luoyu Road 129, Wuhan, China –[email protected] b Wuhan University, State Key Laboratory of Information Engineering in Surveying, Mapping and Remote Sensing,
Wuhan University, 430079 Luoyu Road 129, Wuhan, China –[email protected] c Collaborative Innovation Center of Geospatial Technology, 430079 Luoyu Road 129, Wuhan, China
d
School of Environmental Science and Tourism, Nanyang Normal University, Wolong Road No.1638, Nan Yang 473061,China – [email protected]
e Wuhan University, School of Computer, 430079 Luoyu Road 129, Wuhan, China Commission VIII, WG VIII/1
KEY WORDS: Insulator Contaminations, Power Facilities, ESDD, Remote Sensing, SVM
ABSTRACT:
The accurate estimation of deposits adhering on insulators is critical to prevent pollution flashovers which cause huge costs worldwide. The traditional evaluation method of insulator contaminations (IC) is based sparse manual in-situ measurements, resulting in insufficient spatial representativeness and poor timeliness. Filling that gap, we proposed a novel evaluation framework of IC based on remote sensing and data mining. Varieties of products derived from satellite data, such as aerosol optical depth (AOD), digital elevation model (DEM), land use and land cover and normalized difference vegetation index were obtained to estimate the severity of IC along with the necessary field investigation inventory (pollution sources, ambient atmosphere and meteorological data). Rough set theory was utilized to minimize input sets under the prerequisite that the resultant set is equivalent to the full sets in terms of the decision ability to distinguish severity levels of IC. We found that AOD, the strength of pollution source and the precipitation are the top 3 decisive factors to estimate insulator contaminations. On that basis, different classification algorithm such as mahalanobis minimum distance, support vector machine (SVM) and maximum likelihood method were utilized to estimate severity levels of IC. 10-fold cross-validation was carried out to evaluate the performances of different methods. SVM yielded the best overall accuracy among three algorithms. An overall accuracy of more than 70% was witnessed, suggesting a promising application of remote sensing in power maintenance. To our knowledge, this is the first trial to introduce remote sensing and relevant data analysis technique into the estimation of electrical insulator contaminations.
1. INTRODUCTION
Flashovers happened in high-voltage electric power transmission systems caused huge losses to society with estimates of 80-100 billion dollars in the USA[1]. Contaminated insulators are considered as a critical factor which is responsible for flashovers[2].According to statistics from the power industry of China, the contamination flashover ranked second in the occurrences of power accidents and ranked first in the cost of power accidents in 2001[3]. The increasing deteriorative air quality in China draws great attention from both the public and the academia [4-6] and may exert negative influences on insulator contamination accumulation[7]. Meanwhile, along with the booming economy both the scale and the voltage of the operating power grid increase significantly in China. Hence, the damage caused by contamination flashover would be definitely more serious without any measures. The accurate estimation of deposits adhering on insulators is critical to prevent pollution flashovers which cause huge costs worldwide. The traditional evaluation method of insulator contaminations is based on sparse manual in-situ measurements which are time consuming and highly rely on experiences, resulting in insufficient spatial representativeness and poor timeliness.
Tackling with the above issue, aerosol optical depth (AOD) acquired by remote sensing of satellites was utilized as the proxy of air pollution[8]. On that basis, data mining techniques and image classification algorithms were introduced
to build novel evaluation frameworks for IC over large areas with low costs. Timeliness and coverage of remote sensed data are evident advantages over traditional methods, facilitating good spatial representation as well as reducing costs of mapping IC levels. Besides, mature processing method of remote sensing data such as feature extraction and supervised classification help taking a comprehensive consideration of multiple IC-related factors, preventing subjectivity in production of IC level maps. At last, Hubei, a central province in China, was taken as study area to validate the proposed method.
2. METHODOLOGY 2.1 Study Area
The Hubei province is geographically situated between 29°05′–32°20′N and 108°21′–116°07′E, lying in
robustness of the power grid is critical to not only the central China but also the eastern China.
Except for validation with existing IC pollution area map, we have also carried out a series of field investigation to verify performance of proposed method. As geographical coordinates
of transmission line towers are classified according to Chinese laws, we have added some random errors into the geographical coordinates so that the labels in relevant figures of this paper are roughly rather than exactly consistent with the real towers in geographical coordinates.
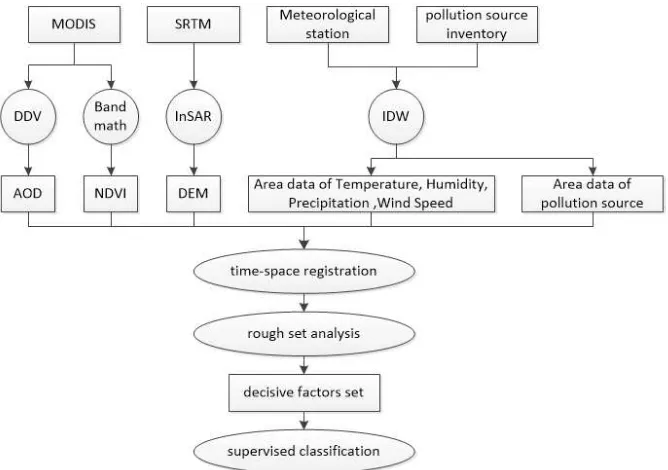
Figure 1 The location of Hubei in China 2.2 Method
Figure 2 schematic diagram of proposed frameworks
AOD, as a physical quantity which can be directly retrievedfrom observations of satellites[10], is an ideal proxy for air pollution which is highly related with IC[11]. NDVI is a common-used index for evaluating status of vegetation which may exert influences on accumulation of IC. DEM may effect IC in two mechanisms. One is the dispersion of pollutions. The other is that DEM is related with intensities of human activity which would have impact on accumulation of IC. Besides, precipitation and speed of wind have already been proved to be influencing factors of IC though the relationship has not been depict clearly. At last, the pollution source inventory is a
fundamental data collected by power sectors to assess severity of IC.
noting that the pollution area map is based on sparse field investigation around electric power facilities. Consequently, results of remote places are unreliable. We have also consulted to power maintenance personnel on reliability of different measuring points. Then training sets were determined randomly in selected regions in terms of proportions of IC levels. Totally three classification algorithm were used to produce evaluation results, namely, maximum likelihood, SVM and mahalanobis minimum distance. The reason why they are utilized is popularity. One can easily master those methods because they are integrated in most commerce software of remote sensed data analysis.
3. RESULTS AND DISCUSSIONS 3.1 Determination of decisive factors
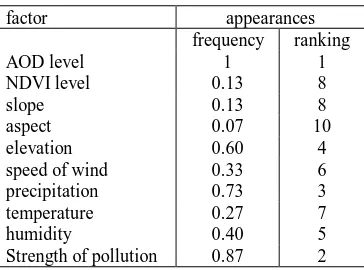
factor appearances
Table 1. Appearances of factors in reduction sets
15 reduction sets were retrieved by rough set analysis. Reduction set is the subset whose decisive ability is equivalent to the full set. Theoretically, each reduction set is the same with each other with respect to decisive ability. However, it may not be well explained from perspective of physics because the principle of rough set is based on data mining. Hence, it is necessary to evaluate the result. We calculated appearances of factors in 15 different reduction sets. The more a factor appeared the more significant it is.
Table 1 shows that AOD, strength of pollution, precipitation, elevation are the top 4 important factors which appeared in more than half of reduction sets, implying that those factors could exert evident influences on accumulations of IC. Hence, in the following part, we selected those 4 factors as input data to further evaluate levels of IC.
Also as we see, AOD marks the first in the rankings of all factors, suggesting that AOD product will be the fundamental data for IC evaluation. The fact also proves indirectly that air pollution is a hazard factor for maintenances of power facilities. Considering that conditions of air quality in China are extremely worrying nowadays, the situation of power transmission security would be more severe than decades ago. Hence, additional attentions should be paid on evaluation and cleaning of IC from now on. To obtain accurate observations of air conditions in large area, remote sensing as well as atmospheric transmission model should be emphasized by employee of power industry in the future.
3.2 Generated IC susceptibility map
Figure 3 map of pollution sources
Figure 3 demonstrates interpolation result of pollution sources combined with DEM. The pollution source inventory provided by electric power sector is very coarse. Employees investigate on pollution sources around power transmission line irregularly. The main goal of their work is actually maintenance of the electric facilities. Therefore, there is only information about location but no information about emission intensities and categories of pollution sources. Besides, there is also no information about areas where no important power facilities are located. Though we retrieved the map of pollution sources by means of inverse distance weighted interpolation, results of areas where there are no points (the circle) are unreliable. Consequently, we selected training and verification samples in surroundings of those points. Also the reliability of pollution area map is also related with the figure 3
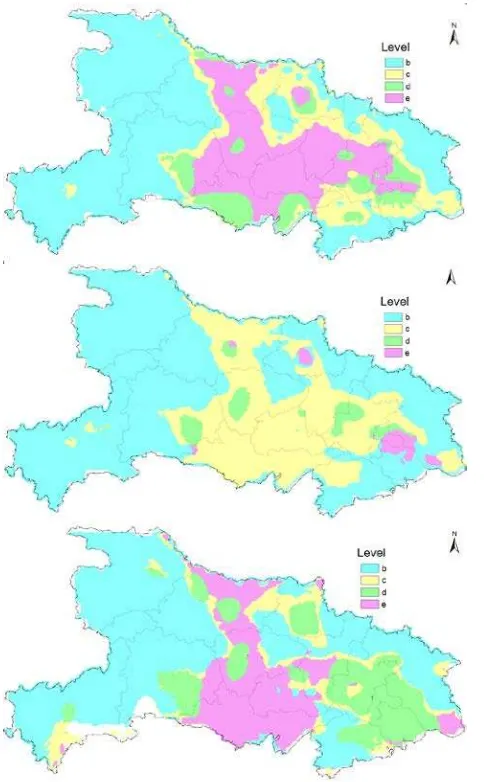
Figure 4 shows the pollution area map provided by State Grid Corporation of China. According to national standard of China, there are totally 5 levels of IC. A represents the cleanest condition of insulators while e represents the dirtiest condition. As Figure 4 shown, there is no area of a in Hubei, indicating that the situation of IC in Hubei was already somewhat serious.
Figure 4 the pollution area map of Hubei provinces in
2013
Figure 5 assessment results of different classification
algorithms. From top to bottom, maximum likelihood,
support vector machine and mahalanobis minimum
distance method respectively. Table 2-4 show the
confusion matrix of three different algorithms.
Overall accuracy
Table 2
ConfusionMatrix of AccuracyAssessment in Method of Maximum LikelihoodTable 3
ConfusionMatrix of AccuracyAssessment in Method of SVMTable 4
ConfusionMatrix of AccuracyAssessment in Method of Maximum LikelihoodGenerally, in the area of low IC levels assessment results are coincide well with the pollution map. The SVM yields very good results in low level areas. However, SVM algorithm leans to classify region into lower level area. Consequently, it would underestimate IC condition in area of high pollution. As the proportion of a is the highest in all levels, SVM then yields the best overall accuracy. In practical applications, we lean to overestimate the level of IC from perspective of cautious consideration. Therefore, ML and MD method may be more useful in revision of current pollution area map.
Figure 6 Location of field survey points.
point FS PAM ML MD SVM
Table 5 Accuracy assessment using field survey as
reference
Finally, we carried out a field survey to verify IC susceptibility mapping results obtained by proposed method. According to Figure 4 and 5, the most inconsistent part is the central Hubei. Consequently, we selected 6 locations in that part to verify our results. Table 5 demonstrates results of comparison. FS represents field survey, PAM represents pollution area map. The FS was used as a truth reference. Accuracy of 83% was obtained by proposed method using SVM as a classifier, which is the same with PAM. Other 2 classifiers yield accuracy of 50%. Field survey indicates that SVM may be an optimal classifier for proposed frameworks.
CONCLUSION
large areas, especially in the remote region where employee of power sector cannot reach easily. An overall accuracy of more than 70% was witnessed with comparison to pollution area map, suggesting a promising application of remote sensing in power maintenance. Finally, our field survey also demonstrates that the proposed framework can yield excellent results. A better input data would help improve performances further in the future. AOD products with higher accuracy and spatial resolution, as well as detail information about pollution sources would be the key step to improvements.
ACKNOWLEDGEMENTS
This work was supported by National Natural Science Foundation of China (Grant No.41127901), Program for Innovative Research Team in University of Ministry of Education of China(Grant No.IRT1278).
REFERENCES
1.LaCommare, K.H.; Eto, J.H. Understanding the cost of power interruptions to us electricity consumers. Lawrence Berkeley
National Laboratory 2004.
2.Venkataraman, S.; Gorur, R.S. Extending the applicability of insulator flashover models by regression analysis. Ieee
Transactions on Dielectrics and Electrical Insulation 2007, 14,
368-374.
3.Teng, Y. Research on power grid contaminated flashover prediction system. Shen yang University of Technology, 2009. 4.Cyranoski, D. Satellite view alerts china to soaring pollution.
Nature 2005, 437, 12-12.
5.Han, G.; Gong, W.; Quan, J.; Li, J.; Zhang, M. Study on spatial and temporal distributions of contaminants emitted by chinese new year’eve celebrations in wuhan. Environmental
Science: Processes & Impacts 2014, 16, 916-923.
6.Parrish, D.D.; Zhu, T. Clean air for megacities. Science 2009,
326, 674-675.
7.Ahmad, A.S.; Ghosh, P.S.; Ahmed, S.S.; Aljunid, S.A.K. Assessment of esdd on high-voltage insulators using artificial neural network. Electric Power Systems Research 2004, 72, 131-136.
8.Hao, W.M.; Ward, D.E.; Susott, R.A.; Babbitt, R.E.; Nordgren, B.L.; Kaufman, Y.J.; Holben, B.N.; Giles, D.M. Comparison of aerosol optical thickness measurements by modis, aeronet sun photometers, and forest service handheld sun photometers in southern africa during the safari 2000 campaign. International Journal of Remote Sensing 2005, 26, 4169-4183.
9.Han, G.; Gong, W.; Ma, X.; Xiang, C.; Liang, A.; Zheng, Y. A ground-based differential absorption lidar for atmospheric vertical co2 profiling. Acta Phys. Sin. 2015, 64, 244206. 10.Duncan, B.N.; Prados, A.I.; Lamsal, L.N.; Liu, Y.; Streets, D.G.; Gupta, P.; Hilsenrath, E.; Kahn, R.A.; Nielsen, J.E.; Beyersdorf, A.J., et al. Satellite data of atmospheric pollution for u.S. Air quality applications: Examples of applications, summary of data end-user resources, answers to faqs, and common mistakes to avoid. Atmospheric Environment 2014, 94, 647-662.