A NEW PERSISTENT SCATTER NETWORK CONSTRUCTION ALGORITHM FOR
PERSISTENT SCATTER INSAR AND ITS APPLICATION TO THE DETECTION OF
URBAN SUBSIDENCE
Xiaojun Luo, Dingfa Huang, Guoxiang Liu, Letao Zhou, Keren Dai
Dept. of Remote Sensing & Geospatial Information Engineering, Southwest Jiaotong University, Chengdu, China
[email protected]
Keywords: persistent scatters, three-dimensional persistent scatter Delaunay network, de-correlations, atmospheric delays, urban
subsidence
Abstract:
To extremely eliminate atmospheric delays for improving the accuracy of persistent scatter InSAR, the algorithm for constructing three-dimensional Delaunay network of global positioning system (GPS) stations is introduced to construct three-dimensional persistent scatter Delaunay network. The comparison with two-dimensional persistent scatter network indicates that three-dimensional Delaunay network is stable and avoids the affect of landscape conversion from geography space to image space. The urban subsidence of Lujiazui in Shanghai during 1992-2002 was effectively detected with InSAR based on three-dimensional persistent scatter Delaunay network. The result shows that persistent scatter InSAR based on three-dimensional persistent scatter Delaunay network can be used to efficiently and accurately detect ground deformation. The comparison with Leveling and InSAR based on persistent scatter planar network indicates that the accuracy and reliability of InSAR based on three-dimensional persistent scatter Delaunay network are significantly improved.
1. INTRODUCTION
Differential synthetic aperture radar interferometry (DInSAR) is a potential technique for monitoring minor ground deformation because of its pantoscopic view and high spatial resolution. However, de-correlations and atmospheric delays mitigate the accuracy of DInSAR. persistent scatter InSAR promoted by Ferretti is at present regarded as one of the most efficient approach in overcoming both de-correlations and atmospheric delays (Zebker, 1992, Ferretti et al. 2000a, 2001b). In persistent scatter InSAR, the persistent scatters are first detected from time serial SAR images. Then the network of persistent scatters is constructed (Luo et al. 2008a, Liu et al. 2008). Based on the network, the neighbourhood of persistent scatters is defined along each arc, i.e., connection of the network and the increments of differential phases, called neighbouring differential phases (NDP) between two neighbouring persistent scatters are calculated. Finally, ground deformations and terrain errors are deduced from NDPs. Because of the homogeneity of atmosphere distribution in certain range, atmospheric delays are strongly correlative in small space scale such as 2km (Luo, 2007b). The NDPs accordingly eliminate most of the atmospheric delays, which is consistent with the fundament of differential GPS. Furthermore, the more closely the two persistent scatters are adjacent, the more clearly the atmospheric delays are removed from NDPs. To eliminate atmospheric effects to a maximum extent, the pair of persistent scatter decided by the network should be as far as possible to close. So it’s crucial to persistent scatter InSAR to establish an appropriate persistent scatter network.
The common simple persistent scatter network introduced first by Mora et al. (2003) is triangular irregular network (TIN) established with Delaunay algorithm. However, some isolated islands and singular points are easily generated while the arcs longer than 1km are cut from TIN (Ferretti et al. 2000a, Colesanti et al. 2003). The presence of isolated islands makes deformation detection difficult. To avoid the generation of isolated island in the network, an enhanced persistent scatter network called freely-connected network (FCN) was proposed by Liu et al. (2009). According to FCN algorithm, every persistent scatter is connected to all the others. Therefore more arcs than TIN are generated in FCN and the isolated islands and
singular points are seldom formed though the FCN is optimized by cutting the arcs longer than 1km. Furthermore, more observations are obtained from the FCN which correspondingly is useful to the network adjustment and the improvement of deformation measurement accuracy. However, FCN is constructed at the cost of computation time.
Both TIN and FCN are two-dimensional networks constructed based on the image planar coordinate system. As atmospheric delays change along both horizontal and vertical direction, the NDPs derived from the planar network mainly mitigate the horizontal atmospheric delays. Most of vertical atmospheric delays still remain in the NDPs. On the other hand, because of the special image distortion such as foreshortening in SAR, the distance on the earth surface, i.e., ground distance between two neighbouring persistent scatters is usually longer than the range decided by the image resolution. Which means that the ground distance with nominal 1km (the range threshold used to select persistent scatter pairs) in image calculated by image resolution may be much longer than 1km. So the NDPs derived from planar network can not completely eliminate the atmospheric effects.
In order to improve the correction of atmospheric effects in persistent scatter InSAR, the algorithm for constructing three-dimensional Delaunay network of GPS stations (Zhou et al. 2007) is introduced in this paper to establish three-dimensional persistent scatter Delaunay network (TDPDN). The validation of TDPDN is confirmed by detecting ground subsidence over Lujiazui in Shanghai during 1992-2002.
2. FOUNDMENTAL OF PERSISTENT SCATTER INSAR
deformation velocities between two neighbouring persistent scatters. This function can be expressed as following equation,
x
r,
x
s,
t
i
k
1q
x
r,
x
s
B
ik
2v
x
r,
x
s
t
i
r es
x
r,
x
s,
t
i
(1)Where,
x
r,
x
s,
t
i
is the NDP of neighboring persistent scattersx
r andx
s .t
i is time baseline ofinterferogram
i
, i=1,2,……,N.
sin
4
1
R
k
,
iswave length,
R
is slant range from SAR to target,
is incidence angle.
q
x
r,
x
s
is the difference of terrain errors between two neighboring PSs.B
i is the normalbaseline of interferometric image
i
.
4
2
k
.
x
rx
s
v
,
is the difference of linear deformation velocities between neighboring PSs.
r es
x
r,
x
s,
t
i
is phase residues.It’s the contribution of residual atmospheric delays, no-linear
deformations and decorrelations.
For N time serial NDPs of every pair of persistent scatters, the sets of N equations such as (1) are generated. Because residual phase
r es
x
r,
x
s,
t
i
changes with time, the equation sets are a nonlinear system, i.e., rank deficiency. Under the condition of
r es
x
r,
x
s,
t
i
, the equation sets can beresolved. The
q
x
r,
x
s
and
v
x
r,
x
s
can be estimated with bi-dimensional periodogram (Ferretti et al. 2000a, Colesanti et al. 2003) or solution-space search method (Luo et al. 2011c). Then the deformation velocities of all persistent scatters can be deduced with the network adjustment (Liu et al. 2008) or by integrating along the arc of network (Ferretti et al. 2000a, Colesanti et al. 2003). Furthermore, the nonlinear deformations of persistent scatters and atmospheric phase screen (APS) with respect to singular SAR image or interferogram are filtered out from the NDPs. Finally, the time serial deformations of all persistent scatters and regional deformation field can be deduced.The accuracy of deformations estimated from NDPs depends on the degree that atmospheric delays and decorrelations are removed from NDPs. As long as two neighbouring persistent scatters defined by network are adjacent to the greatest extent in the geography space, most of atmospheric delays and decorrelation errors will be eliminated from the two neighbouring persistent scatters. So an appropriate network and
optimal neighbourhood are crucial to persistent scatter InSAR. In order to achieve this goal, the three-dimensional persistent scatter Delaunay network is presented.
3. THREE-DIMENSIONAL PERSISTENT SCATTER DELAUNAY NETWORK
3.1 The problem of persistent scatter planar network
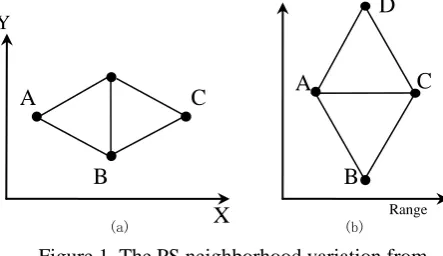
Persistent scatter planar network is a two-dimensional network constructed based on image planar coordinates. The structure of planar network is seriously affected by SAR projection and image resolution. On the one hand, the azimuth resolution of SAR images is usually higher than slant range resolution. That means the real geography landscape will be stretched in radar flight direction, i.e., azimuth direction while landscape is imaged by SAR. By contrast, the target space relationship defined by the network established in geography space will be different from that derived from image space because the sites and space relationship of targets vary with the scene conversion from geography space to image space. Figure 1 indicates the variation of target relationship from geography space to image space. Figure (a) is the Delaunay network of four persistent scatter targets in geography space and figure (b) shows the Delaunay network in image space. The persistent scatter B and D are connected in geographic Delaunay network but the link is cut in image space. On the other hand, the SAR image distortions such as foreshortening produced by radar slant range projection may result in the false selection of neighbouring persistent scatters. As figure 2 illustrates, because of SAR image foreshortening, the ground distance D between PS1 and PS2 is much longer than the range d computed with
image resolution. The foreshortening ratio ((D-d)/D) increases with the decrease of local incidence angle. When the local incidence angle is zero, foreshortening ratio gets to its extreme, i.e., the whole slope is imaged as a point. The foreshortening causes that the real geography distance of two neighbouring persistent scatters selected according to 1km interval is usually much longer than 1km. So some persistent scatter pairs with longer than 1km in geographic space, called false persistent scatter pairs exist in persistent scatter planar network constructed based on image coordinate system. The NDPs of false persistent scatter pairs remain atmosphere residues that will correspondingly mitigate the accuracy of persistent scatter InSAR.
A
B
C
A
B
C
D
X
Range(a) (b)
Y
1
PS
2
PS
d
D
1
p
p
21
R
R
2Figure 2. The slant range projection
illustration of SAR
3.2 Construction of three-dimensional persistent scatter Delaunay network
To make the relationship of persistent scatter pairs consistent with geography space, the three-dimensional Delaunay network algorithm (Zhou et al. 2007) is introduced to construct persistent scatter network. After persistent scatters are identified from time serial radar images, the geodetic coordinates of persistent scatters are derived from the DEM interferometry with two tandem images and the geodetic height H is interpolated from external DEM such as SRTM DEM. Then the geodetic coordinates (LBH) are transformed to Cartesian coordinates (XYZ). Finally, the three-dimensional persistent scatter Delaunay network based on Cartesian coordinate system is constructed with three-dimensional Delaunay network algorithm. This network is further reformed by cutting the arc longer than 1km. The optimised network is then used to establish persistent scatter pairs.
To show the difference between three-dimensional Delaunay network and two-dimensional network, the comparison of the two kinds of network is conducted by simulating in Matlab. The simulated images are demonstrated in figure 3. Geographic
terrain is firstly simulated with Matlab peaks function. The simulated geographic terrain is showed as surface image in figure (a). Then 51 points are randomly selected as persistent scatters. The two-dimensional network (figure (b)) and three-dimensional network (figure (c)) of 51 persistent scatters are constructed respectively according to planar coordinates (XY) and Space rectangular coordinates (XYZ). From the view of shape and structure, two-dimensional network are significantly different from three-dimensional network. The number of triangles is 89 in two-dimensional network but it’s 91 in three-dimensional network. That means persistent scatter pairs formed by two-dimensional network are less than that formed by three-dimensional network. Furthermore, the three-dimensional network established with persistent scatter geographic coordinates is fixed as long as the geographic coordinates of persistent scatters are determined. Correspondingly, the persistent scatter neighbourhood derived from the three-dimensional network are definite. On the contrary, the neighbourhood in two-dimensional network established in image coordinate system are varied with the image resolution and projection while the geographic scene is converted to image.
Figure 3. The Delaunay networks generated respectively by planet coordinates and three-dimensional coordinates
4. EXPERIMENTAL DATASET AND RESULTS
4.1 Experimental dataest
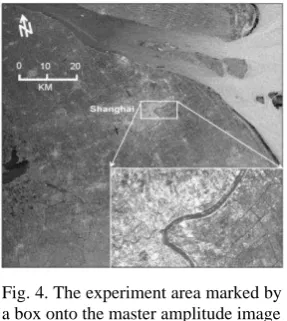
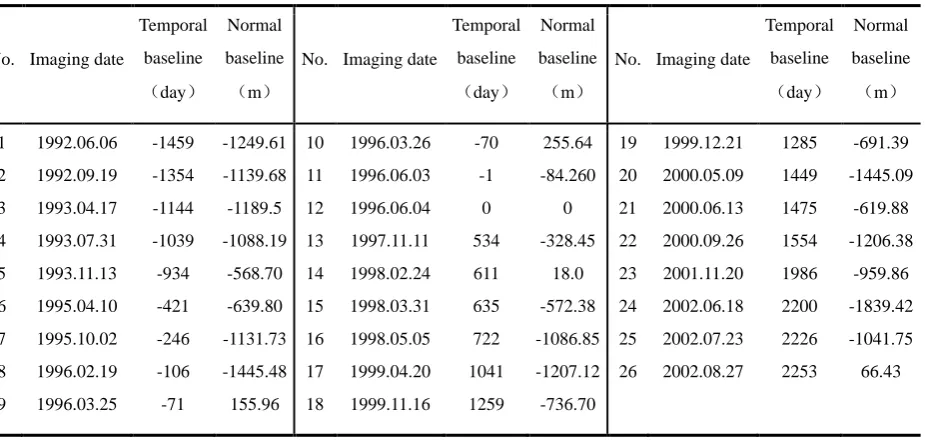
In the last century, the urban area of Shanghai was found beginning to subside because of the excessive exploitation of underground water (Zhang, 2002, Zhang, 2005, Ye et al. 2005). InSAR based on three-dimensional persistent scatter network and two-dimensional network respectively is used to detect the ground subsidence of Lujiazui in Shanghai. Figure 4 displays the experimental area of interest (AOI) marked by a box onto the master amplitude image, where the inset shows the enlarged multi-image reflectivity map derived by averaging all the image patches of the AOI. The AOI covers the rectangle geographic scope ranging from 121.44584°E to 121.58915°E and 31.20618°N to 31.288°N. The total area is about 33km2. 26 single look complex (SLC) SAR images taken by ERS-1/2 during 1992 through 2002 are utilized. The SAR image taken by ERS-2 on Jun 4, 1996 was chosen as the common master image and the remaining 25 images were used as the slave images. Thus
25 differential interferograms were generated by the
“two-pass” method (Gabriel et al. 1989, Massonnet et al.
1993, Zebker et al. 1994b). Table 1 lists the parameters of all the images, including spatial and temporal baseline with respect to the master image.
Fig. 4. The experiment area marked by a box onto the master amplitude image (a) The surface generated
by Peaks function in Matlab
(b) Planar Delaunay network
6.3781 6.3782
6.3782 6.3782
6.3782 6.3782
6.3782 6.37826.3782
x 106
6.3781 6.3781 6.3782 6.3782 6.3782 6.3782 6.3782 6.3782 6.3782 6.3782
x 106 6.3782 6.3782 6.3782 6.3782
x 106
X Y
Z
6.3782 6.3782 6.3782 6.3782 6.3782 6.3782 6.3782 x 10⁶
4.2 Experimental results
orthoimage download from GoogleEarth. The two-dimensional Delaunay network and three-dimensional Delaunay network of 1520
persistent scatters
are constructed based on image planar coordinates and Cartesian coordinates respectively. Figure 6 demonstrates the two-dimensional network reformed by 1km threshold. 4092 arcs, i.e., 4092 NDP observations are obtained from the planar network. Figure 7 shows the planar projection of three-dimensional network optimized with 1km threshold. 4502 arcs are generated in this network. The number of NDP observations of TDPDN is significantly more than that of planar network. Based onpersistent scatter
InSAR algorithm, the subsidence ofpersistent scatter
s is derived according to two-dimensional network and three-dimensional network respectively. The statistics of subsidence is displayed in table 2. The maximum subsidence velocity detected with two-dimensional network is 21.0 mm/a and the minimum is 6.0 mm/a, and the average subsidence velocity is 16.8 mm/a. The maximum and minimum subsidence velocities achieved by TDPDN are 18.3 mm/a and 7.8 mm/a respectively, and the average subsidence velocity is 13.7 mm/a.Table 1. The parameters of 26 ERS-1/2 SAR images used in this study.
No. Imaging date Figure 5. PSs superimposed onto an optical orthoimage
N
Figure 7. Projection of three-dimensional network on two-dimensional plane in study area Figure 6. Two-dimensional Delaunay
Table 2. Subsidence velocities of 1520
persistent scatter
s detected by Leveling andpersistent scatter
InSARrespectively based on planar network and TDPDN
Measurement type
Maximum
(mm/a)
Minimum
(mm/a)
Average
(mm/a)
leveling
InSAR with planar network
InSAR with TDPDN
15.0
21.0
18.3
12.0
6.0
7.8
12.6
16.8
13.7
In recent years, both precise leveling and GPS survey have been carried out to monitor subsidence in Shanghai by some authorities (Liu et al. 1998a, Liu, 2000b). The leveling (see Table 2) shows the subsidence rates from 1992 to 2002 in the study area range from 12.0 to15.0 mm/a, and the averaged subsidence rate reaches 12.6 mm/a (Yan et al. 2002). Table 2 shows the annual subsidence rates estimated with InSAR based on TDPDN are in good agreement with the leveling subsidence results reported in some open literature (Liu et al. 1998a, Liu, 2000b). This indicates that InSAR with TDPDN is effective for detecting land subsidence in Shanghai. Furthermore, TDPDN is more advantageous than
persistent scatter
planar network in terms of accuracy and reliability of estimating subsidence rates atpersistent scatter
s. For one thing, TDPDN has more connections (arcs) between adjacentpersistent scatter
s than planar network in the study area which means the total number of redundant observations in TDPDN is larger than that in planar network. Hence the LS estimator for TDPDN is less disturbed by outliers. For another, also the most important, the adjacency established by TDPDN really reflectspersistent
scatter
target geographic relationship that varies with terrain. The atmospheric delays in NDPs of adjacentpersistent
scatter
s derived from optimized TDPDN with 1km threshold is to be eliminated to an extreme extent. In other words, the accuracy and reliability of InSAR with TDPDN are significantly improved.Finally, the time series of subsidence was obtained as a
sum of linear and nonlinear parts through InSAR with
TDPDN. As examples, Figure 8 shows the temporal
evolution of subsidence at 5 persistent scatters (see
Figure 5) in the central part of the study area, where
about 15-cm land sinking was accumulated from 1992 to
2002. For visualization, a perspective view of the entire
subsidence field is shown in Figure 9, where the
remarkable sinking parts can be better appreciated.
Maximum and minimum subsidence values are -18 and
-9 cm, respectively. The current land sinking is highly
related to the large-scale urban construction and the
overuse of groundwater. Especially from 1992 to 1995,
the skyscrapers’ constructions are most remarkable
(Liu
et al. 1998a). It should be noted that the estimated
vertical displacement may also contain the settlement of
skyscrapers, and not purely the natural subsidence of the
land surface. The annual subsidence rate is however
much smaller than that occurri
ng in the 1980’s. This is
primarily attributed to some mitigation strategies which
include reducing groundwater withdrawal, increasing
river water use, pumping water back into depleted
aquifers, and utilizing light materials for construction.
5. CONCLUSIONS
In order to improve the accuracy of
persistent scatter
InSAR, the approach for constructing three-dimensionalpersistent
scatter
Delaunay network is promoted based on the algorithm for establishing three-dimensional GPS network. The TDPDNFigure 8. Time series of subsidence at 5
PSs as marked in Figure 5
is constructed based on Cartesian coordinates system of
persistent scatters
. As long as the geography scene is determined, the TDPDN is fixed. In another word, it will not vary with the geographic scene conversion from geography space to image space. Thepersistent scatter
adjacency relationship derived by TDPDN is stable and consistent with that in geography space. The InSAR with TDPDN was effectively used to monitor the urban subsidence of Lujiazui in Shanghai. The comparison with Leveling and InSAR withpersistent scatter
planar network indicates that the accuracy and reliability of InSAR with TDPDN are significantly improved.REFERENCES
Colesanti, C., Ferretti, A., Prati, C., Rocca, A., 2003. Monitoring landslides and tectonic motions with the Permanent Scatterers Technique. Engineering Geology, 68, pp. 3-14. Ferretti, A., Claudio, P., Rocca, A., 2000a. Nonlinear subsidence rate estimation using persistent scatters in differential SAR interferometry. IEEE Transactions on Geoscience and Remote sensing, 38(5), pp. 2202-2212. Ferretti, A., Claudio, P., Rocca, A., 2001b. Persistent scatters in SAR interferometry. IEEE Transactions on Geoscience and Remote sensing, 39(1), pp. 8-20.
Gabriel, A.K, Goldstein, R.M., Zebker, H.A., 1989. Mapping small elevation changes over large areas—differential radar interferometry. J. Geophys. Res, 94, pp. 9183-9191.
Liu, G.X., Luo, X.J., Chen, Q., Huang, D.F., Ding, X.L., 2008. Detecting land subsidence in Shanghai by PS-Networking SAR interferometry. sensors, 8, pp. 4725-4741.
Liu, Y., Zhang, X.L., Wan, G.F., Han, Q.D., 1998. The situation of land subsidence within Shanghai in recent years and its countermeasure. Chin. J. Geol. Hazard Control, 9(2), pp. 13-17.
Liu, Y., 2000. Preventive measures for land subsidence in Shanghai and their effects. Volcanology & Mineral Resources , 21 (2), pp. 107-111.
Luo, X.J., Liu, G.X., Huang, D.F., Chen, Q., 2008a. Modelling with persistent-scatterer network and analysis of ground deformation and atmospheric influence. Journal of Remote Sensing, 12(2), pp. 270-276.
Luo, X.J., 2007b. Theory of differential SAR interfoermetry based on permanent scatterers and applications to Shanghai’s
subsidence detection. Southwest Jiaotong University, Chengdu, pp.106-157.
Massonnet, D., Rossi, M., Carmona, C., 1993. The displacement field of the landers earthquake mapped by rader interferometry. Nature, 364, pp. 138-142.
Yan, X.X., Gong, S.L., Zen, Z.Q., Yu, J.Y., Shen, G.P., Wang, T.J., 2002. Relationship between building density and land subsidence in Shanghai urban zone. Hydrogeology and Engineering Geology, 6, pp. 21-25.
Ye, S.J., Xue, Y.Q., Zhang, Y., Li, Q.F., Wang, H.M., 2005. Study on the deformation characteristics of soil layers in regional land subsidence model of Shanghai. Chinese Journal of Geotechnical Engineering, 27(2), pp. 140-147.
Zebker, H.A., Villaseno, J., 1992a. Decorrelation in interferometric radar echoes. IEEE Transactions on Geoscience and Remote Sensing, 30 (5), pp. 950-959.
Zebker, H.A., Roser, P.A., Goldstein, R.M., 1994b. On the derivation of coseismic displacement fields using differential radar interferometry-the Landers earthquake. J .Geophys. Res, 99, pp. 19617-19634.
Zhang, W.R., 2002. Feature of Shanghai land subsidence and its damage to social-economic system. Journal of Tongji University (Natural Science), 30(9), pp. 1129-1134.
Zhang, A.G., 2005. Sustainable development and land subsidence controlling management in shanghai. The Chinese Joural of Geological Hazard and Control, 16(1), pp. 1-4. Zhou, L.T., Huang D.F., Li, C.G., Xu, R., 2007. Algorithms for spherical delaunay triangulated irregular network update and its application in GPS network. Science of Surveying and Mapping, 2007, 32(6), pp. 77-78.
ACKNOWLEDGEMENTS