In this chapter, the writer presented the data which had been collected from the research in the field of study. The data were the result of experiment and control class, the result of post-test experiment and control class, result of data analysis, and interpretation.
A.Description of the Data
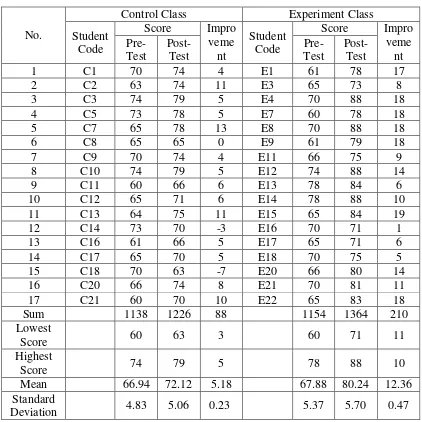
1. The result of Pre-Test and Post- Test score of Experiment and Control Class
The Pre- test and Post- test at the control class had been conducted on August, 6th 2014 (Wednesday, at time 06.30-08.00) for Pre-test and August, 16th 2014 (Saturday, at time 12.30-13.30) for Post- test in class X-1 of SMA Muhammadiyah-1 Palangka Raya with the number of student was 22 students. Then the experiment class had been conducted on August, 6th 2014 (Wednesday, at time 10.00-11.30) for Pre-test and August, 18th 2014 (Monday, at time 08.00- 09.30) for Post- test in the class X-4 of SMA Muhammadiyah-1 Palangka Raya with the number of student was 22 students. The Pre- Test and Post- Test scores of both of class were presented in table 4.1 and 4.2:
Table 4.1 the Pre- Test and Post- Test Scores of Bright Students of Experiment and Control Class
No.
Control Class Experiment Class Student
Code
Score Impro veme
nt
Student Code
Score Impro veme nt Pre-Test Post- Test Pre-Test Post- Test
1 C1 70 74 4 E1 61 78 17
2 C2 63 74 11 E3 65 73 8
3 C3 74 79 5 E4 70 88 18
4 C5 73 78 5 E7 60 78 18
5 C7 65 78 13 E8 70 88 18
6 C8 65 65 0 E9 61 79 18
7 C9 70 74 4 E11 66 75 9
8 C10 74 79 5 E12 74 88 14
9 C11 60 66 6 E13 78 84 6
10 C12 65 71 6 E14 78 88 10
11 C13 64 75 11 E15 65 84 19
12 C14 73 70 -3 E16 70 71 1
13 C16 61 66 5 E17 65 71 6
14 C17 65 70 5 E18 70 75 5
15 C18 70 63 -7 E20 66 80 14
16 C20 66 74 8 E21 70 81 11
17 C21 60 70 10 E22 65 83 18
Sum 1138 1226 88 1154 1364 210
Lowest
Score 60 63 3 60 71 11
Highest
Score 74 79 5 78 88 10
Mean 66.94 72.12 5.18 67.88 80.24 12.36
Standard
Deviation 4.83 5.06 0.23 5.37 5.70 0.47
Based on the result above, mean of control class who taught using conversional teaching was from 66.94 in pre-test to 72.52 in post-test. Then mean of experiment class was from 67. 88 in pre-test before the writer applied picture media in teaching writing descriptive text and after the writer applied picture media, mean of post- test in experiment class was 80.24. It can be concluded that, mean of bright level of students’ achievement of class X-1 as control class and X-4 as experiment class increased from pre- test to post- test.
Table 4.2 the Pre- Test and Post- Test Scores of Low students of Experiment and Control Class
No.
Control Class Experiment Class Student
Code
Score impro veme nt
Student Code
Score Impro veme nt Pre Test Post Test Pre Test Post Test
1 C4 58 70 12 E2 54 75 21
2 C6 58 70 12 E5 58 83 25
3 C15 56 61 5 E6 56 74 18
4 C19 56 70 14 E10 54 78 24
5 C22 56 61 5 E19 58 70 12
Sum 284 332 48 280 380 100
Lowest
Score 56 61 5 54 70 16
Higher
Score 58 70 12 58 83 25
Mean 56.8 66.4 9.6 56 76 20
Standard
Deviation 1.09 4.93 2 4.85
mean of low level of students’ achievement of class 1 as control class and X-4 as experiment class increased from pre- test to post- test.
B. Result of Data Analysis
1. Testing of Normality and Homogeneity
The researcher was calculated the result of pre-test and post-test score of experiment and control class by using SPSS 17.0 program. It is used to know the normality of the data that is going to be analyzed whether both groups have normal distribution or not. Also homogeneity is used to know whether experiment group and control group, that are decided, come from population that has relatively same variant or not.
a. Testing of Normality and Homogeneity of Pre- Test of Experiment and Control Class
Table 4.3 Testing of Normality One-Sample Kolmogorov-Smirnov Test Experiment Control
N 22 22
Normal Parametersa,,b Mean 65.5455 64.6364
Std. Deviation 7.14294 6.07529 Most Extreme
Differences
Absolute .111 .130
Positive .111 .112
Negative -.106 -.130
Kolmogorov-Smirnov Z .521 .608
Asymp. Sig. (2-tailed) .949 .854
Based on the calculation used SPSS program, the asymptotic significant normality of experiment class 0.949 and control class was 0.854. Then the normality both of class was consulted with table of Kolmogorov- Smirnov with the level of significant 5% (α=0.05). Since asymptotic significant of experiment=0.949 α=0.05, and asymptotic significant of control= 0.854 ≥ α= 0.05. It could be concluded that the data was normal distribution.
Table 4.4 Testing of Homogenity Levene's Test of Equality of Error Variancesa
Dependent Variable: Achivement
F df1 df2 Sig.
4.190 3 40 .112
Tests the null hypothesis that the error variance of the dependent variable is equal across groups.
Based on the result of homogeneity test, the Fvalue was 4.190 and the
significant value was 0.112. The data are homogeneous if the significant value is
higher than significant level α= 0.05. Since the significant value (0.112) was
b. Testing of normality and homogeneity for post-test of experiment and control class
Table 4.5 One-Sample Kolmogorov-Smirnov Test
Experiment Control
N 22 22
Normal Parametersa,,b Mean 79.2727 70.8182 Std. Deviation 5.89739 5.49143 Most Extreme
Differences
Absolute .129 .168
Positive .129 .105
Negative -.112 -.168
Kolmogorov-Smirnov Z .606 .788
Asymp. Sig. (2-tailed) .856 .563
a. Test distribution is Normal. b. Calculated from data.
Based on the calculation used SPSS program, the asymptotic significant normality of experiment class was 0.856 and control class was 0.536. Then the normality both of class was consulted with table of Kolmogorov- Smirnov with the level of significant 5% (α= 0.05). Since asymptotic significant experiment=0.856 ≥ α= 0.05, and asymptotic significant control= 0.563 ≥ α=
0.05. It could be concluded that the data was normal distribution.
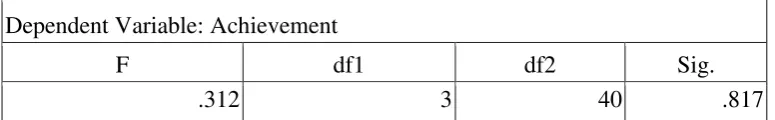
Table 4. 6 Testing Homogeneity Levene's Test of Equality of Error Variancesa
Dependent Variable: Achievement
F df1 df2 Sig.
.312 3 40 .817
Based on the result of homogeneity test, the Fvalue was 0.312 and the
significant value was 0.817. The data are homogeneous if the significant value is
higher than significant level α= 0.05. Since the significant value (0.817) was
higher than significant level α= 0.05, it could be concluded that the data are homogeneous. It meant that both of classes have same variants.
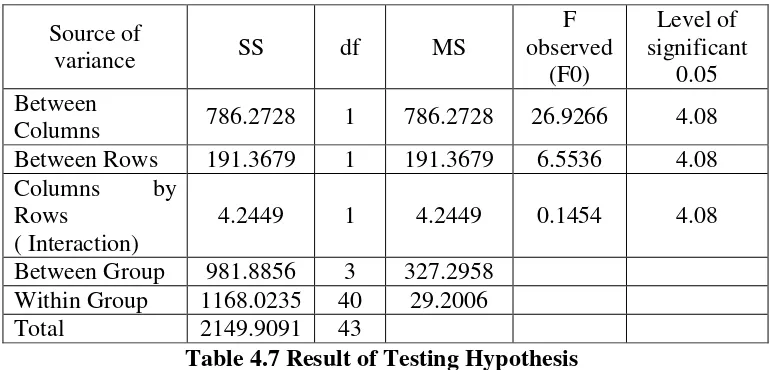
2. Testing Hypothesis
The researcher used Two- Ways ANOVA to test the hypothesis with significant level α= 0.05. The researcher used manual calculation and SPSS 17.0 Program to test the hypothesis using Two-ways ANOVA. The criteria of Ha was accepted when F0 > F table, and H0 was refused when F0 < F table. The
result of testing hypothesis explained in table 4.11.
Table 4.7 Result of Testing Hypothesis
1. First, based on the calculation above used manual calculation and SPSS program, the F observed between columns was 26.9266. Then it was consulted with Ftable of with the level of significant 5% so Ftable = 4.08. Since F0
Source of
variance SS df MS
F observed
(F0)
Level of significant
0.05 Between
Columns 786.2728 1 786.2728 26.9266 4.08 Between Rows 191.3679 1 191.3679 6.5536 4.08 Columns by
Rows
( Interaction)
4.2449 1 4.2449 0.1454 4.08 Between Group 981.8856 3 327.2958
=26.9266 > F table= 4.08, the difference between columns was significant. It
could be concluded that using picture media toward bright level students’ achievement in writing descriptive text was significant effect. Thus, Ha that stating using picture media gave significant effect for bright students in writing descriptive text at first year students at SMA Muhammadiyah-1 Palangka Raya was accepted and H0 that stating using picture media did not give significant effect for bright students in writing descriptive text at first year students at SMA Muhammadiyah-1 Palangka Raya was rejected. 2. Second, the F observed between rows was 6.5536which consulted with Ftable
with the level of significant 5%, Since the F observed = 6.5536> F table = 4.08, the difference between rows was significant. It could be concluded that using picture media toward low level students’ achievement in writing descriptive text was significant effect. Therefore, Ha stated that using picture media gave significant effect for low students in writing descriptive text at first year students at SMA Muhammadiyah-1 Palangka Raya was accepted and H0 that stating using picture media did not give significant effect for low students in writing descriptive text at first year students at SMA Muhammadiyah-1 Palangka Raya was rejected.
C.Interpretation of The F-Ratios
The hypothesis testing used Two-ways ANOVA to measure the significant effect of using picture media toward bright of students’ achievement in writing descriptive text. First, based on the manual calculation and SPSS 17 program of Two-ways ANOVA the F0= 26.9266 was consulted with F table with significant level 5% (F table= 4.08). Therefore, F0 (26.9266) < F table (4.08). It could be concluded that using picture media toward bright level students’ achievement in writing descriptive text was significant. The result of using picture media toward bright level students’ achievement in writing descriptive had better mean (79.27) than student’s who taught without picture with mean (70.81).
Then second F- ratio, which F0=6.5536 was more than F table on significant level 5% (F table= 4.08) is significant at the level 5% (F= 4.08), based on comparison of achievement of the subject in bright of experiment class and bright level of control class with achievement of the subject in low level of experiment class and low level of control class. Therefore, it can summary that the difference achievement between the performance of those subject in bright level and the subject in low level of both classes in writing descriptive text is beyond expectation. It showed on table 4.7 that bright level of experiment class and control class have obtained a combined mean (76.27) as compared with mean (71,2) for low level of experiment and control group.
taught by picture media, which testing hypothesis used Two-ways ANOVA. Based on the calculation of Two-ways ANOVA, F0 = 0.1454. It was consulate with F table with level of significant 5% (F table= 4.08) Since the F0= 0.1454 < F table = 4.08. It could be concluded that no significant interaction using picture media toward bright and low level students’ achievement in writing descriptive text. It meant that the effect of using picture media in teaching writing descriptive text did not depend on the students’ level achievement.