CHAPTER IV RESULT OF THE STUDY
In this chapter, the researcher presented the data which had been collected from the research in the field of study. The data were the result of experiment and control class, the result of post-test experiment and control class,
result of data analysis, and discussion.
A.Description of the Data
1. The result of Pre-Test score of the Experiment and Control Class
Before conducting the pre- test, the researcher divided the subject into two categories : high and low motivation groups based on intrinsic motivation test as
presented in appendix 7. The number of subject was presented in table 4.1, the subject categorized in high motivation and low motivation. It can said high
motivation if the students got > 40% on motivation and low motivation if they got < 40 %.1 The table below, there were result score of intrinsic motivation.
Table 4.1 The Category of Motivation Class Experiment and Control
No Class Category Number
1 Experiment
High Motivation 28
Low Motivation 5
2 Control
High Motivation 28
Low Motivation 5
1
Total of Subject 66
From the table above, there were 28 subject in high motivation at
experiment and control class which the students got > 40% on motivation. There were 5 subject with low motivation at experiment and control class which the
students got < 40%. The Pre- Test at the control class conducted on August, 26th 2014 (Tuesday, at time 11.30-12.50) in class VIII-6. The number of student was 33 students. Then the experiment class conducted on August, August, 26th 2014
(Tuesday, at time 08.20-09.55) in the class VIII-7 with the number of student was 33 students. The Pre-test scores of both of class were presented in table:
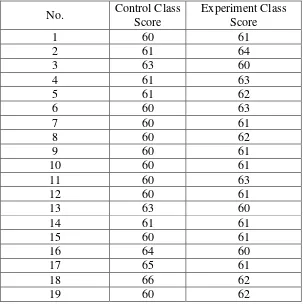
Table 4.2 The Pre- Test Scores of High Motivation Students of Experiment and Control Class
No. Control Class Score
Experiment Class Score
1 60 61
2 61 64
3 63 60
4 61 63
5 61 62
6 60 63
7 60 61
8 60 62
9 60 61
10 60 61
11 60 63
12 60 61
13 63 60
14 61 61
15 60 61
16 64 60
17 65 61
18 66 62
20 60 60
21 60 60
22 63 60
23 60 62
24 60 61
25 60 63
26 63 62
27 60 62
28 60 60
Sum 1711 1719
Lowest score 60 60
Highest score 66 64
Mean 61.1 61.39
Standard deviation 1.75 1.1
The researcher got the result of the data by using manual calculation and SPSS 20. The data presentation of experiment and control class showed the
table frequency distribution of pre- test score.
Based on the result of research in class VIII-6 as control class and VIII-7 as experiment class before being taught by basic questioning technique
with picture media in writing recount text. The highest pre- test score of high motivation control class was 66 and the lowest score of high motivation control
class was 60with sum of the data was 1711, mean was 61.1, with standard deviation (S) was1.75. In contrary, the highest score of high motivation experiment class was 64 and the lowest score of the experiment class was 60
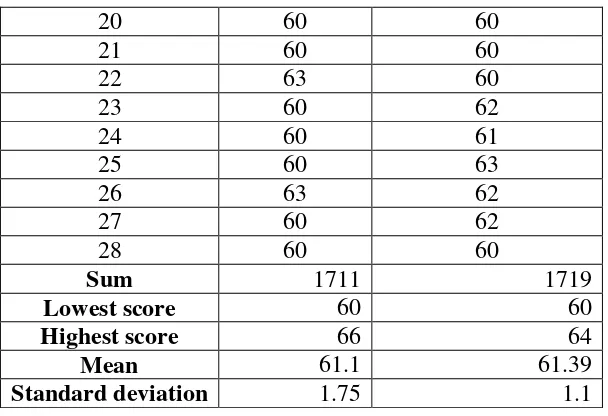
Table 4.3 The Pre- Test scores of Low Motivation Students of Experiment and Control Class
No. Control Class
Score
Experiment Class Score
1 60 62
2 60 60
3 60 62
4 62 61
5 60 60
Sum 302 305
Lowest
score 60 60
Higher
score 62 62
Mean 60.4 61
Standard
deviation 0.8 0.89
Based on the result of research in class VIII-6 as control class and
VIII-7 as experiment class before being taught by basic questioning technique with picture media in writing recount text. The highest pre- test score of low
motivation student control class was 62 and the lowest score of low motivation control class was 60 with sum of the data was 302, mean was 60.4, with standard deviation (S) was 0.8. In contrary, the highest score of low experiment
class was 62 and the lowest score of the experiment class was 60 with sum of the data was 305, the mean was 61 with Standard deviation (S) was 0.89.
2. Result of Post-Test of Control and Experiment Class
The test of Post- Test score at the control class conducted on
with the number of student was 33 students. The Pre-test scores of both of class
were presented in table 4.4 and 4.5:
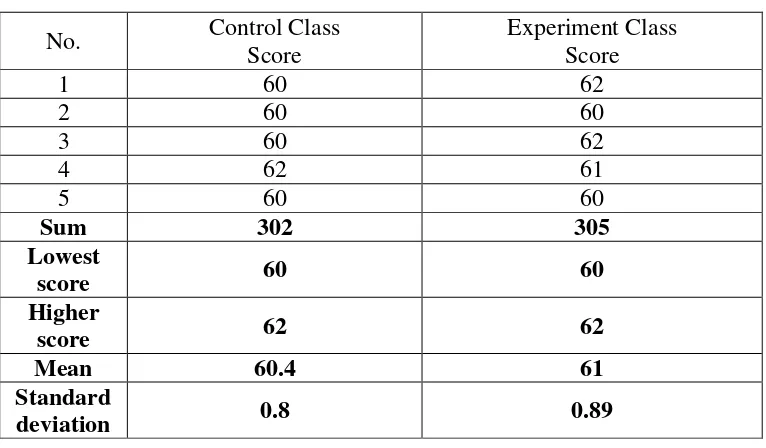
Table 4.4 the of Post- Test Scores of High Motivation Students of Experiment and Control Class
No. Control class Score
Experiment class Score
1 70 80
2 70 79
3 72 84
4 69 79
5 70 81
6 66 80
7 69 78
8 66 77
9 69 83
10 67 79
11 66 85
12 68 82
13 64 78
14 72 84
15 64 84
16 72 77
17 65 83
18 74 78
19 76 80
20 65 84
21 68 83
22 66 78
23 71 87
24 65 84
25 64 85
26 68 84
27 72 83
28 69 78
Sum 1917 2277
Lowest score 64 77
Highest score 76 87
Mean 68.46 81.32
The researcher got the result of the data by using manual calculation and SPSS 20. The data presentation of experiment and control class showed
the table frequency distribution of post- test score, measurement of central tendency (mean, median, and mode)(see on appendix 7) Standard deviation.
Based on the result of research in class VIII-6 as control class which taught by convensional teaching. The highest post-test score of high motivation of control class was 76 and the lowest score was 64 with sum was 1917, so the
mean was 68.46 and standard deviation (S) was 16.02. Whereas, VIII-7 as experiment class after being taught by basic questioning technique with picture
in writing recount text. The highest score of low motivation of experiment class was 87, and the lowest score of low motivation of experiment class was 77, with sum was 2277. So, the mean is 81.32 and Standard deviation (S) was
2.85.
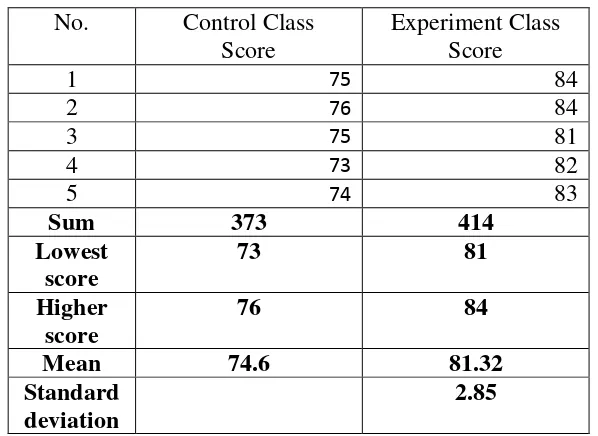
Table 4.5 the of Post- Test Scores of Low Motivation Students of Experiment and Control Class
No. Control Class Score
Experiment Class Score
1 75 84
2 76 84
3 75 81
4 73 82
5 74 83
Sum 373 414
Lowest score
73 81
Higher score
76 84
Mean 74.6 81.32
Standard deviation
Based on the result of research in class VIII-6 as control class which
taught by convensional teaching. The highest post-test score of low motivation students of control class was 73 and the lowest score was 76 with sum was 373,
so the mean was 74.6 and standard deviation (S) was 1.05 . Whereas, VIII-7 as experiment class after being taught by basic questioning techniqque with picture in writing recount text. The highest score of low motivation students of
experiment class was 84, and the lowest score was 81, with sum was 414. So, the mean was 81.32 and Standard deviation (S) was 2.85.
3. The Comparison Result of Pre-Test and Post- Test Score of Experiment Class
The comparison pre-test and post test score of teaching recount text
using basic questioning technique with picture.
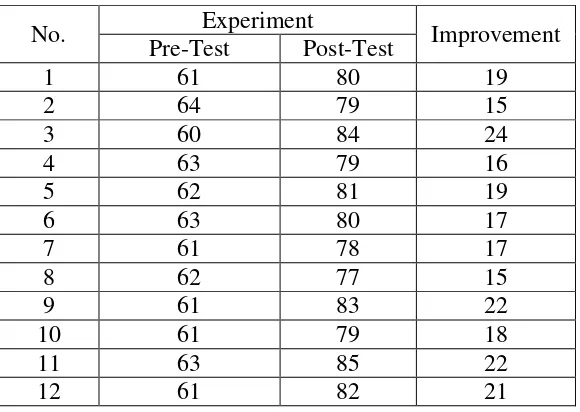
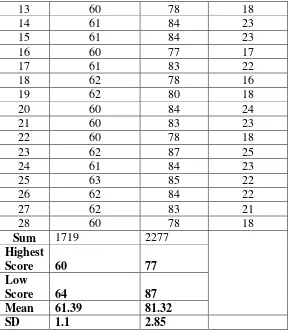
Table 4.6 The Comparison Result of Pre- Test and Post- Test Score of High MotivationExperiment Class
No. Experiment Improvement
Pre-Test Post-Test
1 61 80 19
2 64 79 15
3 60 84 24
4 63 79 16
5 62 81 19
6 63 80 17
7 61 78 17
8 62 77 15
9 61 83 22
10 61 79 18
11 63 85 22
13 60 78 18
14 61 84 23
15 61 84 23
16 60 77 17
17 61 83 22
18 62 78 16
19 62 80 18
20 60 84 24
21 60 83 23
22 60 78 18
23 62 87 25
24 61 84 23
25 63 85 22
26 62 84 22
27 62 83 21
28 60 78 18
Sum 1719 2277
Highest
Score 60 77
Low
Score 64 87
Mean 61.39 81.32
SD 1.1 2.85
Table 4.7 The Comparison Result of Pre- Test and Post- Test Score of High Motivation Experiment Class
No. Experiment Improvement
Pre- Test Post- Test
1 62 84 22
2 60 84 24
3 62 81 19
61 82 21
60 83 23
Sum 305 414
Highest Score 62
84 Low
Score 60 81
Mean 61 82.8
Standard
B. Result of Data Analysis
1. Testing of Normality and Homogeneity
The researcher was calculated the result of pre-test and post-test score
of experiment and control class by using SPSS 20.0 program. It is used to know the normality of the data that is going to be analyzed whether both groups have normal distribution or not. Also homogeneity is used to know
whether experiment group and control group, that are decided, come from population that has relatively same variant or not.
a. Testing of Normality and Homogeneity of Pre- Test of Experiment and Control Class
Table 4.8 One-Sample Kolmogorov-Smirnov Test
Experiment Control
N 28 28
Normal Parametersa,b Mean 61.3929 61.1071
Std. Deviation 1.13331 1.74991
Most Extreme Differences
Absolute .207 .344
Positive .207 .344
Negative -.132 -.263
Kolmogorov-Smirnov Z 1.095 1.819
Asymp. Sig. (2-tailed) .181 .3
a. Test distribution is Normal.
b. Calculated from data.
Based on the calculation used SPSS 20 program, the asymptotic
significance of experiment was 0.181, α = 0.05, and asymptotic significance of control= 0.3 ≥ α= 0.05. It could be concluded that the data was normal
distribution.
Table 4.10 Testing of Homogenity Levene's Test of Equality of Error Variancesa
Dependent Variable: Achievement
F df1 df2 Sig.
2.140 3 62 ,104
Tests the null hypothesis that the error variance of the dependent variable is equal across groups.
Based on the result of homogeneity test, the fvalue was 2.140 and the significant value was 0.104. The data are homogeneous if the significant value is
higher than significance level α= 0.05. Because the significant value (0.104) was higher than significance level α= 0.05, it could be concluded that the data are
homogeneous. It meant that both of classes have same variants.
b. Testing of normality and homogeneity for Post-test of experiment and control class
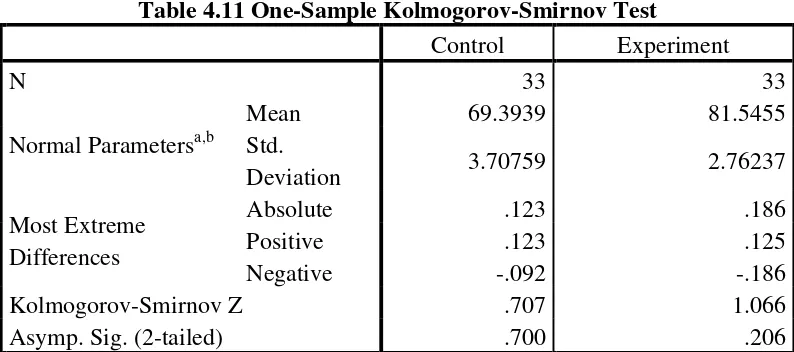
Table 4.11 One-Sample Kolmogorov-Smirnov Test
Control Experiment
N 33 33
Normal Parametersa,b
Mean 69.3939 81.5455
Std.
Deviation 3.70759 2.76237
Most Extreme Differences
Absolute .123 .186
Positive .123 .125
Negative -.092 -.186
Kolmogorov-Smirnov Z .707 1.066
Asymp. Sig. (2-tailed) .700 .206
Based on the calculation used 20 SPSS program, the asymptotic significance normality of experiment class was 0.700 and control class was
0.206. Then the normality both of class was consulted with table of Kolmogorov- Smirnov with the level of significance 5% (α= 0.05). Because
asymptotic significance experiment = 0.206 ≥ α= 0.05, and asymptotic significance control= 0.700 ≥ α= 0.05. It could be concluded that the data was
normal distribution.
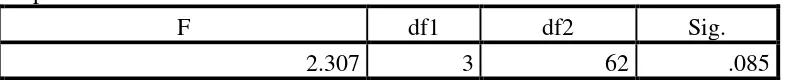
Table 4.12 Testing Homogenity Levene's Test of Equality of Error Variancesa
Dependent Variable: Score
F df1 df2 Sig.
2.307 3 62 .085
Tests the null hypothesis that the error variance of the dependent variable is equal across groups.
a. Design: Intercept + Class + Level + Class * Level
Based on the result of homogeneity test, the fvalue was 2.307 and the significant value was 0.085. The data are homogeneous if the significant value is higher than significance level α= 0.05. Because the significant value (0.085) was higher than significance level α= 0.05, it could be concluded that the data are
homogeneous. It meant that both of classes have same variants. 2. Testing Hypothesis
a. Using Manual Calculation
20.0 Program to test the hypothesis using Two-ways Anova. There are steps formula of Anova:
a. The total sum of squares
SSt= ∑X2t– ∑
SSt= 379035-375914.56
SSt= 3120.4 Where
SSt = sum of square total ∑X2
= each score squared, then summed
(∑Xt)2 = all the scores summed first, then this sum squared
N = number of scores b. The sum of squares between groups
SSb = ∑ + ∑ ∑ ∑ - ∑
SSb=
SSb= 185168.89+131246.03+34279.2+27825.8+375914.56 = 2596.4
c. The sum of squares within groups SSw = SSt - SSb
SSw = 3120.44-2605.36 = 523.964
d. The between-columns sum of squares
SSbc = ∑
+
∑ -
=
= 219438.81+158912.12-375914.56
= 19905.09
e. The between-rows sum of squares
SSbr = ∑ +
∑ -
∑
=
= 314100.6429+61936.9-375914.56
=122.9
f. The sum of squares interaction SSint = SSb– (SSbc + SSbr)
SSint= 2605.36- (2436.37 + 122.9828) = 2605.36-2559.35
= 46.01
g. Determine the number of degrees of freedom associated with each source of variation. They are found as follows:
dffor between-columns sum of squares = C – 1
dfbc= C-1 = 2-1= 1
dffor between-rows sum of squares = R – 1
dffor interaction = (C − 1)(R − 1) = (1) x (1)= 1
dffor between-groups sum of squares = G – 1
df between group= 4 -1=3
dffor within-groups sum of squares = N –G dfwithin group= 66-4= 62
dffor total sum of squares = N – 1
dftotal sum= 66-1= 66 where:
C = number of columns
R = number of rows
G = number of groups
N = number of subjects in all groups
h. The mean square values by dividing each sum of squares by its associated
number of degrees of freedom.
i. Compute the F ratios for the main and the interaction effects by dividing the between-groups mean squares by the within-groups mean square for
each of the three components.
The criteria of Ha was accepted when F0> F table, and H0 was refused when
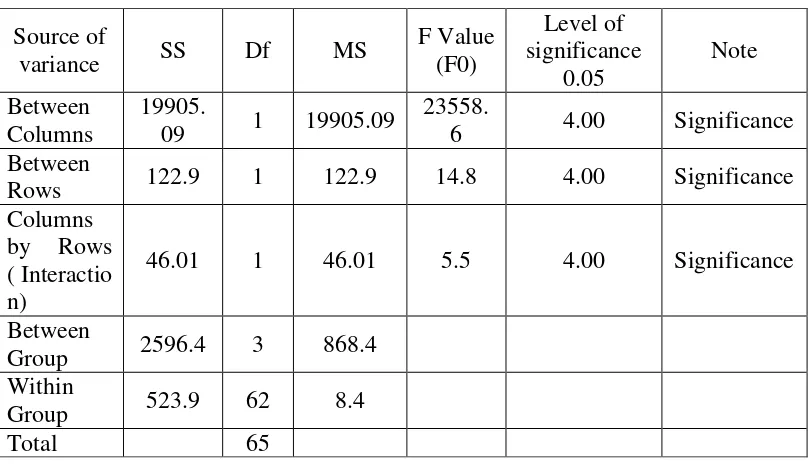
Table 4.13 Result of Testing Hypothesis
1. First, based on the calculation above used manual calculation and SPSS 20.0 program, the F value between columns was 23558.6. Then it was consulted
with F table of with the level of significance 5% so F table = 4.00. Because F0=-23558.6>F table= 4.00, the difference between columns was significance. It
could be concluded that the basic questioning technique with picture toward high motivation level of student’s achievement in writing recount text gave
significance effect. Thus, Ha stating that the basic questioning technique with
picture is effective to the high motivation students’ writing skill of recount text at the eighth grade of SPMN 2 Palangka Raya was accepted and H0
stating that the technique of basic questioning with picture is not effective to the high motivation students’ writing skill of recount text at the eight grade of
SPMN 2 Palangka Raya was rejected. Source of
variance SS Df MS
F Value (F0)
Level of significance
0.05
Note
Between Columns
19905.
09 1 19905.09
23558.
6 4.00 Significance
Between
Rows 122.9 1 122.9 14.8 4.00 Significance
Columns by Rows ( Interactio n)
46.01 1 46.01 5.5 4.00 Significance
Between
Group 2596.4 3 868.4
Within
Group 523.9 62 8.4
2. Second, the F value between rows was 14.8 which consulted with F table with the level of significance 5%, because the F value = 14.8>F table = 4.00, the difference between rows was significance. It could be concluded that using basic questioning technique with picture toward low level of students’
achievement in writing recount text was significance effect. Therefore, Ha stating that the students’ low motivation is effective to the students’ writing skill of recount text at the eight grade of SMPN 2 Palangka Raya was
accepted and H0 stating that the students’ motivation is not effective to the low motivation students’ writing skill of recount text at the eight grade of
SMPN 2 Palangka Raya was rejected.
3. Third, the F value columns by rows (interaction) was 5.5 that consulted with level of significance 5%, because F value = 5.5 >F table = 4.00, it could be concluded that using basic questioning technique with picture toward high and low motivation level of student’s achievement in writing recount text was
significance effect. It could be concluded that Ha stating that the basic questioning technique with picture and high and low motivation are effective to the students’ writing skill of recount text at the eight grade of SPMN 2
Palangka Raya was accepted, and H0 stating that the technique of basic questioning with picture and high and low motivation are not effective to the students’ writing skill of recount text at the eight grade of SMPN 2 Palangka
b. Using Spss 20.0 Calculation
There are Levene's Test of Equality of Error Variances and Descriptive
Statistics calculations univariate analysis of variance used spss 20.0 program:
Table 4.14 Tests of Between-Subjects Effects Dependent Variable: Score
Source Type III Sum of Squares
df Mean
Square
F Sig.
Corrected
Model 2596.475
a
3 865.492 102.412 .000 Intercept 199095.009 1 199095.009 23558.649 .000
Class .000 0 . . .
Level 160.096 2 80.048 9.472 .000
Class * Level .000 0 . . .
Error 523.964 62 8.451
Total 379035.000 66
Corrected
Total 3120.439 65
a. R Squared = ,832 (Adjusted R Squared = ,824)
Table 4.15 Descriptive Statistics Dependent Variable: Score
Class Level Mean Std.
Deviation
N
Experiment Class
High Motivation
Experiment 81.5000 2.84800 28
Low Motivation
Experiment 81.8000 2.48998 5
Total 81.5455 2.76237 33
Control Class
High Motivation
Control 68.4643 3.19122 28
Low Motivation
Control 74.6000 1.14018 5
Total 69.3939 3.70759 33
Total High Motivation
Low Motivation
Experiment 81.8000 2.48998 5
High Motivation
Control 68.4643 3.19122 28
Low Motivation
Control 74.6000 1.14018 5
Total 75.4697 6.92869 66
Table 4.16 Between-Subjects Factors
Value Label N
Class 1.00 Experiment Class 33
2.00 Control Class 33
Level
1.00 High Motivation Experiment 28
2.00 Low Motivation Experiment 5
3.00 High Motivation Control 28
4.00 Low Motivation Control 5
Table 4.17 Levene's Test of Equality of Error Variancesa Dependent Variable: Score
F df1 df2 Sig.
2,307 3 62 ,085
Tests the null hypothesis that the error variance of the dependent variable is equal across groups.
a. Design: Intercept + Class + Level + Class * Level
Based on the result of homogeneity test, the fvalue was 2.307 and the significant value was 0.085. The data are homogeneous if the significant value is higher than significance level α= 0.05. Because the significant value (0.085) was
higher than significance level α= 0.05, it could be concluded that the data are
C.Interpretation of The F-Ratios
The hypothesis testing used two ways anova to measure the significance effect of basic questioning technique with picture toward high motivation levels of students’ achievement in writing recount text. Based on the manual
calculation and SPSS 20 program of two ways anova between columns F0= 23558.6 was consulted with F table with significance level 5% (F table= 4.00).
Therefore, Between Rows was F0 (14.8) and between group was F0 (5.5) > F table (4.00). It could be concluded using basic questioning technique with picture toward high motivation level of students’ achievement in writing
recount text was significance.
Next, F- ratio, which F0= 23558.6 was more than F table on
significance level 5% (F table= 4.00) is significant at the level 5% (F= 4.00), based on comparison of achievement of the subject in high motivation of
experiment class and high motivation level of control class with achievement of the subject in low motivation level of experiment class and low motivation level of control class. Therefore, it can summary that the difference
achievement between the performance of those subject in high motivation level and the subject in low motivation level of both classes in writing recount text is
Lastly, F-ratio shown the interaction effect between the two variable, high and low level of students’ achievement in writing recount text that taught
by basic questioning technique with pitcure, which testing hypothesis used two ways anova. Based on the calculation of two ways anova, F0 = 5.5. It was
consulted with F table with level of significance 5% (F table= 4.00) because the F0= 5.5 > F table = 4.00. It could be concluded that there are significance interaction using basic questioning technique with picture toward high and low motivation level of students’ achievement in writing recount text. Its mean that
the effect of basic questioning technique with picture using picture in teaching