www.elsevier.nl / locate / econbase
Wealth taxation and economic growth
* Toshihiro Ihori
Department of Economics, University of Tokyo, Hongo, Tokyo 113, Japan
Received 30 July 1998; accepted 30 September 1998
Abstract
This paper investigates the effect of wealth taxation on economic growth using an endogenous growth model with the altruistic bequest motive. We introduce intragenerational productivity differentials of human capital formation, resulting in differences of growth rates among individuals. The economy is divided into two groups; those who leave bequests to physical capital investment and those who leave bequests to human capital investment. An increase in taxes on life cycle savings will reduce the intragenerational growth differences, while the effect of taxation on bequests, wage income, or consumption on intragenerational growth differences is ambiguous. 2001 Elsevier Science B.V. All rights reserved.
Keywords: Wealth taxation; Economic growth; Intergenerational transfer
JEL classification: H2; H3
1. Introduction
There are two types of wealth from the viewpoint of origin; life cycle wealth (wealth accumulated from life cycle behavior) and transfer wealth (wealth deriving from intergenerational transfers). We observe a large amount of intergenerational transfers (bequests to human and physical capital) as well as life cycle savings and heavy taxes on various types of wealth in the real economy. It is widely believed that heavy wealth taxation would induce low economic growth, although the
*Tel.: 181-338-12-2111; fax:181-388-18-7082. E-mail address: [email protected] (T. Ihori).
1
analytical results are dependent on how wealth is accumulated . It is hence important to analyze the long-run effect of taxation on economic growth by explicitly differentiating two types of wealth accumulation. It is also interesting to examine the effect of wealth taxation on intragenerational differentials of income growth since wealth taxation is often used for redistributive objectives.
Recent advances in endogenous growth theories have opened up the possibility of analyzing the growth effects of various fiscal policy changes by extending a framework of the standard overlapping generations model. Jones and Manuelli (1990) showed that an income tax-financed redistributive policy can be used to induce positive endogenous growth. Azariadis and Drazen (1990) presented a model of endogenous growth in which the accumulation of human capital is subject to externalities. Glomm and Ravikumar (1992) presented an overlapping generations model with heterogeneous agents in which human capital investment through formal schooling is the engine of growth. Buiter and Kletzer (1993) investigated international productivity growth differentials by incorporating human capital accumulation. Caballe (1995) investigated the effect of several fiscal policy experiments for both bequest constrained economies and unconstrained ones. Ihori (1997) investigated the long-run effect of three types of taxes on capital; a tax on interest income, a tax on wage income, and a tax on physical bequests. Bovenberg and van Ewijk (1997) explored the trade-off efficiency and intra- and intergenera-tional equity in an endogenous growth model of an open economy with human capital accumulation. Chiu (1998) showed that greater income equality implies higher human capital accumulation and economic performance in an overlapping
2
generations model with heterogeneity in income and talent . These papers have shown that it is important to distinguish human capital from physical capital to explore the role of intergenerational transfers during wealth accumulation. Human capital is the most important component of national wealth and human capital accumulation could be the crucial factor in economic growth.
Incorporating heterogeneous agents who determine optimally human capital investment into an endogenous growth model with the altruistic bequest motive, the present paper also allows for intragenerational productivity differentials of the human capital accumulation process. It is shown that the economy is divided into two groups; those who operate bequests as physical capital investment and those who operate bequests as human capital investment. It is also shown that some types of taxation on wealth accumulation (in particular taxes on interest income from life-cycle savings) may reduce intragenerational differentials of growth rates among individuals even if they are not progressive. We can investigate analytically
1
See Lord (1989); Trostel (1993); Nerlove et al. (1993) and Pecorino (1993) among others.
2
the long-run effects of several tax reforms involving taxes on wage income, bequests, interest income, and consumption.
This paper is organized as follows. In Section 2 we present an overlapping-generations model of endogenous growth in which agents are altruistic toward their descendants. In Section 3 we examine how growth rates of various types of individuals are determined in the long run. In Section 4, we investigate the long-run effect of taxation on transfer wealth and life-cycle wealth on economic growth. In Section 5 we provide some remarks. Finally, in Section 6 we conclude the paper.
2. Endogenous growth model
2.1. Technology
A general feature of endogenous growth models is the presence of constant or increasing returns in the factors that can be accumulated. We incorporate two types of capital (physical capital and human capital) as well as two types of wealth (transfer wealth and life cycle wealth) into the simplest version of endogenous growth models.
Firms act competitively and use a constant-returns-to-scale technology.
12a a
Yt5AKt Ht (1)
where Y is aggregate output, K is aggregate physical capital, and H is aggregate human capital. A is a productivity parameter which is taken here to be multiplicative and to capture the idea of endogenous growth.a is the output share
3
of human capital.
2.2. Three-period overlapping generations model
To make the point clear consider an endogenous growth version of the three-period overlapping generations model similar to Batina (1987); Jones and Manuelli (1990), Glomm and Ravikumar (1992); Marchand et al. (1992); Buiter and Kletzer (1993); Nerlove et al. (1993); Caballe (1995) and Razin and Yuen (1996). The number of households of each generation, n, is fixed and there is no population growth. A type-i parent produces a type-i child, so that a type-i dynasty continues forever.
In the first period of his life (‘youth’), a consumer of type i born in period t21
3
has an endowment of time, normalized to 1, which he can either choose to consume as leisure xit21 or to allocate to an alternative use, education et21 in efficiency units.
eit21
]] 15 m 1xit21
i
where e /m is time spent on education and m is the productivity of educationali i i
input. Subscript i means an individual of type i (i51, . . . ,n). We allow for intragenerational differences in the productivity of educational input m among individuals. It is assumed that m1,m2, ? ? ? ,m . The above equation may ben
rewritten as
mi5eit211m xi it21 (2)
An individual of highly productive dynasty has a large amount of m, so that he can spend a lot of time on education in efficiency units.
In period t21 when a type-i household of generation t is young the (same-type) parent of generation t21 can choose to spend private resources other than time on human capital formation of his child (as bequests to human capital), Bt21, and physical savings for his child (as bequests to physical capital), bit21. The educational process during the first period of the household’s life adds to the endowment of labor time in efficiency units H (human capital) during the secondt
period ‘middle age’, i.e., during period t for a household born in period t21. The stock of human capital used in employment by the type-i household of generation t during period t, H , is assumed to be a function of the two inputs; his ownt
educational input, eit215e and his parent’s gift to education, gt21. We have for simplicity the following functional form.
Hit5hgit21 ite 21,h .0 (3)
4
Technological parameterhwill be normalized to 1 . Human capital accumulation is a combination of life-cycle spending on educational time (educational invest-ment) and bequests to human capital (a gift from the parent). The marginal productivity of the parent’s transfer gift is dependent on the level of the child’s educational input, and vice versa. The higher e ( g), the greater is the marginal product on g (e). A few restrictive features of this human capital formulation deserve mention. An important feature of this specification is that the human capital of the child depends crucially on the parent’s gift rather than on the average level of existing human capital. A child who grows up in a richer family will have access to better training and education which enhance the development of his human capital. This may give rise to persistent inequalities. The present formula-tion does not allow for consumpformula-tion benefits from human capital, spillover benefits
4
from human capital, or decreasing returns to scale. To keep the model tractable, the family-specific human capital formation of increasing returns to scale in a dynastic framework is used. This does not seem inappropriate since the bulk of intergenerational transfers probably occur in the form of human capital in the real economy.
During middle age, the type-i household of generation t concerns how much to
1
consume c , to save for the old age s , to spend on physical capital formation fort t
his child, b , and to spend on human capital formation for his child, B . The entireit t
endowment of labor time services in efficiency units H is supplied inelastically int
the labor market and wage income h H is obtained. h is the wage rate. In the lastt t
period of life (‘old age’ of ‘retirement’) households do not work or educate
2
themselves. The old of generation t just consumes ct11. Table 1 summarizes two types of wealth and two types of capital in this model.
The government imposes taxes on capital, consumption, and wealth accumula-tion when private intergeneraaccumula-tional transfers and life cycle savings are present. To focus on the distortionary effects of taxation, we make the conventional assump-tion that tax revenues are returned as a lump sum transfer to the same individual. This is a standard assumption of the differential tax incidence. There is no intragenerational redistribution effect of the tax-transfer policy; taxes are not progressive. Furthermore, the tax policy would not include the intergenerational redistribution effect such as debt issuance or unfunded social security.
Thus, the middle-age budget constraint is given by
1 1
cit1sit1bit1git1uHh Ht it1uB(bit1g )it 1uCcit5h Ht it1(11r )bt it21 1
1Rit (4.1)
where r is the rate of return on physical capital,uH is a tax on income from human capital (a wage income tax), uB is a tax on bequests (or gifts), uC is a tax on
1
consumption, and R is a lump sum transfer on the young in period t. Substitutingt
(3) into (4.1), we have
1 1
cit1sit1bit1git1uHh et it21git211uB(bit1g )it 1u Ccit5h et it21git21 1
1(11r )bt it211Rit (4.19)
The old-age budget constraint is given by
Table 1
Wealth and capital
Life cycle wealth Transfer wealth Total
Human capital e g H
2 2 2
cit111trt11 its 1uCcit115(11rt11)sit1Rit11 (4.2)
2
wheret is a tax on income from life-cycle physical capital and R is a lump sumt
transfer on the old in period t11.
The government budget constraint is given by
n n
1 1
O
Rit5O
[uHh Ht it1uB(bit1g )it 1uCc ]it (5.1)i51 i51
n n
2 2
O
Rit115O
[trt11 its 1uCcit11] (5.2)i51 i51
Taxes on human capital is formulated as taxes on wage income,u(11h )H , as int t
the conventional formulation. See, for example, Pecorino (1993). The feasibility condition in the aggregate economy is given by
1 2
ct 1ct 1Kt111gt5Yt1Kt (6)
where a variable without subscript i means an aggregate variable. Physical capital accumulation is given by
st1bt5Kt11 (7)
The rates of return on two types of capital are respectively given by
2a
r5 ≠Y /≠K5A(12a)k (8)
12a
h5(Y2rK ) /H5 ≠Y /≠H5Aak (9)
where k5K /H is the aggregate physical capital–human capital ratio.
2.3. Altruistic bequest motive
1 2
An individual of type i born at time t21 consumes c in period t and ct t11 in period t11 and derives his own utility (u ) from leisure when young and his ownit
consumption when middle and old.
1 2
5
In the altruism model the parent cares about the welfare of his offspring . The type-i parent’s utility function is given by
1 2
Uit5uit1r3Uit115dlog xit211log cit1´log cit111rUt11 (11) 0,r ,1. r reflects the parent’s concern for the child’s well-being. Namely, r is the parent’s marginal benefit of his offspring’s utility (Uit11) and may be regarded as the private rate of generation preference or the private discount factor of the future generation. The higher r, the greater the parent cares about his offspring.
3. Economic growth
3.1. Optimizing behavior
Substituting (2) (4.19) and (4.2) into (11), we have
Uit5dlogh(mi2eit21) /mij1logh[(12uH)h et it21git21 An individual of type i born at time t21 will solve the following problem of maximizing. He will choose eit21, s , g , and b to maximize (12). The optimalityit it it We call the individual who has both conditions (13.3) and (13.4) with equality the type-M individual. Namely, from (13.3) and (13.4), we have
5
11rt115(12uH)ht11 Mte (14) If eit,e , then 1Mt 1rt11.(12uH)ht11 ite and hence git5Hit1150. Consider-ing (13.1), we also know that eit2150. On the other hand, if eit$e , thenMt
6
11rt11#(12uH)ht11 ite and hence bit50 . If the (after-tax) marginal return on human capital is higher (lower) than the marginal return on physical capital at b50 ( g50), the intergenerational transfer is operated only in the form of human capital investment (physical capital investment). It follows that the economy is divided into two groups; those who leave bequests only to human capital (i$M ) and those who leave bequests only to physical capital (i,M ). It is assumed that the type-M individual is between 1 and n (1,M,n). Note that individuals i$M accumulate also physical capital for old-age consumption.
3.2. Growth rates among individuals
Suppose for a while the government does not levy any taxes;u 5 t 5 u 5 u 5H B C 0. Let us investigate how e and other economic variables are determined in thei
long run. We have from (4.2) and (13.2)
1
si5ci´ (15)
Substituting (15) into (4.1), we have for i$M
Hit11 1
]]e 1
F
]´11 sG
it5h Ht it (16)it
7
On the other hand, from (13.3) in the steady state we have
Hit115re hHi it (17)
Their growth rates are given by
gi.M5re hi (18)
The larger e ,i r, or h, the greater is the growth rate.
From (7), (16) and (17) the steady-state physical capital–human capital ratio of type-i individual (for i$M ), ki;K /H , is given byi i
For the type M individual g and b are indifferent. For simplicity, we assume that bM50.
7
The transitional dynamics are complicated. To maintain the tractability of our analysis, we shall confine our analysis to steady-state equilibria, where H and K grow at the same rate and, r, k and hi i
As H /H approaches 1 in the long run, the aggregate physical capital–humann
capital ratio k will be approximately given by k in the steady state.n
(12r)´
Therefore from (19) and (21), e is given byi
dm (1i 2r)
F
]]]G
ei5mi
Y
11 11´ (22)(22) means that e is decreasing withi dand increasing with m ,i ´andr. When the preference for leisure is high or when the productivity of educational input, the preference for old-age consumption, and the preference for the child are low, time spent on human capital investment (educational input in efficiency units) becomes small. These results are intuitively plausible.
Considering (2) and (22) we have
d(12r)ei
]]] xi5 11´
An individual with higher educational input also enjoys a larger amount of leisure when young since he has higher productivity of educational input.
From (17) the growth rate of individual M is also given by
g 5 rM e hM (23)
where M is determined by (8), (9), (14), (20) and (22). Namely, considering (20) and (22), the following equation determines m .M
dm (1M 2r)
2a 12a
F
]]]]
G
11A(12a)k 5Aak mM
Y
11 11´ (24) On the other hand, (13.4) applies to those who have smaller values of m than theiindividual of type-M (mi,m ). Since they do not spend on any human capitalM
accumulation, their e reduces to zero. They do not earn income from humani
capital and their common growth rate is given by
gi,M5r(11r)5gM (25)
3.3. Remark
We have shown that from (22) an increase in r raises e of highly productivei
individuals (ei$e ). This is because it will raise the marginal benefit ofM
intergenerational transfer. Since higherr increases the marginal benefit of human capital investment, g is stimulated, which then raises the marginal return of e .i i
Hence from (20) k and h decrease, while r increases.
An increase in the intergenerational preference r has three impacts on the growth rates for individuals with human capital accumulation. First of all, it will directly stimulate the intergenerational transfer from the old to the young, which induces higher growth. Second, it will stimulate his own human capital invest-ment, which also induces higher growth. Finally, it will reduce k and hence the rate of return on human capital, h, which depresses economic growth. It follows from (18) that the overall impact on the type-specific growth rates for highly productive individuals is ambiguous.
On the contrary, we know from (25) that the effect on the growth rate for less productive individuals with physical capital bequests is positive. Namely, an increase in the intergenerational preference r will raise the rate of return on physical capital investment r, which enhances economic growth for individuals with bequests to physical capital.
As shown in (22), an increase in the private preference for old-age consumption ´ or a decrease in the preference for leisure when young d will have a similar effect on e as an increase ini r. Namely, as shown in (13.1), an increase ind will reduce e since it will raise the marginal cost of reduction in leisure. Hence fromi
(20) k and h increase, while r decreases. It could raise the intragenerational differences of growth rates among individuals since it always reduces the lowest growth rate of the economy (gi#M) and may raise the highest growth rate (gn).
An increase in ´will raise e since it will raise the marginal benefit of humani
capital accumulation. However, it will also stimulate physical capital accumula-tion. Since the direct effect of an increase in´on k is large, considering (20) and (22), the overall effect of an increase in´on k is also positive, which is opposite to the result in the case of an increase inr. Hence, an increase in´will raise e , ki
4. Taxes and economic growth
4.1. Long-run effect of taxation
We now consider the long-run effect of taxes on capital income and wealth accumulation. When taxes are incorporated, (20) may be rewritten as
(12r*)´* ]]]]
k5 (209)
enr*(11´*) We also have in place of (22)
d*m (1i 2r*)
d* is the effective preference for leisure when young, ´* is the effective preference for old-age consumption, and r* is the effective rate of generation preference. And (14), (18) and (25) may be rewritten as respectively
11r5(12uH)heM (149)
First of all, let us consider the impact of a tax on income from human capital accumulation (or a tax on labor income)uH. As shown in (26.1) and (26.3), an increase in uH has the same effect as a combination of a decrease in r and an increase ind. In other words, it will reduce the marginal benefit of intergeneration transfer and raise the marginal cost of reducing leisure. From (229) an increase in uH will reduce e . Considering (209), it will raise k, h and reduce r. This result isi
human capital relative to physical capital since e is not tax deductible and thei
marginal benefit of g is lowered.i
Hence, from (259) an increase in uH will reduce the growth rate for less productive individuals with physical bequests (ei50,e ). SinceM
gi,M5g 5 r(1M 1r) /(11uB),
the growth rate for the type-M individual reduces as well. Considering (149), the effect on eM is ambiguous. Hence, the effect on M is also ambiguous. It should be stressed that although an increase in the wage tax reduces time spent on human capital accumulation, it could raise the portion of people with human capital accumulation.
We have from (149), (189), (229) and (259)
gn/g 51 (m /m )([1n M 1´*1d*m (1M 2r*)] / [11´*1d*m (1n 2r*)]) (27)
which may be regarded as a measure of intragenerational differentials of growth rates. From (27) we know thatgn/g1 decreases in M. Thus, if an increase in a tax on wage income lowers M, it will enlarge intragenerational differences of growth rates, and vice versa. If the after-tax return on human capital, (12uH)h, declines enough to raise e , then M increases and an increase inM uH will reduce intragenerational differences of growth rates.
In Fig. 1 curve MA represents growth rates for individuals with human capital accumulation and line BM represents growth rates for individuals with physical bequests. An increase inuH shifts line BM downwards to B9M9. If it shifts curve MA upwards to M9A9, M declines as in Fig. 1A. On the other hand, if it shifts curve MA downwards, M could rise as in Fig. 1B. Even if it reduces the growth rates for all, it could also enlarge intragenerational growth differences.
The effect on the growth rates for highly productive individuals with human capital accumulation (i.M ) is ambiguous. An increase inuH directly depresses the growth rate by reducingr*, the effective rate of generation preference. This is a direct negative effect of taxation. Furthermore, a decrease in e also depressesi
4.3. Tax on bequests
When a tax on bequests uB is raised, it will reduce r*, the effective rate of generation preference, as shown in (26.3). Although the bequest tax does not discriminate between bequests to human capital and bequests to physical capital, it affects the relative price of intergenerational transfers. Thus, it has a similar effect as an increase in uH in the sense that it reduces the marginal benefit of intergeneration transfer. It follows that an increase inuB will raise k and h, while reducing e and r.i
As in Section 4.2, its effect on the growth rates for individuals with human capital accumulation is ambiguous. Since an increase inuB reduces the growth rate for individuals with physical capital accumulation, it will also reduce the growth rate for individual M (gM). Considering (149), an increase in the bequest tax will reduce e . Its effect on M is ambiguous. Even if it reduces growth rates forM
productive individuals, it could enlarge intragenerational growth differences. An increase inuB will not necessarily reduce intragenerational differences of growth rates. We cannot necessarily say that the bequest tax is desirable in terms of equity. We could consider a tax on bequests to human capital only. Since individuals with human capital accumulation do not leave bequests to physical capital, (26.3) still holds. Thus, the analytical result would be essentially the same as in this section. We could also consider a tax on bequests to physical capital only. Such a tax would not affect (209) or (229). Hence, the physical bequest tax would not have any impacts on human capital accumulation or physical capital accumulation. From (259) it would only reduce the growth rate for less productive individuals, resulting in a decrease in M. Thus, it enlarges the intragenerational differences of growth rates.
We could investigate the effect of tax reforms involving an increase inuBwith a decrease inuH. Two cases are interesting. First, suppose a tax reform which keeps r* constant. Then, the real impact of the tax reform is the effect of a decrease in d*, which is analyzed in Section 3.3. Second, suppose a tax reform which keeps ei
constant. Then, the impact of an increase inuB dominates that of a decrease inuH, and hence k and h will rise and r will decrease. From (149), M will decrease. Hence this tax reform will enlarge the intragenerational differences of growth rates.
4.4. Tax on life cycle savings
When a tax on life cycle savings t is raised, it will directly reduce ´*, the effective preference for old-age consumption, as shown in (26.2). It has the same effect as a reduction in´in the sense that it reduces the marginal benefit of capital accumulation for old age. Hence, it will reduce k, h and raise r. It will also reduce e for ii .M. Considering (149), it will raise e . Thus, M will increase.M
physical capital (ei50,e ), while the effect on the growth rates for individualsM
with bequests to human capital is negative. An increase intwill hence reduce the intragenerational differences of growth rates among individuals, which is a new result in this paper. As shown in Fig. 2, it shifts line BM upwards and curve MA downwards, resulting in an increase in M. This is because a tax on life cycle saving does not directly affect the rates of return on intergenerational transfers, which are associated with growth rates among individuals. It would affect economic growth only through changes in the physical capital–human capital ratio.
We could investigate the effect of comprehensive income tax;u 5 t. SupposeH u 5 tH is raised. Then, e decreases. But the effects on k, h and r are ambiguous.i
This is because the negative effect of an increase in t on physical capital accumulation offsets that of an increase inuH.
4.5. Tax on consumption
Finally, let us consider the effect of a consumption tax,uC, on economic growth. As shown in (26.1), an increase inuC will raised*, the effective preference for leisure when young. An increase inuCis qualitatively the same as an increase ind in the sense that it raises the marginal cost of reducing leisure. From (229) it will
reduce e . It will raise k and h but reduce r. Considering (149), it will also reducei
e . Thus, from (22M 9) its effect on M is ambiguous.
An increase in uC might raise the growth rates for sufficiently productive individuals, although it will reduce the growth rate for individuals with physical bequests. An increase inuC will not necessarily reduce intragenerational differ-ences of growth rates among individuals. In this sense, an increase in uC has
8
qualitatively the same effect as an increase inuB oruH .
A tax reform of an increase inuB with a decrease inuH which keepsr* constant will have the same effect as a decrease in uC. Both tax changes decrease d* by raising the marginal cost of reducing leisure. We could also consider a tax reform of an increase inuC with a decrease inuH which keeps e constant. Such a taxi
reform has the same effect as a decrease inuB since both tax changes result in an increase inr*.
5. Remarks
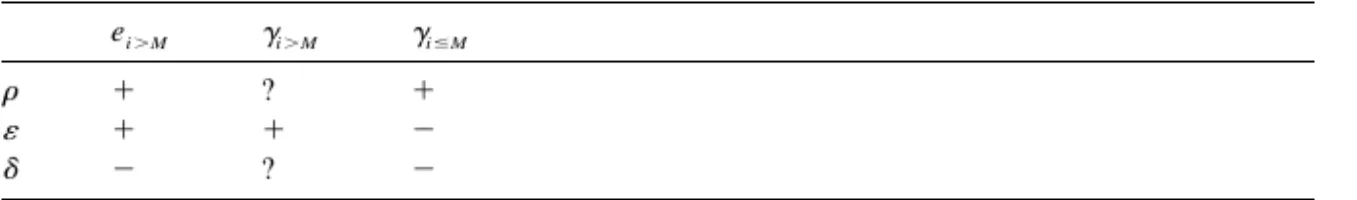
Our main results are summarized in Table 3. In the real economy we would not expect the perfect dichotomization of the population where the poor save physical capital and the rich invest in human capital. There are several remarks to be made. First, the human capital accumulation Eq. (3) may be generally formulated as
Hit5H( git21, eit21) (29)
which is independent of e . In such a case, all individuals will have the sameM
pattern of wealth accumulation. They accumulate both human capital and physical capital at the same time. Namely, if (30) holds, they leave bequests both to human capital and physical capital investment. If 11r,(12uH)h, they only leave
Table 3
If educational input is exogenously given (ei5e ), then the consumption tax has no real effects. Thei
bequests to human capital and accumulate physical capital for old-age consump-tion. The growth rate is the same for all individuals, although more productive individuals enjoy higher consumption and welfare. It seems that the increasing returns to scale technology could capture some aspects of human capital accumulation.
Second, we could interpret two types of capital K and H as (common) unskilled and (family-specific) skilled capital rather than physical and human capital, respectively. When an individual invests in K, everyone can obtain the same return. On the other hand, when he invests in H, the marginal return depends on his ability as well as his parent’s ability. Thus, a more able family will leave bequests as investment in skilled capital, while a less able family will leave bequests as investment in unskilled capital. This does not seem inappropriate in the real economy.
Third, we could incorporate differences in abilities of investing in physical capital instead of investing in human capital. In this case K may be regarded as skilled capital and H may be regarded as unskilled capital. Then, highly productive individuals leave bequests only to physical capital without accumulating human capital. The less productive individuals operate only as human capital investment. It seems that differences in ability of investing in human capital are larger than those in physical capital.
Finally, it is well recognized that there may be a variety of motives for bequeathing in the real economy. We briefly focus our attention on the consum-ption-as-bequest model where the parent cares about the size of bequest as well as the size of spending on human capital formation of his child.
1 2
uit5dlog xit211log cit1´log cit111llog bit1vlog git (31) Then, the optimality conditions with respect to eit21, s , g and b are respectivelyit it it
given as (13.1), (13.2) and
Hence, when taxes are zero, the long-run growth rate for individual i is given as
1
]]]]]
g 5i 11´ 1 l 1 v 1 d [m hv 1 l(1i 1r)] (33)
Note that in this case all individuals have both positive physical bequests and human capital transfers; b, g.0 for all individuals. The higher m , the larger is thei
population. Our analysis has clarified the potential mechanism of dichotomization in the economy where a child who grows up in a richer family will have access to better training and education which enhance the development of his human capital. We have excluded any intragenerational redistribution effect of the tax-transfer policies. This has provided us with a pure experiment allowing us to study the substitution effects created by the tax policy. We could investigate the effect of progressive taxation on wealth as in Bovenberg and van Ewijk (1997). Progressive taxes would imply that tax payments are larger than transfers for highly productive individuals. With progressive taxes the steady-state physical capital–human capital ratio of a highly productive individual becomes higher than in Section 4, resulting in less time for human capital investment. Therefore, it would reduce the growth rates for highly productive individuals, compared with the proportional tax rate.
6. Conclusion
It has been recognized that in modern economies most private wealth takes the form of human capital and hence disparities in income originate mainly in interpersonal differences in learning capabilities. Human capital accumulation is also dependent on intergenerational transfers. This paper has incorporated two types of wealth, life-cycle wealth and transfer wealth as well as two types of capital, physical capital and human capital, into an endogenous growth model of overlapping generations. We have also introduced intragenerational productivity differentials of human capital formation, which would result in intragenerational differences of growth rates among individuals. We have shown that human capital investment when young has a crucial role to investigate the long-run effect of wealth taxes on economic growth. It has also been shown that the economy is divided into two groups; those who operate bequests only to physical capital (or unskilled capital) and those who operate bequests only to human capital (or skilled capital).
reducing leisure. Hence, it will depress human capital accumulation and may reduce intragenerational differentials of growth rates. On the contrary, an increase in the tax on life cycle savings has the same effect as a decrease in the own preference for life cycle savings. It raises the return on physical capital and reduces the return on human capital, reducing the intragenerational differences.
We have also considered the impact of several tax reforms. A tax reform of an increase in the bequest tax with a decrease in the wage tax can keep the effective rate of generation preference constant. This tax reform has the same effect as a decrease in the effective preference for leisure and is equivalent to a decrease in the consumption tax. Both tax changes raise the marginal cost of reducing leisure. A tax reform of an increase in the bequest tax with a decrease in the wage tax can keep educational input constant. This tax reform will enlarge the intragenerational differences of growth rates. We have also considered a tax reform of an increase in the consumption tax with a decrease in the wage income tax which keeps educational input constant. Such a tax reform has the same effect as a decrease in the bequest tax since both tax changes result in an increase in the effective rate of generation preference.
We have assumed for simplicity that intelligence is 100 percent hereditary. A useful extension would be to allow for more realistic changes in abilities among generations.
Acknowledgements
I am grateful to Dieter Bos, Jonathan H. Hamilton, Pierre Pestieau and participants at the ISPE Conference on Bequests and Wealth Taxation, May 18–20, 1998, University of Liege, Belgium. I also thank two referees for comments on an earlier version of the paper. All remaining errors are my own.
References
Azariadis, C., Drazen, A., 1990. Threshold externalities in economic development. Quarterly Journal of Economics 105, 501–526.
Batina, R.G., 1987. The consumption tax in the presence of altruistic cash and human capital bequests with endogenous fertility decisions. Journal of Public Economics 34, 329–365.
Bovenberg, A.L., van Ewijk, C., 1997. Progressive taxes, equity, and human capital accumulation in an endogenous growth model with overlapping generations. Journal of Public Economics 64, 153–180. Buiter, W.H., Kletzer, K.M., 1993. Permanent international productivity growth differentials in an integrated global economy. In: Anderson, T.M., Moene, K.O. (Eds.), Endogenous Growth. Blackwell, Oxford, UK, pp. 77–103.
Caballe, J., 1995. Endogenous growth, human capital, and bequests in a life-cycle model. Oxford Economic Papers 47, 156–181.
Chamley, C., 1981. The welfare cost of capital income taxation in a growing economy. Journal of Political Economy 89, 468–496.
Chiu, W.H., 1998. Income inequality, human capital accumulation and economic performance. Economic Journal 108, 44–59.
Glomm, G., Ravikumar, B., 1992. Public versus private investment in human capital: endogenous growth and income inequality. Journal of Political Economy 100, 818–834.
Ihori, T., 1994. Intergenerational transfers and economic growth with alternative bequest motives. Journal of Japanese and International Economies 8, 329–342.
Ihori, T., 1997. Taxes on capital accumulation and economic growth. Journal of Macroeconomics 19, 509–522.
Jones, L.E., Manuelli, R.E. 1990. Finite lifetimes and growth. NBER working paper No.3469. King, R.G., Rebelo, S., 1990. Public policy and economic growth: developing neoclassical
implica-tions. Journal of Political Economy 98, s126–s150.
Lord, W., 1989. The transition from payroll to consumption receipts with endogenous human capital. Journal of Public Economics 38, 53–73.
Marchand, M., Michel, P., Pestieau, P., 1992. Optimal intergenerational transfers in an endogenous growth model with fertility changes. In: Tokyo ESPE conference on Government efficiency and expenditure control.
Nerlove, M., Razin, A., Sadka, E., von Weizacker, R., 1993. Comprehensive income taxation, investments in human and physical capital, and productivity. Journal of Public Economics 50, 397–406.
Pecorino, P., 1993. Tax structure and growth in a model with human capital. Journal of Public Economics 52, 251–271.
Razin, A., Yuen, C.-W., 1996. Capital income taxation and long-run growth: New perspectives. Journal of Public Economics 59, 239–263.