ANALYSIS OF CAMPUS SUSTAINABILITY USING
GRAPHICAL ASSESMENT OF SUSTAINABILITY IN UNIVERSITY
(GASU)
METHOD (A CASE STUDY IN INDUSTRIAL ENGINEERING
DEPARTMENT, DIPONEGORO UNIVERSITY)
Novie Susanto¹, Benraen Pirogo², Zodieka Loventa Z³, Nurjana Sigiro, Winona Zevvlin4
Department of Industrial Engineering, Diponegoro University, 50275, Indonesia ([email protected])
ABSTRACT
A preliminary study shows that Industrial Engineering department in Diponegoro University has some environmental problems, such as the lack of green open spaces, the high consumption of electrical energy and the unorganized waste management. The absence of a special institution to deal with the environmental conditions of the campus and the lack of a budget specifically allocated for campus sustainability are also specific problems in campus sustainability. Hence, there are need for an assessment of the campus sustainability in Industrial Engineering Department of Diponegoro University. This paper aims at evaluating the campus sustainability of Industrial Engineering department. This study uses 4 criteria; they are profile, environmental, social and educational. These criteria are detailed in 15 assessment categories. For each category, there are assessment for expectation and factual performance of the campus. The method used in this study is Graphical Assessment of Sustainability in University (GASU). This method provides a systematic way and to systematically assess the indicators available, as well as the performance of which is then used to prepare a sustainability report. There are 30 respondents in this study with the age range of 18-22 years old. Of the four criteria assessed dimensions, the educational and social aspect have the highest value with the ratio of fulfillment of above 70 percent, while the environmental and the profile aspects have values close to 60 percent. These shows that for the educational aspects of Industrial Engineering of Diponegoro University have run the role of teaching, research and service with good labor practices (Employees and Lecturers). It also supports (appropriate) social sustainability. On the other hand, although the profile and environmental aspects are included in the rather high but needed a development and improvement in both aspects. Generally, Industrial Engineering department of Diponegoro University has 67.7% level of sustainability. It means the level of campus sustainability of Industrial Engineering Department of Diponegoro University is rather high (>60%). However, there are still necessity to improve some various aspects such as the lack of sewage treatment and garbage issues, hygiene and sanitation services, as well as maintenance of the campus website.
Keywords: Campus Sustainability; GASU; Departement of Industrial Engineering Diponegoro University
1
ICoMS
1. INTRODUCTION
Sustainability has been became an important aspect in human life. Many aspects and implementation of sustainability has been studied with various approach
and framework such as driving
force-state-exposure-effect-action (DPSEEA) [1], corporate sustainability [2][3]. This framework can be used to achieve sustained health benefits and environmental protection in accordance with the principles of sustainable development, especially because of its resemblance to the environmental risk assessment and management paradigms.
The emergence of global and local environmental challenges such as, the welfare of campus community, or even a wider side such as climate change, resource depletion or loss of biodiversity and reduction of green
land are global environmental issues, including in a campus environment.
Some previous studies has been conducted to assess university sustainability [4][5][6].
Education is an important variable in explaining the level of attention and behavioral environment [7][8]. Previous researchers showed that the higher levels of education are more concerned about the quality of the environment and therefore, encourage people to engage directly in efforts to environmental sustainability. This is due to their awareness of the potential damage [9]. Changes in global environmental conditions affected by the development of technology, pro-environment policies, as well as human behavior.
consumption of electrical energy because of the necessity of illumination in daylight, as well as unwell managed waste management techniques. The absence of a special institution to deal with the environmental conditions of industrial engineering campus and the lack of a budget specifically allocated for campus sustainability of industrial engineering also reduce the possibility of sustainable campus establishment.
Hence there are a need for an assessment of campus sustainability in Industrial Engineering so that a sustainable campus can be realized. Based on this background, the campus of Industrial Engineering, University of Diponegoro will be a place of analysis as campus sustainability by using GASU (Graphical Assessment of Sustainability in University). This method provides a systematic way to assess the indicators and the performance of which is then used to prepare a sustainability report.
2. LITERATURE REVIEW 2.1 Sustainability Development
Sustainability development is interpreted as an effort to fulfill the needs of today with regard to sustainability of future generations. This concept is the basic idea of growing up today by following the dynamics of change and stresses the importance of economic growth without sacrificing the high environmental standards. Economic growth is essential to achieve but in the process, environmental sustainability does not have to be a victim. A variety of variables, such as social, economic, environmental and always has been linked to the others. Thus, the weak level of a country's economy can also affect the environmental degradation that will have negative impacts for society [10].
2.2 Campus Sustainability
According to Meng, et al. [11], sustainable campus can be interpreted as a campus that runs two sub-systems well; they are ecosystems and human systems. Sub-system ecosystem consists of material components, air, water, land, and energy, while the sub-human system formed from knowledge, community, health, welfare, and institutional.
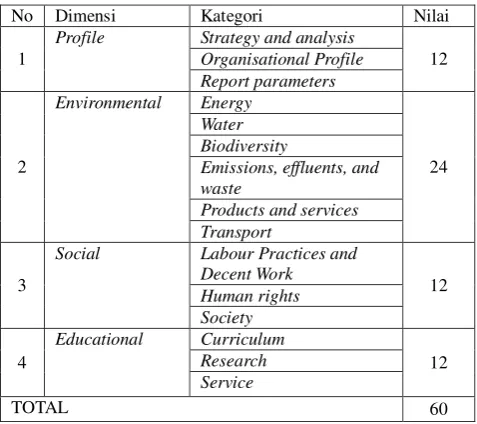
2.3 Assessment Process of Campus Sustainability There are several dimensions and categories used in the basic assessment of the level of sustainability of a university. In table 1, a proposed dimensions and categories used by Lozano et al. [12] to assess the level of sustainability. There are points that are used for judging the weight of each dimension. Each category is worth 4, the value 4 is taken by the highest value on the Likert scale (1 to 4) that is used to download a dimension asses. For example, on the dimensions of the
profile has a value of 20, this value is the multiplication of the five existing categories with four values that occur when each category has the highest value. To obtain information that can be used as an assessment, there is a location table of each dimension that provide information that can be used as a reference.
Table 1. Dimension and criterion of sustainability assessment [12]
2.4 Graphical Assesment of Sustainability in University (GASU)
In many institutions of higher education, there has been solid progress in incorporating sustainability into their systems (including curriculum, research, operations, and outreach). Graphical Sustainability Assessment at the University was designed to provide an analysis of the current sustainability efforts at the university in connection with: profile; the economic dimension; environmental dimensions; and social dimensions, based on the GRI G3 Sustainability Guidelines [6]. It is accompanied by two additional dimensions: the dimension of education and interlinking issues and dimensions.
Dimension Category Point
Profile Strategy and analysis
20
Social Labour Practices and Decent Work Relations to issues in another
dimension
Relations among all dimensions
3. RESEARCH METHODOLOGY The research was conducted on the campus of Industrial Engineering begun by identifying the problems that occurred with a look at the various factors that influence the sustainability of the campus. Problem analysis was carried out and supported by field studies and literature. The literature study was conducted to find articles related to sustainability a campus that aimed to determine the criteria, categories and aspects according to circumstances on the ground for the assessment of the sustainability of Industrial Engineering Diponegoro University campus.
The criterion was used as the input to assess the campus sustainability questionnaire. The criteria consisted of four dimensions: Profile, Environmental, Social, and Education. A questionnaire was distributed to 30 students with the age range of 18-22 years which were collected and processed by the method GASU. The analysis was carried out for the data processing with regard to each category in each dimension.
4. DIMENSION DETERMINATION AND CATEGORIES ASSESSMENT
Determination of dimensions was conducted based on literature and field studies in accordance with the technical state of the industry. The results of determination can be seen in Table 2.
Table 2. Dimension and sustainability assessment categories
Profile is the dimension of the information about a campus that is accessible to the public through the
campus web page [6]. The profile of Industrial Engineering Diponegoro University can be accessed on the site industri.undip.ac.id. On this site, the public can access information about Industrial Engineering. From this dimension, there are four categories used. First, the assessment of their strategy and analysis of the campus. Second, access to profile information about the campus organizations, and the third, report parameters such as the number of faculty, number of students, achievement data in the campus site.
Environmental is the environmental aspect of both the environment as biodiversity and nature that affect the system from the outside such as transportation and others [12]. There are various aspects of the environmental aspect that can be used as categories criteria such as how a campus uses energy sources and water, bio-diversity on campus, the management of emissions, waste and waste generated, as well as the system of hygiene or sanitation and transportation systems or access to the campus.
Social is an aspect of the stakeholders side associated with the campus, such as workers and the surrounding community. Social aspect is also assessing the human rights that are run on campus (Lozano, 2006). Aspects that can be created as categories in this dimension is the employees involved in the management of the campus, including faculty and campus stakeholders, rights granted to all parties, and communities around the campus.
Systematically teaching, adequate research and systematic curriculum that support the needs of students is part of the good aspects of educational [6]. This aspect is the core business of a college. This aspect includes teaching, research and curriculum development as well as services to students.
From the previous model [12], there are several dimensions that unfit with existing conditions in Industrial Engineering Diponegoro University. They are the dimensions of economic and interlinked issues and dimension. Economic analysis cannot be conducted due to the centralized financial system. So, it should be analyzed on university scale. The analysis of interlinked issues and dimensions also cannot be conducted because if one dimension (economic analysis) is not suitable then this dimension will not be valid. The categories were assessed using a Likert scale from level 1 to 4. For each level indicator can be seen in Table 3.
5. RESULTS AND DISCUSSION
For each category, there are two things that are asked to the respondents. They are the expectations and the factual performance perceived by the respondents. The percentage of expectations indicator derived from the number of a given value of 30 respondents
No Dimensi Kategori Nilai
1
Profile Strategy and analysis
12
Social Labour Practices and
in that category divided by 30 multiplied by the value of each dimension.
Table 3. Indikator Penilaian Skala likert (Daub’s, 2007 in [6])
0 There is a total lack of information for the indicator, it is non-existent, or the information was not found 1 The information presented is of poor performance.
This is given when there is some information, but it is too general or it has little detail or coverage 2 The information presented is of regular or fair
performance. This is assigned when the data covers around half of the issues in the indicator, or when there is good detail but it only covers some areas (for example for the curriculum category)
3 The information presented is considered to indicate of good performance. This is given when there is not enough detail, the information or coverage is not thorough, or an issue has not been addressed 4 The information indicates excellent performance.
This is assigned when there is complete and detailed information for that particular indicator. It is also assigned for
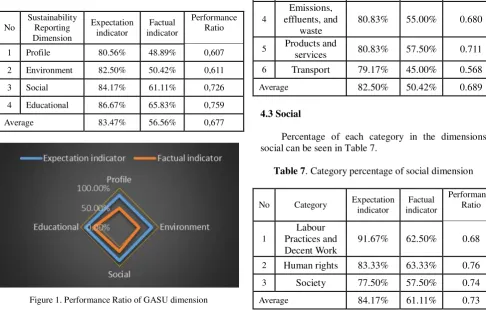
The full performance ratio is the ratio between the expected value with factual value. The results of data processing for the fourth dimension can be seen in Table 4 and Figure 1.
Table 4. The GASU percentage of expectations and the performance
No
Sustainability Reporting Dimension
Expectation indicator
Factual indicator
Performance Ratio
1 Profile 80.56% 48.89% 0,607
2 Environment 82.50% 50.42% 0,611
3 Social 84.17% 61.11% 0,726
4 Educational 86.67% 65.83% 0,759
Average 83.47% 56.56% 0,677
Figure 1. Performance Ratio of GASU dimension
4.1 Profile
Percentage of each category in the dimensions profile can be seen in Table 5.
Table 5. Category percentage of profile dimension
No Category Expectation indicator indicator Factual Performance Ratio
1 Strategy and analysis 79.17% 48.33% 0,607
2 Organizational profile 80.00% 56.67% 0,611
3 parameters Report 82.50% 41.67% 0,726
Average 80.56% 48.89% 0.607
4.2 Environmental
Percentage of each category in the dimensions environmental can be seen in Table 6.
Table 6. Category percentage of profile dimension
No Category Expectation indicator indicator Factual Performance Ratio
1 Energy 84.17% 47.50% 0.564
2 Water 80.00% 59.17% 0.740
3 Biodiversity 90.00% 38.33% 0.426
4
Emissions, effluents, and
waste 80.83% 55.00% 0.680
5 Products and
services 80.83% 57.50% 0.711
6 Transport 79.17% 45.00% 0.568
Average 82.50% 50.42% 0.689
4.3 Social
Percentage of each category in the dimensions social can be seen in Table 7.
Table 7. Category percentage of social dimension
No Category Expectation indicator indicator Factual
Performance Ratio
1
Labour Practices and Decent Work
91.67% 62.50% 0.68
2 Human rights 83.33% 63.33% 0.76
3 Society 77.50% 57.50% 0.74
4.4 Educational
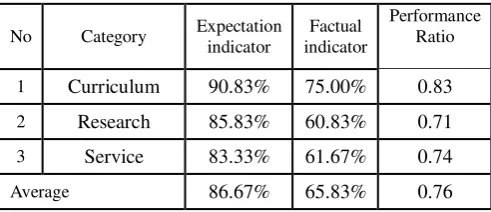
Percentage of each category in the dimensions social can be seen in Table 8.
Table 8. Category percentage of educational dimension
No Category Expectation indicator indicator Factual
Performance
Aspects of the profile has the lowest value (60.7%) compared to the other dimension aspects. The problems is caused by unstable condition of the Industrial Engineering department website so it frequently can not be accessed. This value is categorized as average (not bad for not less than 50%) [6], but it should be well-managed to avoid down-system condition.
Environmental aspects have the second lowest score after aspects of the profile, which is worth 68.9%. There are two categories that contribute to that. The first is a less biodiversity and the second is the difficult access of transportion to support access to Industrial Engineering location.
From the aspects of social, labor practices (employees and lecturers) of Industrial Engineering has been supports (appropriate) social sustainability in the scope of department. It is also able to maintain the rights of all stakeholders in the department. This is evidenced by the social dimension value which is 73%.
With A accreditation score by BAN-PT, Industrial Engineering department have a high management-level curriculum, good teaching and research as well as able to give a positive impact on both sides of education in the department. This leads to a highest values of educational aspect (76%).
Of the total average value of these four dimensions, it is obtained a value of 67.7%. This value is the value of campus sustainability of Industrial Engineering Department. It shows that the level of sustainability of the department is quite high because of greater than 60% [12], but it should consider maintenance and repairs of the various aspects to solve the problems of sewage treatment and garbage, cleanliness and sanitation services, as well as website management.
6. CONCLUSIONS
Of the four criteria specified dimension, i.e., profile, environmental, social and educational aspects, the educational obtains the highest value (76%), while the profile aspect has the lowest values (60.7%). The sustainability level of Industrial Engineering department is quite high with a value of 67.7%. Although the value of sustainability is quite high, but still needs to be improved, especially in the Environmental and Profile aspects.
REFERENCES
[1] Waheed, B., Khan, and Veitch, B. (2009). Linkage-Based Frameworks for Sustainability Assessment: Making a Case for Driving Force-Pressure-State-Exposure-Effect-Action (DPSEEA) Frameworks. Sustainability 2009, 1. 442-463.
[2] Grunda, R. (2011). Corporate Sustainability Assessment: A Historical Review. 1st World
Sustainability Forum.
[3] Grunda, R, Bartkus, E.V, Raipa, A. (2011). Assessment of Models and Indicators of Private and Public Organization Sustainability. Viešoji politika ir administravimas, 565–576.
[4] Lambrechts, W., Mula, I., Ceulemans, A., Molderez, I. and Gaeremynck, V. (2013). The integration of competences for sustainable development. Journal of Cleaner Production. 48(2013). 65-73.
[5] Mendoza, D and Terpou, K. (2014). Sustainability Reporting in University. Göteborg: CHALMERS INNOVATIONS KONTOR VAST.
[6] Ulkhaq, M. M, Prayogo, P. I, Firmansyah, M., and Agustina, D. (2016). Assessing Campus Sustainability: A Report from Diponegoro University. International Journal of Information and Education Technology, Vol. 6, No. 8: 616-621.
[7] Huisingh, D. and Zilahy, G (2009). The roles of academia in Regional Sustainability
Initiatives. Journal of Cleaner Production, 17 (12): 1057-1066.
[8] Zsóka, A., Szerényi, A., and Kocsis, T. (2013). Greening due to environmental education? Environmental knowledge, attitudes, consumer behaviour and everyday pro-environmental activities of Hungarian high school and university students. Journal of Cleaner Production. Volume 48: 126-138.
reporting in european universities. Knowledge Collaboration & Learning for Sustainable Innovation ERSCP-EMSU conference, 50-62.
[10]Siagian.M and Suriadi.A. 2012. CSR Perspektif Pekerjaan Sosial. Medan : Grasindo Monoratam.
[11]Meng, L. L., Abidin, M., & Razak, D. A. (2007). Kampus Sejahtera Kampus Lestari (the genesis for a sustainable campus). Penang: Cooperate and Sustainable Development Division Universiti
Sains Malaysia.
![Table 1. Dimension and criterion of sustainability assessment [12]](https://thumb-ap.123doks.com/thumbv2/123dok/1753343.2090344/3.595.306.546.184.576/table-dimension-criterion-sustainability-assessment.webp)