Lampiran 1
Return
Saham Rata-rata LQ-45 Periode Februari 2012 - Juli 2012
No Kode Efek
Hari Perdagangan
Senin Selasa Rabu Kamis Jumat
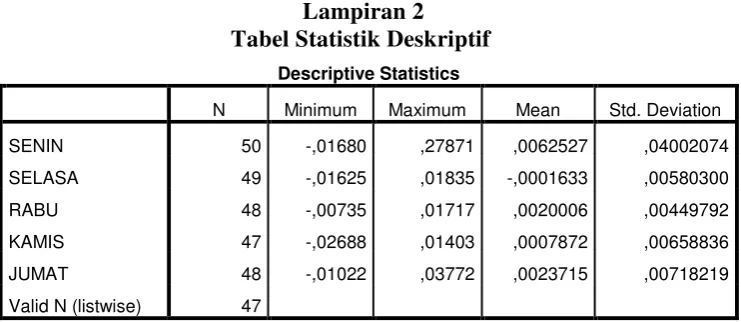
Lampiran 2
Tabel Statistik Deskriptif
Descriptive Statistics
N Minimum Maximum Mean Std. Deviation
SENIN 50 -,01680 ,27871 ,0062527 ,04002074
SELASA 49 -,01625 ,01835 -,0001633 ,00580300
RABU 48 -,00735 ,01717 ,0020006 ,00449792
KAMIS 47 -,02688 ,01403 ,0007872 ,00658836
JUMAT 48 -,01022 ,03772 ,0023715 ,00718219
Lampiran 3
Normal Parametersa,b Mean ,0000000
Std. Deviation ,01883203
Most Extreme Differences
Absolute ,297
Positive ,297
Negative -,275
Kolmogorov-Smirnov Z 4,624
Asymp. Sig. (2-tailed) ,000
a. Test distribution is Normal. b. Calculated from data.
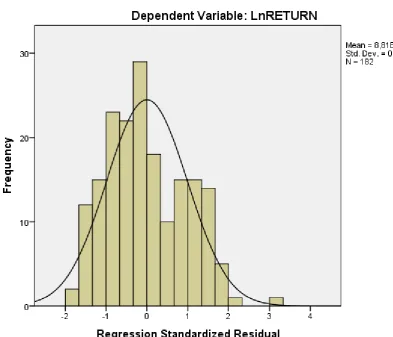
Setelah transformasi
One-Sample Kolmogorov-Smirnov Test
Unstandardized Residual
N 182
Normal Parametersa,b Mean ,0000000
Std. Deviation 1,67616218
Most Extreme Differences
Absolute ,076
Positive ,076
Negative -,060
Kolmogorov-Smirnov Z 1,030
Asymp. Sig. (2-tailed) ,239
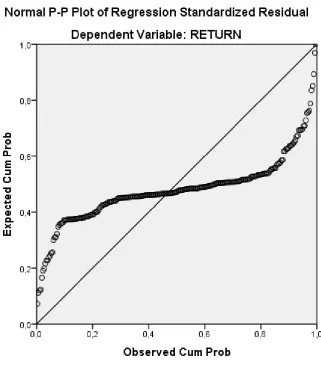
Grafik Normal P-Plot sebelum Transformasi
Lampiran 4
Uji Heteroskedastisitas
Coefficientsa,b
Model Unstandardized Coefficients Standardized Coefficients
t Sig.
B Std. Error Beta
1
DSEN ,065 ,321 ,015 ,202 ,840
DSEL -,231 ,346 -,050 -,669 ,504
DRAB ,159 ,317 ,038 ,501 ,617
DKAM -,068 ,317 -,016 -,214 ,831
DJUM ,032 ,321 ,007 ,098 ,922
a. Dependent Variable: Lnei2
Lampiran 5
Uji Multikolonieritas
Coefficientsa,b Model Unstandardized Coefficients Standardized Coefficients
t Sig. Collinearity Statistics
B Std. Error Beta Tolerance VIF
1
DSEN -6,839 ,279 -,429 -24,544 ,000 1,000 1,000
DSEL -7,195 ,300 -,420 -24,012 ,000 1,000 1,000
DRAB -6,954 ,275 -,442 -25,289 ,000 1,000 1,000
DKAM -7,093 ,275 -,451 -25,798 ,000 1,000 1,000
DJUM -6,900 ,279 -,433 -24,760 ,000 1,000 1,000
Lampiran 6
Uji Autokolerasi
Model Summaryc,d
Model R R Squareb Adjusted R Square
Std. Error of the Estimate
Durbin-Watson
1 ,973a ,946 ,944 1,69500 1,001
a. Predictors: DJUM, DKAM, DRAB, DSEL, DSEN
b. For regression through the origin (the no-intercept model), R Square measures the proportion of the variability in the dependent variable about the origin explained by regression. This CANNOT be compared to R Square for models which include an intercept.
Lampiran 7
Uji Analisis Regresi Berganda
Coefficientsa,b
Model Unstandardized Coefficients Standardized Coefficients
t Sig.
B Std. Error Beta
1
DSEN -6,839 ,279 -,429 -24,544 ,000
DSEL -7,195 ,300 -,420 -24,012 ,000
DRAB -6,954 ,275 -,442 -25,289 ,000
DKAM -7,093 ,275 -,451 -25,798 ,000
DJUM -6,900 ,279 -,433 -24,760 ,000
Lampiran 8
Uji ANOVA
Levene's Test of Equality of Error Variancesa
Dependent Variable: LnRETURN
F df1 df2 Sig.
,396 4 177 ,811
Tests the null hypothesis that the error variance of the dependent variable is equal across groups. a. Design: Intercept + HARI_PERDAGANGAN
Tests of Between-Subjects Effects Dependent Variable: LnRETURN
Source Type III Sum of
Squares
df Mean Square F Sig.
Corrected Model 2,941a 4 ,735 ,256 ,906
Intercept 8871,115 1 8871,115 3087,741 ,000
HARI_PERDAGANGAN 2,941 4 ,735 ,256 ,906
Error 508,523 177 2,873
Total 9406,460 182
Corrected Total 511,464 181
Multiple Comparisons Dependent Variable: LnRETURN
(I)
Sig. 95% Confidence Interval
Lower Bound Upper Bound
Tukey
Based on observed means.
Homogeneous Subsets
LnRETURN
HARI_PERDAGANGAN N Subset
1
Tukey HSDa,b,c
SELASA 32 -7,1947
KAMIS 38 -7,0934
RABU 38 -6,9536
JUMAT 37 -6,8996
SENIN 37 -6,8393
Sig. ,899
Means for groups in homogeneous subsets are displayed. Based on observed means.
The error term is Mean Square(Error) = 2,873. a. Uses Harmonic Mean Sample Size = 36,249.
b. The group sizes are unequal. The harmonic mean of the group sizes is used. Type I error levels are not guaranteed.