ASEAN INVESTMENT REPORT
Table of Contents
Executive Summary
Chapter One: General Ext ernal Environment
Global FDI Perf ormance
FDI int o Developed Count ries FDI Increases FDI int o Developing Count ries Cont inues
Chapter Two: ASEAN Investment Performance
ASEAN Invest ment Perf ormance in 2006 Int ra-ASEAN Invest ment s Flows
Chapter Three: FDI Outlook for 2007-2008 and Challenges
FDI Out look f or 2007-2008
Challenges Ahead and Enhancing ASEAN’ s Compet it iveness.
Chapter Four: Investment Policy Measures and Development s in ASEAN
ASEAN Economic Communit y Blueprint
New Invest ment Measures int roduced by ASEAN Member Count ries
Chapter Five: Conclusions and Recommendations
Tables, Graphs and Figures
Table 1: Dist ribut ion of Gl obal FDI Inf lows, 2002-2006 (US$ million) Table 2: ASEAN FDI Share and Growt h, 2002-2006 (US$ million) Table 3: Maj or Sources of FDI Flows t o ASEAN, 2004, 2005 and 2006
Table 4: Share of FDI Fl ows t o ASEAN by Economic Sect ors, 2004-2006 (US$ million) Table 5: World Bank Doing Business Rankings of ASEAN Member Count ries, China and India Table 6: Updat es of FDI and New Invest ment Measures Int roduced by ASEAN Member
Count ries
Graph 1: Rat e of Growt h of FDI int o Devel oped and Developing Count ries Graph 2: World FDI t o ASEAN and China (US$ billion)
Graph 3: World FDI t o ASEAN and India (US$ billion)
Figure 1: Share of Int ra-ASEAN Invest ors, 2006 Figure 2: Share of Int ra-ASEAN Recipient s, 2006
Figure 3: FDI Flows int o ASEAN by Sect ors, 2005-2006 (US$ million)
ASEAN INVESTMENT REPORT 2007
“Sustaining FDI Flows into the ASEAN Investment Area”
Executive Summary
1. 2006 was an excellent year for ASEAN in terms of foreign direct investments (FDI) inflows. ASEAN FDI performed consistently in terms of share and growth. ASEAN FDI grew by 27.5% from US$ 41.0 billionin 2005 to US$ 52.4 billion in 2006, taking a 23% share of FDI in the Asia and Oceania region. This growth sustained ASEAN’s FDI performance in 2005, where ASEAN FDI flows exceeded 1997.
2. Globally, FDI reached US$1.2 trillion in 2006, up by 34% from US$ 916 billion in 2005. The challenge for ASEAN in 2006 was to sustain and grow the level of FDI Flows that was achieved in 2005 given the increasing global FDI flows.
3. The top investors of ASEAN in 2006 were Japan, the United Kingdom, the United States of America, the Netherlands and Germany. In particular, Japanese investments into ASEAN surged 49% in 2006 after a few years of feeble growth in the early 2000s. Together with the above named developed countries, they contributed almost half of total FDI in ASEAN.
4. Intra-ASEAN investments has grown significantly over the last two years since it was draw attention to that this was an area that should be a main contributor for FDI growth for ASEAN. The revised and updates statistics for 2005 currently indicates that intra-ASEAN investments was US$3.76 billion or 9.2% of total ASEAN FDI. For 2006, intra-ASEAN investments grew by 66% to US$6.24 billion, contributing 12% of total FDI in ASEAN. This is a significant increase and highly satisfying for ASEAN member countries which have made intensive efforts to promote intra-ASEAN investments.
5. FDI outlook for 2007-2008 remains bright and is build upon the increasing interest and confidence by investors in investing and doing business in the region. Barring any financial or economic shocks, such as a recession in the United States, this favourable outlook is expected to continue in the next few years. Against this background, flows to ASEAN in 2007 are projected to reach another record level - surpassing $60 billion in 2007, up from $52.4 billion in 2006.
7. In addition, the ASEAN Leaders have endorsed the ASEAN Economic Community Blueprint which outlines that vision and provides a practical plan to turn the vision into reality. The Blueprint is the result of cooperative efforts of various stakeholders. It is a plan to create an attractive investment climate that stimulates ongoing developments in ASEAN and promotes enterprise growth, as well as job creation.
8. As part of the response to global and regional challenges and opportunities, the ASEAN Investment Area (AIA) Council of Ministers has agreed to revise the Framework Agreement on the ASEAN Investment Area and merge with the ASEAN Agreement on the Promotion and Protection of Investments into a single agreement known as the ASEAN Comprehensive Investment Agreement (ACIA).
Chapter One: General External Environment
Global FDI Performance
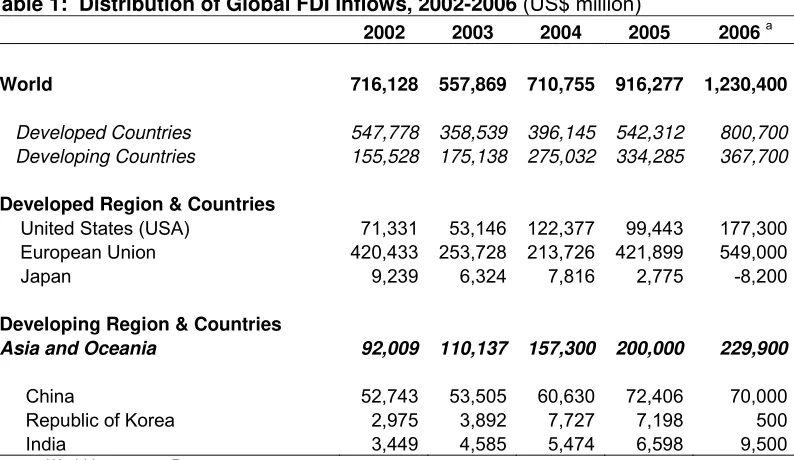
10. Based on UNCTAD preliminary estimates, global foreign direct investment (FDI) reached US$1.2 trillion in 2006, up by 34% from last year’s level of US$ 916 billion.
11. Significant growth was recorded in FDI flows to developed and developing economies (Table 1). In particular, FDI flows to Asia and Oceania maintained their upward trend, reaching a new high of US$ 230 billion – a 15% increase from 2005 level. The share of the Asia and Oceania region in total FDI to developing countries also rose from 59% to 63%.
Table 1: Distribution of Global FDI Inflows, 2002-2006 (US$ million)
2002 2003 2004 2005 2006 a
World 716,128 557,869 710,755 916,277 1,230,400
Developed Countries 547,778 358,539 396,145 542,312 800,700 Developing Countries 155,528 175,138 275,032 334,285 367,700
Developed Region & Countries
United States (USA) 71,331 53,146 122,377 99,443 177,300 European Union 420,433 253,728 213,726 421,899 549,000
Japan 9,239 6,324 7,816 2,775 -8,200
Developing Region & Countries
Asia and Oceania 92,009 110,137 157,300 200,000 229,900
China 52,743 53,505 60,630 72,406 70,000 Republic of Korea 2,975 3,892 7,727 7,198 500
India 3,449 4,585 5,474 6,598 9,500
Source: World Investment Report 2007
a) Preliminary Estimates
FDI into Developed Countries FDI Increases
Graph 1: Rate of Growth of FDI into Developed and Developing Countries (US$ billion)
Source: World Investment Report 2007
FDI into Developing Countries Continues
13. Foreign Direct Investments into the developing countries grew at a decent rate of 10.0% in 2006 to US$367.7 billion. Preliminary estimates indicate that China continued to receive the highest amount of FDI of US$70 billion among the developing countries (19% of total). The huge amount of FDI into China has propelled China to record four consecutive annual GDP growth of above 10%. It is expected that Chinese annual economic growth would surpass the 10% mark in 2007 (based on the annualized growth rate of 11.5% in the 1st three quarters of 2007) and is forecast to exceed 10% in 2008 too. FDI into China is expected to be maintained at a high level for the foreseeable future.
Graph 2: World FDI to ASEAN and China (US$ billion)
Source: World Investment Report 2007; ASEAN Secretariat: ASEAN FDI Database 2007, BOP Basis
14. Another strong engine of economic growth within the developing countries is India. India’s economic growth over the last few years has been equally impressive as China. FDI to India has rose steadily since 2003 and rose by a record 44% from US$6.6 billion in 2005 to US$9.5 billion in 2006. The Indian government continued to undertake comprehensive reforms in its FDI policy and was highlighted as the top reformer in trading across borders in the World Bank report on ease of “Doing Business 2008”.
Graph 3: World FDI to ASEAN and India (US$ billion)
Source: World Investment Report 2007; ASEAN Secretariat: ASEAN FDI Database 2007, BOP Basis ASEAN
India
ASEAN
India
ASEAN
India
ASEAN
India
ASEAN
India
0 10,000 20,000 30,000 40,000 50,000 60,000
Chapter Two: ASEAN Investment Performance
ASEAN Investment Performance in 2006
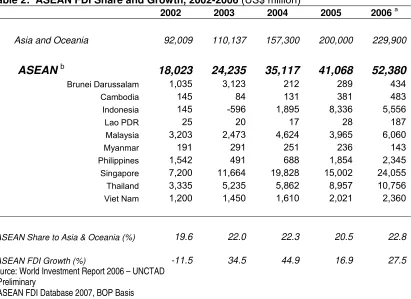
15. 2006 was an excellent year for ASEAN in terms of FDI inflows. ASEAN FDI performed consistently in terms of share and growth (Table 2). ASEAN FDI grew by 27.5% from US$ 41.0 billion1 in 2005 to US$ 52.4 billion in 2006, taking a 23% share of FDI in the Asia and Oceania region. This growth sustained ASEAN’s FDI performance in 2005, where ASEAN FDI flows exceeded FDI flows during the 1997 crisis.
16. Almost all ASEAN countries recorded significant improvements in FDI flows in 2006 compared to 2005. Singapore’s FDI grew 60.3%, Malaysia’s FDI grew 52%, Philippines’s FDI grew 26.5% and Thailand’s FDI grew by 20.1% to hit US$10.7 billion (exceeding the US$10 billion mark for the first time).
Table 2: ASEAN FDI Share and Growth, 2002-2006 (US$ million)
2002 2003 2004 2005 2006 a
Asia and Oceania 92,009 110,137 157,300 200,000 229,900
ASEAN b 18,023 24,235 35,117 41,068 52,380
Brunei Darussalam 1,035 3,123 212 289 434
Cambodia 145 84 131 381 483
Indonesia 145 -596 1,895 8,336 5,556
Lao PDR 25 20 17 28 187
Malaysia 3,203 2,473 4,624 3,965 6,060
Myanmar 191 291 251 236 143
Philippines 1,542 491 688 1,854 2,345
Singapore 7,200 11,664 19,828 15,002 24,055
Thailand 3,335 5,235 5,862 8,957 10,756
Viet Nam 1,200 1,450 1,610 2,021 2,360
ASEAN Share to Asia & Oceania (%) 19.6 22.0 22.3 20.5 22.8
ASEAN FDI Growth (%) -11.5 34.5 44.9 16.9 27.5
Source: World Investment Report 2006 – UNCTAD
a) Preliminary
b) ASEAN FDI Database 2007, BOP Basis
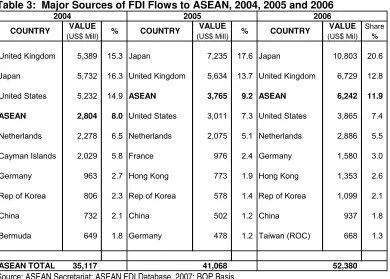
17. The top investors of ASEAN in 2006 were Japan, the United Kingdom, the United States of America, the Netherlands and Germany. In particular, Japanese investments into ASEAN surged 49% in 2006 after a few years of feeble growth in the early 2000s. Together with the other developed countries named above, they contributed almost half
of total FDI in ASEAN. Table 3 below shows ASEAN’s top ten investors in 2004, 2005 and 2006.
Table 3: Major Sources of FDI Flows to ASEAN, 2004, 2005 and 2006
VALUE VALUE VALUE Share
(US$ Mill) (US$ Mill) (US$ Mil) %
United Kingdom 5,389 Japan15.3 7,235 Japan17.6 10,803 20.6 Japan 5,732 United 16.3 Kingdom 5,634 United 13.7 Kingdom 6,729 12.8 United States 5,232 14.9 ASEAN 3,765 9.2 ASEAN 6,242 11.9 ASEAN 2,804 8.0 United States 3,011 7.3 United States 3,865 7.4 Netherlands 2,278 6.5 Netherlands 2,075 5.1 Netherlands 2,886 5.5 Cayman Islands 2,029 5.8 France 976 2.4 Germany 1,580 3.0 Germany 963 2.7 Hong Kong 773 1.9 Hong Kong 1,353 2.6 Rep of Korea 806 2.3 Rep of Korea 578 1.4 Rep of Korea 1,099 2.1 China 732 2.1 China 502 1.2 China 937 1.8 Bermuda 649 1.8 Germany 478 1.2 Taiwan (ROC) 668 1.3
ASEAN TOTAL 35,117 52,38041,068 2006 COUNTRY %
COUNTRY % 2004
COUNTRY 2005
Source: ASEAN Secretariat; ASEAN FDI Database, 2007; BOP Basis.
18. Korea and China were the fastest growing sources of FDI, rising by 90% (from US$578 million in 2005 to US$1 billion in 2006) and 87% (from US$502 million in 2005 to US$937 million in 2006), respectively. This rise has occurred against the backdrop of strong economic growth in these countries and the conclusion of the ASEAN-China and ASEAN-Korea Free Trade Areas have spurred greater bilateral investments between ASEAN and China/Korea.
Intra-ASEAN Investments Flows
19. Intra-ASEAN investments has grown significantly over the last two years since it was draw attention to that this was an area that should be a main contributor for FDI growth for ASEAN. Last year, the ASEAN Investment Report indicated that the intra-ASEAN investments totalled some US$2.2 billion amounting to a mere 5.8% of total ASEAN FDI. However, the revised and updates statistics currently shows that the intra-ASEAN investments in 2005 totalled US$3.76 billion or some 9.2% of total intra-ASEAN FDI.
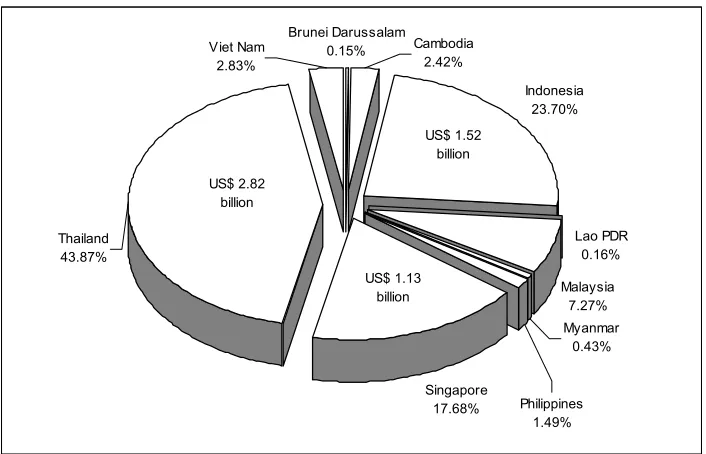
Figure 1: Share of Intra-ASEAN Investors, 2006
Source: ASEAN Secretariat; ASEAN FDI Database, 2007; BOP Basis.
21. The top three recipients of intra-ASEAN investment, in 2006 (Figure 2), were Thailand, Indonesia and Singapore with a total share of 88% (US$ 5.48 billion). The CLMV countries’ received US$ 376 million of investment (6% of total intra-ASEAN FDI). The ASEAN-6 countries are committed to continue making outbound investment missions to the CLMV countries to boost intra-ASEAN investments into these countries.
Figure 2: Share of Intra-ASEAN Recipients, 2006
Source: ASEAN Secretariat; ASEAN FDI Database, 2007; BOP Basis.
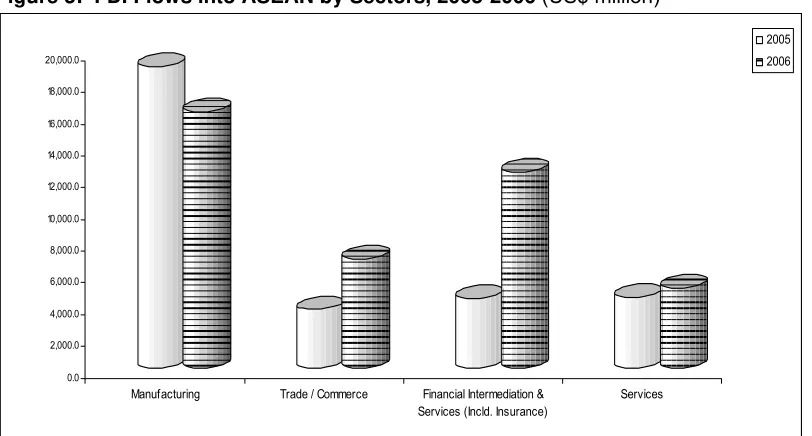
22. By economic sectors, the top recipients of ASEAN FDI were manufacturing,
financial intermediation and related services, including insurance, trade/commerce and
services. Altogether, these sectors accounted for 76% of total FDI. Figure 3 below
shows FDI flows into ASEAN by sectors in 2005 and 2006. Table 4 shows the sectoral share of FDI flows for the period from 2002 to 2006.
Figure 3: FDI Flows into ASEAN by Sectors, 2005-2006 (US$ million)
0.0
Manufacturing Trade / Commerce Financial Intermediation & Services (Incld. Insurance)
Services
2005 2006
Source: ASEAN Secretariat; ASEAN FDI Database, 2007; BOP Basis.
Table 4: Share of FDI Flows to ASEAN by Economic Sectors, 2004-2006 (US$ million)
YEAR 2004 2005 2006 ECONOMIC SECTOR Value Share Value Share Value Share
AGRICULTURE, FISHERY AND
FORESTRY 221.7 0.6 184.4 0.4 341.0 0.6
MINING AND QUARRYING 557.5 1.6 2,266.1 5.5 1,376.0 2.6
MANUFACTURING 12,802.1 36.5 18,988.5 46.2 16,147.2 30.3
CONSTRUCTION -10.1 0.0 226.5 0.6 523.4 1.0
TRADE / COMMERCE 4,973.9 14.2 3,675.6 8.9 6,835.8 12.8 FINANCIAL INTERMEDIATION AND 9,559.2 27.2 4,355.5 10.6 12,360.7 23.2 SERVICES (incld. Insurance)
REAL ESTATE 1,439.2 4.1 2,110.2 5.1 4,154.1 7.8
SERVICES 2,801.6 8.0 4,467.0 10.9 5,038.9 9.4
OTHERS (Not Elsewhere Classified) 2,834.3 8.1 3,957.5 9.6 4,544.4 8.5
Source: ASEAN Secretariat; ASEAN FDI Database, 2007; BOP Basis.
23. Notably, the fastest growing sectors in 2006 were financial intermediation and
related services sectors, which increased from US$4.4 billion in 2005 to US$12.4 billion
and construction, which increased from US$226 million in 2005 to US$523 million.
Record increases were also noted for real estate and trade/commerce, which grew by 97% and 86% in 2006, respectively. Strong growth in the financial intermediation and
increasing significance of the Services sector as the main sector for FDI in ASEAN. In terms of share, in 2006, manufacturing accounted for 30.3% of total FDI, followed by
financial intermediation and related services sectors (23.2%) and trade and commerce
(12.8%).
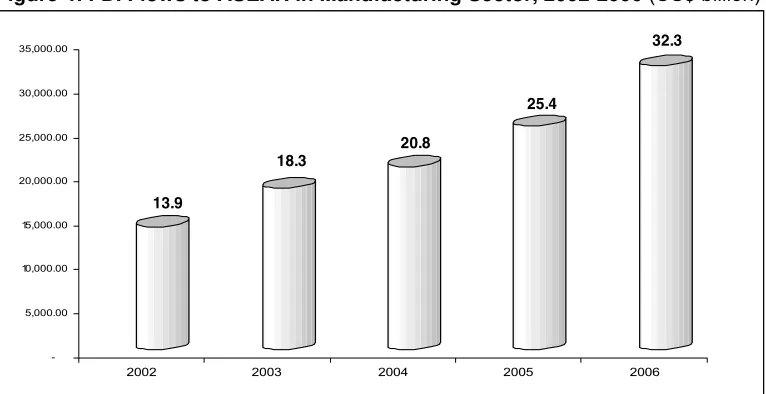
24. Meanwhile, consistent with the overall growth of FDI in ASEAN, Approved Manufacturing Investment grew by 27 % to US$32.3 billion from US$25.4 billion in 2005 (Figure 4). The main sectors of investment include radio, television and communication
equipment & apparatus; chemicals & chemical products; basic metals; machinery &
equipment; andnon-metallic mineral products.
Figure 4: FDI Flows to ASEAN in Manufacturing Sector, 2002-2006 (US$ billion)
Source: ASEAN Secretariat; ASEAN FDI Database, 2007; Approval Basis.
25. Notably, preliminary estimates of Approved Manufacturing Investments for the first half of 2007 recorded a 147% increase to US$30.8 billion from US$12.4 billion in the same period last year. This indicates the continued strength of the manufacturing sector in ASEAN.
13.9
18.3
20.8
25.4
32.3
-5,000.00 10,000.00 15,000.00 20,000.00 25,000.00 30,000.00 35,000.00
Chapter Three: FDI Outlook for 2007-2008 and Challenges
FDI Outlook for 2007-2008
26. FDI flows to ASEAN have been increasing since 2002. This upward trend is reflective of increasing interest and confidence of investors in investing and doing business in the region. Barring any financial or economic shocks, such as a recession in the United States, this favourable trend is expected to continue in the next few years. Against this background, flows to ASEAN in 2007 are projected to reach another record level - surpassing $60 billion in 2007, up from $52.4 billion in 2006.
27. Aside from external influences favourable to the region, a number of other ASEAN-specific factors will contribute to the optimistic outlook in 2007 and 2008. Flows to the region's manufacturing sector will remain strong and investment in services industries is expected to grow further as well as those in the oil and gas industries. Strong regional macroeconomic fundamentals, further opening up of industries for FDI and regional integration will help ASEAN attracts new Greenfield FDI and intra-ASEAN investments and encourage more reinvestment from existing foreign firms in the region. The increasing global demand for oil and gas will continue to benefit resource rich ASEAN countries as foreign investors position themselves to secure access to energy supply. Services industries will continue to account for a substantial share of FDI inflows, particularly in such sectors as telecommunication and finance, which are likely to be driven by cross-border mergers and acquisition (M&A) transactions. M&As in the region in 2007 are expected to be significantly stronger than the year before and will help increase the level of FDI inflows.
28. Intra-ASEAN investments flow is expected to become increasingly important as an engine for FDI growth and for ASEAN economic integration. Intra-ASEAN investments have recovered from a projected low of 5.8% in 2005 to hit 11.9% in 2006. There is much room for improvement in this area, compared with the experience of the EU and NAFTA in terms of intra-regional investments. For the CLMV countries, cumulative intra-ASEAN investments (1999-2006) amounted to US$2.4 billion, about 21.2% of the CLMV’s total cumulative FDI (1999-2006). This significant percentage suggests that intra-ASEAN FDI was a strong integration driver and will continue to have a more prominent role for investments into the CLMV within the next few years.
Challenges Ahead and Enhancing ASEAN’s Competitiveness
Challenges Ahead
risks and avian influenza. Increasing the looming threat of a significant slow-down in the US economy is weighing heavily on the growth prospects of the region.
30. In addition, competition for FDI will continue to come from China and India, as these countries continue to introduce policy reforms. Competition from other regions and other FTA arrangements, such as the enlargement of the EU, will add to the competitive pressure. ASEAN will need to be more proactive to attract more FDI.
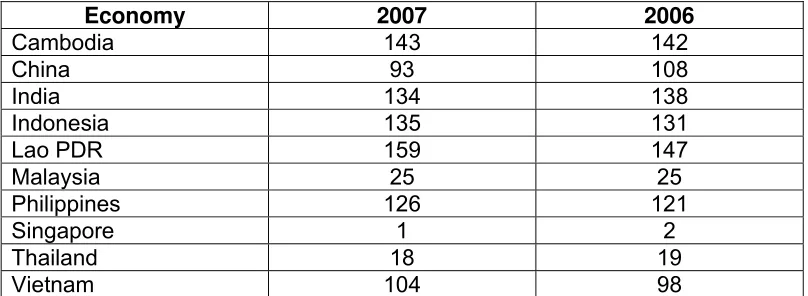
31. Based on the latest published World Bank Report on Doing Business 2007 in October 2007 (see Table 5), which uses an ease of doing business index1 in ranking economies, China and India’s ranking rose from 108 to 93 and 138 to 134, respectively.
Table 5: World Bank Doing Business Rankings of ASEAN Member Countries, China and India
Economy 2007 2006
Cambodia 143 142
China 93 108
India 134 138
Indonesia 135 131
Lao PDR 159 147
Malaysia 25 25
Philippines 126 121
Singapore 1 2
Thailand 18 19
Vietnam 104 98
Note: The World Bank Report on Doing Business does not include Brunei Darussalam and Myanmar in its analysis. Source: World Bank Report on Doing Business 2007.
32. However, the ranking of all other ASEAN countries, except Singapore (which has been ranked number 1 from number 2), Thailand (which rose from 19 to 18) and Malaysia (which maintained its ranking at 25), have declined.
33. The World Bank Report, in particular, indicated that China and India had the biggest improvements in “starting a business”. China and India both reduced business start-up from 48 days to 35 days and from 89 days to 35 days, respectively. India simplified its complex tax registration system, more than halving start-up time. China amended its company law, reducing the minimum capital requirement by 70% and eliminating substantive review at the registry. The Report is a clear indication of China and India’s commitment to improve their investment climate.
1
Chapter Four: Investment Policy Measures and Developments in ASEAN
ASEAN Economic Community Blueprint
34. In response to the challenges and opportunities globally, ASEAN agreed to accelerate its economic integration efforts to enhance competitiveness. The vision of ASEAN Leaders is to transform ASEAN into a single market and production base, highly competitive and fully integrated into the global community by 2015 with an emphasis on equitable economic development where all citizens share in the benefits of ASEAN economic integration.
35. The ASEAN Economic Community Blueprint outlines that vision and provides a practical plan to turn the vision into reality. The Blueprint is the result of cooperative efforts of various stakeholders. It is a plan to create an attractive investment climate that stimulates ongoing developments in ASEAN and promotes enterprise growth, as well as job creation.
36. The ASEAN Investment Area (AIA) Council of Ministers has agreed that the region should be more aggressive in its efforts at attracting FDI. Ten years after the signing of the AIA Agreement and in support of the development of an ASEAN Economic Community (AEC) Blueprint, the AIA Council agreed to revise the Framework Agreement on the ASEAN Investment Area and merge with the ASEAN Agreement on the Promotion and Protection of Investments into a single ASEAN Comprehensive Investment Agreement (ACIA).
37. Based on the agreed Guiding Principles of the Revised Agreement, the key features of ACIA are:
• Comprehensive investment liberalisation and protection provisions;
• Clear timelines for investment liberalisation in line with the ASEAN Economic Community;
• Benefits extended to ASEAN-owned investors and foreign-owned ASEAN-based investors;
• Preservation of AIA preferential treatment; and
• A more liberal, facilitative, transparent and competitive investment environment.
38. The deepening and broadening of ASEAN economic integration will not only lead to more sustainable economic growth but also increase the region’s resilience from adverse impact of any internal and/or external economic and financial shocks.
New Investment Measures introduced by ASEAN Member Countries
40. These individual measures are encouraged by various regional agreements and multilateral bodies to increase the competitiveness of the region in attracting FDI. These include the improvements of the overall investment policy framework, granting of incentives, opening up of sectors for foreign investments, reduction of business cost through lowered taxation, streamlining and simplification of the investment process, and other investment facilitation measures.
41. The proceeding table enumerates the highlights of national policy changes that ASEAN countries have implemented.
Table 6: Updates of FDI and New Investment Measures Introduced by ASEAN Member Countries
Country Developments in FDI
Brunei Darussalam
FDI Flows in 2006 and 1st Quarter 2007 (BOP Basis)
Foreign Direct Investment (FDI) for the year 2006 had been recorded at BND 689.6 million, a growth of 43.1 per cent over the previous year at BND 481.9 million which was mainly attributed to the mining sector. By country of origin, United Kingdom was the largest contributor of FDI inflows at 50.5 per cent, followed by France (19.4 per cent), Japan (8.1 per cent), Bermuda (7.7 per cent), USA (7.3 per cent), Canada (3.1 per cent), Malaysia (1.8 per cent), China (1.1 per cent) and others (1.0 per cent).
By region, European Union (EU) continued to be Brunei Darussalam’s largest source of FDI, accounted for 70 per cent of the total FDI inflows of which, United Kingdom and France contributed 72.3 per cent (BND 348.6 million) and 27.7 per cent (BND 133.1 million) respectively. Within ASEAN countries, Malaysia and Singapore were the main investors contributing about 78.1 per cent (BND 12.1 million) and 16.6 per cent (BND 2.6 million) respectively, majority of which were invested in construction and real estate sector.
By industrial sector, mining was still the largest recipient of FDI in 2006 accounted for 81.2 per cent (BND 559.8 million) share of total investment, followed by manufacturing at 16.2 per cent (BND 111.80 million), trade & commerce at 1.3 per cent (BND 9.1 million), construction at 0.8 per cent (BND 5.4 million), real estate at 0.4 per cent (BND 2.8 million) and others at 0.1 per cent (BND 0.8 million).
In 2006, the number of companies with foreign participation increased by 26% (219 companies) compared with 174 companies in the previous year.
Foreign Direct Investment (FDI) for the first quarter of 2007 recorded USD 61.1 million, a significant growth over the previous quarter with USD 1.5 million. By country of origin, the main investors came from Japan with 73.3 per cent of total FDI inflows followed by Malaysia (7.2 per cent), Canada (4.6 per cent), Singapore (3.5 per cent), Hong Kong (3.5 per cent), USA (3.5 per cent) and China (3.0 per cent)
Country Developments in FDI
USD 61.1 million. Meanwhile European Union (EU) contributed 1.3 per cent with an amount of USD 7.1 million. Within ASEAN countries, Malaysia and Singapore were the main investors contributing about 66.4 per cent (USD 40.5 million) and 32.5 per cent (USD 19.9 million) respectively, majority of which were invested in construction and real estate sector.
By industrial sector, manufacturing was the largest recipient of FDI in Q1 2007 accounted for 83.2 per cent (USD 412.5 million) share of total investment, followed by financial intermediation at 17.4 per cent (USD 98.0 million) and mining at 8.8 per cent (USD 50.0 million).
Administrative Foreign Investment in 1st Half 2007
Foreign Investment (FI) in Brunei Darussalam for the first half of 2007 showed an increase compared to previous year. There were 6 new projects in first-half of 2007 amounting USD 14.6 million compared to previous year which were only 5 new projects amounting USD 4.1 million. The investment mostly came from Europe and Malaysia.
Cambodia FDI Flows and Investment Abroad in the 1st Quarter 2007 (BOP Basis)
With regard to foreign direct investment project approval data, BOP-FDI was estimated to be a net inflow of US$203.6 million in the first quarter 2007, up US$79 million on the net inflow recorded from the fourth quarter 2006 and up US$96.5 million on the net inflow recorded for the same quarter last year. This was due to an increase of US$77.5 million in equity capital of non-bank sector, largely reflecting an increase in the inflow of foreign direct investment enterprises. The main inflow during that period were investments in Agricultures (US$81.0 million), Garments (US$45.5 million), Banks (US$20.5 million), Telecommunications (US$17.9 million), and Beverages (US$12.2 million). China took the largest share of the investment.
During the same period, the net outflow of Cambodian direct investment abroad was estimated to be small. The level of Cambodian direct investment abroad is also small, and mainly comprises of capital investment in housing and retail businesses.
The level of the actual foreign direct investment in Cambodia amounted to US$3,157.9 million in the first quarter 2007, up from US$2,954.2 million at the end 2006. These estimations were based on accumulated flows data since 1994.
Foreign Direct Investment Survey
Country Developments in FDI
Administrative Direct Investment Abroad in 1st Half 2007
In the first half of 2007 the inflow of foreign investment in Cambodia revised a total amount of ($401 million), showing ($930 million) lower than the second half of 2006.
The main amount of investment projects approved by the Council for the Development of Cambodia were mobile phone network, fixed and wireless communication service alcohol industry and agricultural products processing and cloths manufacturing and embroidery. Vietnam took the largest share of total investment during that period.
In the second half of 2006, the largest amount of foreign investment projects were explore and oil refinery ($400 million) resort development ($277 million) and hydroelectric power plan ($170 million) indicating the difference between the first half of 2007 and the second half of 2006.
Indonesia FDI Flows in 1st Quarter 2007 (BOP Basis)
During the 1st quarter of 2007, FDI in Indonesia registered a net surplus of USD3.9 billions, increased by 15.5% from the same period in the previous year. This increase mainly supported by the above average increases of DI inflow ON non-oil and gas sector which recorded 57.8%. On the other hand, DI inflow on oil and gas sector had a decrease of 4.4%. While at the same period, DI in Indonesia also showed outflow USD 2.8 billions, increased 37.8% from Q1 2006. The main cause was the soaring of debt repayments from Indonesian non-oil and gas sectors companies to their company’ parent abroad. It reached USD1.4 billions or significantly increased by 105.6%.
As an oil producing country, investment development on oil and gas sector has main role on supporting Indonesian economy and as major indicator of foreign investment intention to the country also. Inflow of DI in oil and gas sector decreased slightly by 4.4% from USD 1.64 billions in the Q1 2006 to USD 1.57 billions in Q1 2007, which was driven by lower activities in energy sector due to the decrease of the proven reserve of oil from the several blocks, such as West Seno block, Makassar Strait block, and Sadewa-West Kalimantan block. In the other hand, the soaring oil prices caused the increasing of production cost. This condition, in turn, caused slightly increased of DI outflows in form of Cost Recovery from USD1.34 billions in Q1 2006 to USD1.37 billions in Q1 2007. The main investors in oil and gas sector, according to country origin, are USA, Japan, France, China, and UK. These five countries invested nearly USD1.5 billions and accounted for 92% of total investment in oil and gas sector.
Country Developments in FDI
FDI in Indonesia by Country of Origin
In Q1 2007, most of the FDI coming to Indonesia sourced from the Netherlands (USD1 billion), Japan (USD0.8 billions), Singapore (USD0.4 billions), USA (USD0.3 billions) and France (USD0.2 billions). These five countries total investment was USD 2.7 billions, or 70% of total FDI coming to Indonesia.
Other source of investment in Indonesia is Reinvested Earnings (RE). During first quarter of 2007, reinvested earnings of companies that originated from Singapore, Japan, Germany, the Netherlands, and South Korea, amounted to USD 0.8 billions or 63% of total reinvested earnings.
By comparing total inflows and total outflows, at present, USA position as the biggest investor has been replaced by Japan. This is because most of the Japanese investor reinvested their earning in Indonesia, and also because of most USA affiliated companies in Indonesia repaid their parent companies.
FDI in Indonesia by Economic Sectors
The composition of FDI coming to Indonesia by economic sector remained focusing on Manufacturing, Financial Institution, and Services sectors. These three biggest sectors accounted for 97% of total FDI in Indonesia.
Recent Activities in Improving FDI Data Collection
There are some efforts taken by Bank Indonesia in order to improve the quality of Direct Investment (DI) to Indonesia data, as has been always reported on the previous WGFDIS series meetings. Current results that deserved to be shared are:
Gathering data on Cross Border Mergers and Acquisitions (M&A) by subscribing to Thomson Financial Database
Started from April 2007, Bank Indonesia had been subscribing to Thomson Financial Database, a database which contained data on M&A transactions from 1999, to Indonesia and all over the world. This database has been used in producing the Indonesia’s M&A data and this database also used in verifying the FDI data for BOP, for example if there is any big M&A transactions, BI will invite the related company and request for explanation.
Gathering data on ASEAN Multinational Enterprises (MNEs) from secondary sources
BI used information from Jakarta Stock Exchange (JSX) and Surabaya Stock Exchange, which contained information such as number of overseas company and share of ownership of Indonesian local company.
Enhancing the External Debt Reporting System Output
Country Developments in FDI
to check position and flow data reconciliation. The standardized table produced from the enhanced External Debt Reporting System (Sistem Informasi Utang Luar Negeri/SIUL) would lead to on line process for BOP compilation. This process hopefully could increase the BOP compilation accuracy.
Improving FDIS Analysis Process
Bank Indonesia, c.q. Balance of Payment Bureau, has been conducting FDI Survey (FDIS) since 2000. In order to improve the quality of survey analysis process, it has been applied the on line analysis process by using COGNOS software. BOP Bureau has also used the similar software for export-import data analysis. By adopting COGNOS, the processing time of survey result analysis would be reduced and the result has better quality.
Administrative Foreign Investment in 1st Half 2007
During the period of January until June 2007, the foreign capital investment in industry sector reaches 227 projects with an investment value of US$ 17,888.4 million. As a comparison, the following table shows the comparison between the period from January until June 2007 with the corresponding period in 2006 (year-on-year).
In first half of year 2007, the total amount and the total number of most the preferable investment plans for all sectors are chemicals and pharmaceuticals industry = US$. 13,664.6 million (20 projects), paper and printing industry = US$. 2,052.1 million (8 projects), Food product and beverages = US$. 1,079.6 million (36 projects), non-metallic mineral industry = US$. 277.4 million (4 projects) and metal, machinery and electronic industry = US$. 231.5 million (47 projects).
The most outstanding country of origin is United States of America (USA) = US$. 13,075.4 million (3 projects), Singapore = US$. 636.2 million (30 projects), Malaysia = US$. 424.8 million (21 projects), Other Europe = US$. 165.1 million (3 projects) and United Kingdom = US$. 162.5 million (4 projects).
The most outstanding ASEAN countries are Singapore = US$ 636.2 million (30 projects), Malaysia = US$ 424.8 million (21 projects), and Thailand = US$ 251.9 million (1 project).
Factors Affecting Such Trends and Developments
Political and Economic stability.
Indonesia has reached a new era after held a democratically election for the first time in it’s history. This mean that the President was elected directly by most of Indonesian which could bring more stable political condition and the political stability finally will improve the economic stability.
Macro economic performance in the first half of year 2007 have shown a positive sign such as :
- Rupiah’s exchange rate remained favourable;
- Inflation rate was relatively controllable at a reasonably low level of 6.5%;
Country Developments in FDI
- Interest rate was cut at 8.00%
The diligent effort to establish a better investment climate and regulation by the Government of Indonesia has shown a positive indication that bring more expectation for investor to come.The effort to establish a better investment climate and regulation also have been followed by unceasing investment promotion activities.
National measures and policy changes introduced or announced in 2007 to attract greater FDI flows
In order to support the investment increase especially Foreign Capital Investment, government issues some policies such as:
1. Regulation of Government of the Republic of Indonesia Number 1 of 2007 regarding Income Tax Facilities for Investment in particular field and area. Based on the new income tax facility, which allows: deduction on net income (before tax) as much as 30% for 6 years (5% per year) of the realized investment; accelerated depreciation and amortization for maximum of 10 years; loss carried forward facility for period of up to 10 years; 10% income tax in dividends paid for overseas tax payer or possibly lower if stipulated in the provisions of a particular tax treaty.
2. Regulation of Government of the Republic of Indonesia Number 7 of 2007 Regarding the third amendment to government regulation Number 12 of 2001 regarding import and/or transfer of strategic certain taxable items which included in value added tax exemption.
3. Regulation of Government of the Republic of Indonesia Number 38 of 2007 regarding distribution of government arrangement between Central Government, Provincial Government and Regional Government.
4. Law of the Republic of Indonesia Number 25 of 2007 concerning Investment. The Investment Law sets investment’s principles and objectives; basic investment policies; types of business entities and locations; treatment towards investment; labor; business sectors; investment development for micro, SMEs, and cooperatives; rights, obligations and responsibilities; implementation of investment; special economic zones; dispute settlement and sanctions.
5. Credential decree number 77/2007 concerning list of line of business closed and open with condition to investment.
Lao PDR FDI flows in 2006 and 1st Quarter 2007 (BOP Basis)
Country Developments in FDI
contributing to FDI flows were France (US$155.79 million); followed by Thailand (US$7.75 million), China (US$5.28 million), Viet Nam (US$ 2.81 million) and Taiwan (US$ 2.22million). Looking at Intra-ASEAN, Thailand remained the largest contributor in 2006 and followed by Viet Nam, investing mainly on electricity generation and manufacturing.
FDI in the first quarter of 2007 continued to have a significant increase of US$ 126 million, approximately 9 times increase compared to the same period last year. Much of inflows were attributed to agriculture sector accounted for US$ 32.14 million, manufacturing US$ 21.35 million, financial intermediation and service US$ 15.54 million, services US$ 12.11 million, mining and quarrying US$ 7.66 million, respectively. FDI classified by zones, ASEAN was the largest flows of capital with value of US$ 54.39 million, mostly from Thailand and Singapore; followed by joint countries US$ 36.06 million, Japan US$ 17.57 million, Europe US$ 12.5 million and ANIEs US$ 3.46 million.
Improvement of FDI data collection and monitoring
In order to improve FDI data collection and monitoring, Bank of the Lao PDR has some progresses during 2007 as follows:
- Attempt to establish a working group among concerned agencies: Bank of the Lao PDR, National Statistical Centre, and Department for Domestic and Foreign Investment;
- Develop a database management programme, so called: International Transaction Reporting System (ITRS), which is ongoing;
- Organized a seminar on the role of BOP and its importance to concerned agencies: Commercial Banks, Ministry of Finance, National Statistical Centre, etc.
Administrative Foreign Investment in 2006 and 1st Half 2007
In 2006, 156 projects of foreign direct investment were approved with the value at US$ 3,045.9 million. Of total investment, manufacturing sector received 45 projects amounting for US$ 1302.9 million or sharing 34.1% of total investment. This sector, 71.3% was from wood and wood products, 14.6% from non-metal mineral products, 9.5% from foods and beverage, and 2.8% from other sectors.
The major sources of foreign investment in manufacturing sector were Viet Nam (US$ 383 million), India (US$ 350 million), Thailand (US$ 38.7 million), and Korea (US$ 29 million).
In the first half of 2007, total value of foreign investment was US$ 700.5 million, with 92 projects approved. Of total investment, manufacturing sector shared 10% and valued at US$ 70.8 million, with the 28 approved projects. Manufacturing sector showed a downward trend for first half of 2007 compared with the first half of 2006 which registered at US$ 863.8 million. This was due to the more attraction on other industries, which shared 90% of total investments in the first half of 2007.
Country Developments in FDI
The major sources of foreign investment in manufacturing sector were Viet Nam (US$ 34.9 million), China (US$ 4.1 million), Japan (US$ 3.8 million), Thailand (US$ 3.2 million), and joint countries (US$ 22.4 million).
Malaysia FDI Flows in 2006 and 1st Quarter 2007 (BOP Basis)
In 2006, Malaysia’s FDI sustained a net inflow of US$6.1 billion; a significant increase of 52.8% from that of US$4.0 billion in 2005. This was mainly due to significant increase on Equity, which amounted to US$3.2 billion from that of US$0.4 billion recorded in 2005; and Reinvested Earnings, which increased by 15.1% (+US$0.6 billion) from US$3.9 billion in 2005. Loans showed higher net outflow of US$1.5 billion in 2006 from that of US$0.3 billion in 2005. In terms of contribution to total net FDI, Reinvested Earnings showed the biggest share of 73.4%.
In 2006, Japan remained the leading economy with US$2.8 billion worth of investment. This was followed by United States of America (US$1.4 billion), Singapore (US$0.47 billion), Hong Kong (US$0.45 billion) and Netherlands (US$0.34 billion). These five main investing economies had accounted for 91% of the total net FDI in Malaysia. Apart from Singapore, other ASEAN countries with significant investment were Thailand (US$5.9 million) and Philippines (US$0.6 million).
With respect to economic sector, the Financial Intermediation was the main recipient for FDI. The sector had accounted for US$3.3 billion of FDI in 2006. This was followed by Manufacturing which accounted for US$1.2 billion, Mining & Quarrying (US$0.8 billion) and Trade & Commerce sector (US$0.7 billion). The four sectors had contributed to about 98% of the total net FDI in 2006.
Given the above scenario, the leading countries associated with direct investment in Financial Intermediation in 2006 were Japan (US$2.01 billion), European Union (US$0.34 billion), United States of America (US$0.29 billion) and Hong Kong S.A.R (US$0.23 billion). Within ASEAN, Singapore showed the biggest investment amounting to US$0.10 billion. For Manufacturing sector, the main direct investors according to country of origin were Japan (US$0.68 billion), European Union (US$0.65 billion), Singapore (US$0.27 billion) and United States of America (US$0.24 billion). While for Mining & Quarrying, United States of America was the largest contributor of FDI amounting to US$0.59 billion. This was followed by Japan, which posted of US$0.11 billion.
Foreign Direct Investment (FDI) flow into Malaysia during 1st quarter 2007 was
US$1.6 billion, an increase of 64.3% as compared with the same period of 2006 (US$1.0 billion). Reinvested Earnings remained the largest component amounting to US$1.1 billion (65.0%), followed by Equity and Loans, which accounted for US$286 million (17.6%) and US$284 million (17.4%) respectively.
Country Developments in FDI
economies was 83.8% of the total net FDI of Malaysia. Amongst ASEAN, the biggest FDI was from Singapore, which accounted US$81.6 million (Q1 2006: US$70.7 million). This was followed by Thailand, which posted of US$49.3 million (Q1 2006: US$3.8 million).
By economic sector, most FDI in Malaysia was directed to Manufacturing. The sector had accounted for 52.0% (US$846.9 million) of the total FDI in Q1 2007. This was followed by Trade/Commerce sector (26.5% or US$431.5 million), Financial Intermediation sector (16.8% or US$273.9 million) and Mining & Quarrying sector (7.8% or US$127.4 million).
During the quarter under review, FDI in manufacturing sector was mainly from European Union (EU), which accounted for US$1.2 billion. While for ASEAN, the biggest investment came from Thailand (US$3.4 million). Similar to Manufacturing sector, the largest investment for Trade/Commerce sector was from European Union, which posted of US$221.9 million. This was followed by United States of America with the value of investment of US$126.5 million. In the meantime, the largest investment in Financial Intermediation sector was from Singapore (US$84.9 million). This was followed by Japan (US$76.2 million) and United States of America (US$71.7 million).
Administrative Foreign Investments in 1st Half 2007
During the period January-June 2007, a total of 242 projects with foreign participation involving investments of US$4.2 billion were approved, as compared with US$5.5 billion in 571 projects for the whole year of 2006.
Foreign Investment by Industry
Foreign investments were mainly in the following industries:
- electrical and electronics US$2.2 billion - petroleum products including petrochemicals US$0.9 billion - chemicals &chemical products US$263.3 million - non-metallic mineral products US$253.1 million - machinery manufacturing US$108.2 million
Country Developments in FDI
Foreign Investment By Country
Major sources of foreign investments in the period January-June 2007 were:
Jan-June 2007 - Iran US$884.5 million - Japan US$765.4 million - Germany US$472.8 million - Netherlands US$414.9 million - Singapore US$412.9 million
Iran’s investments were mainly due to its participation in a joint-venture petroleum refinery project.
Japan was the second largest source of foreign investments during the period Jan-June 2007, with 31 projects approved involving investments of US$765.4 million. Approximately 70 per cent of Japanese investments were in the electrical and electronics industry, producing a range of products including ‘Integrated circuits & transistors and LCD television receivers.
Germany with investments mainly electrical and electronics products industry (US$ 246.2 million) emerged as the third largest source of foreign investments in the period Jan-June 2007. The Netherlands was the fourth largest source of foreign investments with US$414.9 million in 3 projects, including a project with investments of more than US$400 million to produce advanced memory integrated circuits. Singapore was the fifth largest source of foreign investments with US$412.9 million in 58 projects. Singapore’s investments were in a wide range of products, from food manufacturing to electrical and electronics.
Measures Announced or Introduced in 2006 to Attract Greater FDI Flows
Incentives Introduced Under the 2007 Budget
•
Enhancing tax incentives for biotechnology industry•
Enhancing incentives for the promotion of Malaysian Brand NameForeign Exchange Measures
•
Liberalisation of Foreign Exchange Administrative measures such as:o
Removal of the overdraft limit of RM200 million for foreign stockbroking firms;
o
Abolishing the limit on the number of residential or commercialsloans acquired by non-residents;
o
Allowing offshore banks to appoint overseas branches as a vehicleto facilitate the settlement of any Ringgit assets of their non-resident clients; and
o
Removing the restriction on Labuan Offshore Banks, to transact inCountry Developments in FDI
Other Measures
•
Establishment of a special task force (PEMUDAH) to facilitate businessin Malaysia. This task force will identify and propose appropriate measures to improve procedures, regulations and existing laws, as well as to cut red tapes in local governments to ensure their delivery system is business-friendly.
•
Application for duty exemption for services sector under MIDA.•
Relaxation of guidelines for the purchase of property by foreigninvestors, and the abolishment of real property gains tax, effective 1 April 2007.
•
Formation of the Cabinet Committee on Investment to facilitate speedierapprovals, provide customized incentives and monitor closely the implementation of high impact investment projects.
Launching of National Plans for Growth and Development
•
In the year 2006, the Third Industrial Master Plan (IMP3) and the NinthMalaysia Plan (RMK9) were launched. The IMP3 outlines strategies and policies for the 2006-2020 period to ensure that the manufacturing and related services sector continue on the path of growth and development while the Ninth Malaysia Plan details the measures and initiatives to be taken from 2006-2010. Included in both the IMP3 and RMK9 are measures to enhance national competitiveness through incentives for encouraging investments, trade facilitation, promote greater use of information and communication technology (ICT).
Myanmar FDI Flows (BOP Basis)
For the year 2005-2006, FDI flows US$ 235.85 million and 2006-2007 (first six months) flows US$ 142.96 million. BOP FDI flows are only equity basis.
Administrative Foreign Investment
In the year 2006, Myanmar Investment Commission had permitted 6 projects amounting to US$ 945.402 million. 4 in oil and gas sector and 2 in power sector. In the year 2007 (January to June) Myanmar Investment Commission had permitted 8 projects. One in livestock and fisheries and 6 in oil and gas sector. The leading sector is Thailand and the second is United Kingdom.
Philippines FDI Flows in 2006 and 1st Quarter 2007 (BOP Basis)
Country Developments in FDI
The higher level of FDIs in 2006 was shored up by the net inflows in the equity capital account and the other capital account. Equity capital investments, rising by 9.0 percent to US$1.287 billion, were channeled into manufacturing (such as chemical/healthcare/steel products, electronics, and air-conditioning system), electricity, gas and water, financial intermediation, real estate, mining, and construction industries.
The Other Capital account – which consists mainly of intercompany borrowing and lending transactions between foreign direct investors and their local subsidiaries, branches and affiliates – more than doubled from the previous year’s level to reach US$1.078 billion in 2006. Loans extended by head offices to Philippine subsidiaries or branches went mostly to the electronics and automotive firms. The major sources of FDI flows were the United States, the Netherlands, the United Kingdom, and Japan.
For the first quarter of 2007, non-residents’ direct investments grew by 18.5 percent to US$710 million relative to the level posted during the same quarter in 2006. This positive development reflected the country’s solid macroeconomic fundamentals. The increase in FDI net inflows during the first quarter resulted mainly from a more than twofold increase in net equity capital at US$682 million.
The bulk of these investments came from the U.S., Japan, Singapore, and Korea. Major recipient industries included manufacturing (electronics, health products), services (international courier, information technology development), mining, real estate, financial intermediation, agriculture and construction.
Reinvested earnings remained positive at US$8 million, albeit lower by about 53 percent than the year-ago level of US$17 million. Meanwhile, the other capital account, the bulk of which were loans granted by head offices to their subsidiaries in the Philippines, amounted to US$20 million, lower than the level last year as subsidiaries paid off some of their maturing loans.
Looking ahead, FDI inflows are expected to remain strong for the rest of 2007, given the string of positive first quarter developments (such as favorable corporate earnings, buoyant GDP growth of 6.9 percent, and stable prices). This should help promote an economic environment of continued non-inflationary growth.
Administrative Foreign Investment in 2006 and 1st Half 2007
The year 2006 saw a significant recovery of investor interest as shown by the surge in approvals of Foreign Direct Investments (FDIs) in the manufacturing sector to US$ 2.2 billion from the US$ 1.2 million worth of approvals in 2005. The significant 81.4 percent growth can be attributed to the heightened investor confidence due to improved macroeconomic conditions and upbeat expectations for 2006.
Country Developments in FDI
China and Japan, with shares at 14.7 percent, 14.3 percent, and 12.5 percent, respectively, of the total approved investments in manufacturing in 2006.
The robust turnout of pledges to the manufacturing sector in 2006 was boosted
by intentions to invest in the manufacture of other transport equipment valued at
US$ 984.9 million which comprised the lions share of 45.3 percent of total
pledged infusion to the manufacturing sector for the year. Manufacture of radio,
television and communication equipment and apparatus, valued at US$ 428.4 million comprised a significant 19.7 percent of the total pledges during the year.
Investment commitments to the manufacture of fabricated metal products,
except machinery and equipment likewise contributed a significant US$ 382.3 million in 2006.
In the first semester of 2007, total approved FDIs for the manufacturing sector was registered at US$ 860.5 million, a decrease of 47.0 percent from last year’s US$ 1.6 billion in the comparable period.
The U.S.A was top source of investment pledges with US$ 437.4 million or 50.8 percent of projects approved during the period. Japan followed at US$ 106.2 million.
The bulk of the pledges in the first half of 2007 were intended for the
manufacture of radio, television, and communications equipment at US$ 527.1
million which comprised 61.3 percent of investments commitments to the sector
in the first half of 2007. Pledges in the manufacture of motor vehicles, trailers
and semi-trailers were tallied at US$ 527.1 million in the semester.
Investment Outlook for 2007
The investment outlook remains positive with investment priority plans firmly established, rigorous promotion and specific systems reforms undertaken. To wit:
2006 Investments Priority Plan (IPP)
Country Developments in FDI
2007 Investments Priority Plan (IPP)
The 2007 IPP shall continuously support the Philippine vision of ‘Propelling the
Nation to 1st World Country Status in 20 Years”. It shall remain in representing
the development thrust of the government for sustained and equitable economic growth as espoused in the 10-point agenda of the Arroyo government. This year’s IPP has the following list of priority areas: (1) preferred activities covering 11 investment areas recommended by the private sector, (2) export activities covering the manufacture of non-traditional products (3) projects under the Retention, Expansion, and Diversification (R.E.D.) Program.The IPP was prepared by the BOI in cooperation with concerned government agencies. The 2007 IPP will continue to utilize the Industry Cluster approach to enhance industrial competitiveness, promote investments in the countryside, develop micro and small and medium enterprises (MSMEs) and support the One Town, One Product (OTOP) Program as it applies to the activities listed in the IPP. The modernization of existing activities as well as the establishment and operation of Centers of Excellence and Training Institutions to support the human resources requirements of the preferred activities are also encouraged.
Investment Promotion
Outbound and inbound missions to India, Japan, China, Taiwan, and the U.S. were organized to boost investments in the country, from both local and foreign sources. To further strengthen the country’s bid as the preferred outsourcing destination, the BOI organized its first investment promotion mission to the United States on 12-23 June 2006. The investment mission aims to achieve the following: 1) sustain the promotion of the country’s IT and IT-enabled services and enhance country brand image; 2) expand the Department’s support network in promoting investment opportunities in the Philippines; and 3) establish new linkages and partnerships with relevant U.S. organizations for image building and investment generation. The investment mission in US obtained positive results, i.e., nine new investment leads, six companies with confirmed investment prospects, and seven companies expressed investment interests. Assistance was also extended during the Presidential visits in China, Kingdom of Saudi Arabia (KSA), Spain and Italy.
To spur investments in the countryside, eight domestic roadshows, i.e., Davao City, Isabela, Cagayan de Oro, Baguio City, Cagayan North, Caraga (Butuan City), Region 9 (Zamboanga City), and Region 6 (Iloilo City and Kalibo) were conducted. As a result, some 84 investment leads were generated with a prospective investment of Php 74.14 billion.
Five Capability Building Training on Investments Promotion were conducted to enhance the capabilities of the LGUs to promote their areas as investment destinations. The trainings were conducted for LGU executives, line-agency and private sector representatives of Rizal Province, CAR, Legazpi City, Ilocos Sur, and Marikina City.
Infrastructure
Country Developments in FDI
of doing business.
DTI, through the Build-Operate-Transfer (BOT) Center, the National Development Company (NDC), and the NDC-Philippine Infrastructure Corporation (PIC), continued to address investor concerns pertaining to the limited infrastructure facilities in the country. Their accomplishments include the following key infrastructure projects involving five toll roads and one airport project, which are considered to be priority projects and consistent with the President’s 10-point agenda.
South Luzon Expressway (SLEX)
The South Luzon Expressway is reaching its maximum capacity. As such,
PNCC is working double time to start the expansion and rehabilitation works in SLEX. Some advance work was done along San Pedro, Laguna. This project would have a significant impact on the socio-economic growth in the CALABARZON by facilitating the efficient movement of basic commodities and services between Metro Manila and the region. PIC and NDC have assisted PNCC in fast tracking the implementation of the project.
CALA North-South Expressway
To decongest Southern Metro Manila and Cavite and serve industries in the CALABARZON Region, PIC, in partnership with DPWH, is developing the CALA North-South Expressway. The project will ease the traffic congestion along the Aguinaldo intersection and improve access to the industrial estates in Cavite.
Amendment to EO 226 (Omnibus Investments Code of 1987)
E.O. 226 aims to adopt an incentive system that is consolidated, highly focused, cost-effective, time-bound and simple to administer; harmonizes the government’s administration of programs and policies on the grant of fiscal and non-fiscal incentive.
Recent developments indicate that the government is reviving plans to create a separate body that would take over the regulatory functions of the Board of Investments so it could be transformed into a purely national investment promotions agency. This will be the framework to serve as basis for the draft bill to be filed in Congress.
Amendment to RA 7718 – The BOT Law
With the filing of HB 5002 (Amending RA 7718, the BOT Law), the DTI Technical Working Group (TWG) on the BOT Law Amendment reviewed and prepared comments on the Bill, which seeks to establish a clear policy framework for private sector participation in government infrastructure and development projects enhancing their attractiveness to private investors but at the same time, ensure protection of government interests.
Country Developments in FDI
This translates to about 78% reduced processing time.
On Cement and Copper Export Clearances. The Board of Investments (BOI) has reduced the processing time of the following services as well as issuance of clearances and certificates:
- Cement Export Clearance (from 5 days to 4 days);
- Copper Export Clearance (from 10 days to 9 days);
- Certificate of Qualification to Import Tax and Duty Free Spare Parts and
Supplies (from 10 days to 4 days)
- Certifications/Endorsements for Not Locally Available (NLA) (from 5 days to
2 days);
- Certificate of Accreditation (CA) (from 5 days to 1 day);
- Request for Modification of Terms and Conditions of BOI Registration as
well as Request for Cancellation of BOI Registration (from 15 days to 11 days)
Fees are also waived for the application of Cement and Copper Export Clearances. A help-desk or information counter was put up to accommodate queries and complaints. Overall, DTI agencies providing frontline services have adopted the “No Noon Break Policy” in order to provide uninterrupted service. DTI agencies have also displayed signages indicating their procedures, requirements and fees as well as placed client satisfaction feedback boxes within the business areas. Worthy of note is the Department’s continued efforts to review and enhance transaction flows within the Department pursuant to its goal to provide superior public service.
Temporary Visitors’ Visa (TVV) –‘Visa on Arrival’.
The Board of Investments and the Bureau of Immigration signed a Memorandum of Agreement (MOA) aimed at reducing to three days from 10 days, the visa application process for foreign businessmen faster and easier by offering “visa on arrival”. The TVV would be valid for 30 days and maybe renewed before it expires. There would be special lanes in both immigration arrival and departure areas for the processing of the TVV.
Singapore FDI Flows in 2006 (BOP Basis)
Singapore recorded strong foreign direct investment (FDI) inflows in 2006, as macroeconomic growth remained robust and global economic conditions continued to improve.
Inward FDI rose to US$24 billion in 2006, up from US$15 billion in the preceding year, with the majority going into financial, commerce and manufacturing related industries.
Sources of Foreign Direct Investment
Country Developments in FDI
2005 to US$1.2 billion.
While FDI from Asia has grown substantially to account for 26 percent of total FDI inflows, Europe remained the largest source of regional FDI, contributing to almost half of total inward FDI.
Investment Commitments in 1st Half 2007
Manufacturing investment commitments in fixed assets in the first half 2007 totalled S$5.2 billion. These projects are expected to generate value-added of S$1.7 billion and more than 8,000 jobs when fully implemented.
Foreign investors accounted for 94 per cent (S$4.8 billion) of total commitments. Europe was the biggest contributor, accounting for 41 per cent of the total or S$2 billion. This was followed by investors in the US and Japan, which contributed S$1.8 billion and S$0.6 billion respectively.
The electronics cluster attracted strong foreign interest, garnering S$2.6 billion in investment commitments in the first half. This was followed by the chemicals and biomedical manufacturing clusters, which pulled in S$1.7 billion and S$0.3 billion respectively.
Thailand FDI Flows in 2006 and 1st Quarter 2007 (BOP Basis)
BOP-FDI for the year 2006 recorded a net flow of US$10.8 billion, compared to US$9.0 billion last year. Despite an increase in net BOP-FDI, the growth rate tended to slow down compared to those of previous years. This coincided with the declining trend of the overall private investment and business sentiment index, the reasons behind which were said to encompass factors such as vague political phenomena and policy direction, etc.
The surplus was largely attributed to an increase in equity investment, especially in holding business. Other major contributors scattered across real estate business, manufacturing sector (especially transport equipment industry and electrical appliances industry) as well as banking sector. Repatriation was mostly observed in mining and holding businesses. Despite the overwhelming size of gross flow of short-term loans, long-term loans tended to contribute more in net term and mainly went to sectors such as retail & wholesale, manufacturing and financial institution.
Within non-bank sector itself, foreign investors mostly concentrated in manufacturing sector (44.6%) - especially in transport equipment industry (12.3%), holding companies (16.6%), real estate (15.8%), and retail & wholesale (15.6%). Mining was the only sector which registered net outflow of investment. Major investors were the Japan (29.8%), Singapore (25.4.0%), and the United States (7.8%). Most investors invested in the form of equity, while Singaporean investors mostly invested in the form of loans from affiliates.
Country Developments in FDI
investment, especially in banking sector, non-bank financial institutions, transportation industry, and electrical appliance industry. Major investors were the United states (28%) followed by Japan (26%), and Singapore (21%).
Improvement of Thailand’s Compilation of FDI Statistics as Part of BOP
Starting 2007, the BOT has decided to change the IIP data source from survey to direct reporting (Sor Bor Chor 3/1 Form), with collaboration of the Department of Business Development. (DBD), Ministry of Commerce. The data to be obtained through this direct reporting comprise balance sheets filed by all companies with foreign equity liability of one percent and above. This new source would allow the BOT to obtain year-end outstanding amount of major financial account components, including FDI.
For quarter-end data, the BOT also plan to run voluntary survey using this same report form. This would allow us to compile quarterly IIP for major financial account components.
Administrative Foreign Investment in 1st Half 2007
In 1st half 2007 approved manufacturing investment with foreign interest
depicted a downward trend, in terms of number of projects. The total number of approved projects was 263 projects. Whereas the total value of projects increased by 10 percent to approximately 95.7 billion baht (US$ 2.9 billion*) at
the same period of time in 2006.1 The largest source foreign direct investment
was Japan (49.5 billion baht or US$ 1.5 billion), followed by US (21.45 billion baht or US$ 0.65 billion), EU (79.2 billion baht or US$ 0.24 billion), Taiwan (3.6 billion baht or US$ 0.11 billion), and Singapore (2.6 billion baht or US$ 0.08 billion) respectively.
In terms of industry, classified by 2-digit level of ISIC code, the manufacture of radio, television and communication equipment was the largest recipient of foreign direct investment in 1 half 2007, accounting for approximately 36.3 billion baht (US$ 1.1 billion), or 39 percent share of total investment. The second largest was the manufacture of fabricated metal products except machinery and equipment 14.19 billion baht (US$ 0.43 billion) or 15 percent of total investment, followed by machinery and equipment n.e.c. (11 percent), motor vehicles, trailers and semi-trailers (8 percent) and chemicals and chemical products (8 percent) .
Policy Development
Thailand Board of Investment offers new measures and incentives to stimulate investment as follows:
1. Biotech Industry
The Board of Investment has introduced incentives to support the biotechnology industry by providing a maximized incentive package comprised of an eight-year corporate income tax exemption and an additional 50 per cent corporate income tax break for five years should the applicants’ facilities be located in the science and technology parks.
1
Country Developments in FDI
2. Logistic
BOI makes a move to gear up the logistics business by supporting set-up of “Logistics Parks” to facilitate trade and exports and ensure Thailand’s global competitiveness
3. Eco-cars
To promote motor vehicles which save fuel and have reduced impact on the environment, the BOI agreed to grant privileges for investment projects which will manufacture eco-cars that meet international standards and specified BOI conditions.
Proposals for investment promotion should be for integrated projects that include car assembly, engine manufacturing and the manufacture of key parts with a minimum investment of THB 5 billion. The privileges include exemptions from import duties on machinery and equipment and an 8-year corporate income tax waiver, regardless of the investment’s location. Eligible investment projects should meet a series of international standards.
Viet Nam FDI Flows in 2006 and 1st Half 2007 (BOP Basis)
FDI flows in Viet Nam in 2006 was recorded at US$ 2360 million, increased by 18% percent from that of US$ 1994.41 million in 2005. In term of source of FDI flows, Japan, USA, Europe, ANIEs and ASEAN have still played an important role, accounting for the lion’s share of 84 percent in 2006.
In term of economic sector: Manufacturing is most attractive to FDI with US$ 1510.64 million inflows, accounting for 62,94 percent, then Real Estate US$ 537.78 million (22,41 percent); construction US$ 126.12 million (5,25 percent) agriculture, fishery and forestry US$ 52.39 million (2,18 percent); whereas only 1,92 percent in other with US$ 46.22 million investment.
Factors affecting such trends and developments
The reason for the increase of FDI flows in Viet Nam in 2006 was due to the fact that more projects have been licensed and Viet Nam has improved incessantly its investment and business environment in odder to and create more favorable conditions for investors. Viet Nam became a WTO member by the end of 2006.
National measures and policy changes introduced or announced in 2006 and the first half of 2007
Within our assigned function, the State Bank of Viet Nam is undertaking our commitment of creating a legal framework that facilitates FDI activities in Viet Nam, the policy on foreign exchange management has been revised
remarkably. Decree number 160/2006/N§-CP date 28th 12 year 2006 defines
key changes, such as:
-Liberalizing current account transactions.