UAV AERIAL SURVEY: ACCURACY ESTIMATION FOR AUTOMATICALLY
GENERATED DENSE DIGITAL SURFACE MODEL AND ORTHOTHOTO PLAN
M.A. Altyntsev a, *, S.A. Arbuzov b, R.A. Popov c, G.V. Tsoi d, M.O. Gromov e
a
Dep. of Engineering Geodesy and Mine Surveying,Siberian State University of Geosystems and Technologies, Novosibirsk, Russian Federation – [email protected]
b
Dep. of Physical Geodesy and Remote Sensing, Siberian State University of Geosystems and Technologies, Novosibirsk, Russian Federation – [email protected]
c
Siberian State University of Geosystems and Technologies, Advanced Science Research Center, Novosibirsk, Russian Federation – [email protected]
d
CEO of LLC “Unmanned Technologies” company, Novosibirsk, Russian Federation – [email protected] e
Assistant Chief Engineer for Innovative Technologies of CJSC “NPF “GEO”, Omsk, Russian Federation – [email protected]
Special Sessions, SpS 8
KEY WORDS: Aerial photography, Mobile laser scanning, Unmanned aerial vehicles (UAVs), Accuracy estimation, Digital surface model
ABSTRACT:
A dense digital surface model is one of the products generated by using UAV aerial survey data. Today more and more specialized software are supplied with modules for generating such kind of models. The procedure for dense digital model generation can b e completely or partly automated. Due to the lack of reliable criterion of accuracy estimation it is rather complicated to judge the generation validity of such models. One of such criterion can be mobile laser scanning data as a source for the detailed accu racy estimation of the dense digital surface model generation. These data may be also used to estimate the accuracy of digital orthophoto plans created by using UAV aerial survey data. The results of accuracy estimation for both kinds of products are presented in the paper.
*
Corresponding author
1. INTRODUCTION
UAV is a new trend in aerial photography. Over the last years the application of UAVs has increased dramatically. The accuracy of UAV aerial survey data usually complies with the accuracy of data obtained from traditional aerial photography having similar survey parameters. Thus, we can state with assurance that today there are not so many limitations for large scale topographical mapping using UAV. The majority of these limitations can be overcome applying special surveying techniques and data processing algorithms. Advanced software tools allow processing any aerial survey data automatically. It became possible owing to the appearance of techniques for the effective automated retrieval and identification. A DSM and an orthophoto plan are the results of data processing using these techniques.
A digital surface model (DSM) is considered as a representation of surface topography to be used for spatial modelling and analysis. The DSM is usually represented in the form of a three-dimensional surface. The quality of this model depends on many factors and parameters, such as the initial images quality, the availability of principal points and coordinates of vertical and horizontal control survey network points, flight altitude, overlaps and camera resolution. The final DSM accuracy is influenced by the variations of these factors and parameters (Ruiz et al., 2013).
Most of UAVs generate their DSMs from pairs of non-metric UAV images. As soon as a set of images is oriented and camera calibration and exterior orientation parameters are known, a digital scene can be reconstructed by automated image matching techniques. Owing to modern algorithms, it became possible to use aerial survey data for automatic generation of a dense digital surface model, which is similar to a point cloud obtained by laser scanning method. It means that a number of points in DSM, when using UAV, can be the same as the one obtained from laser scanner data. The cost of UAV-based DSM production is much cheaper than that of based on laser scanning data. The technique for UAV-based DSM production is not so time-consuming as well. Nevertheless, the extent of area covered by UAVs depends on the aircraft autonomy (Dayamit et al., 2015).
In general the DSM obtained from laser scanner data has a number of significant advantages regarding the data accuracy and their resolution which depend on the type of laser scanning. Terrestrial and mobile laser scanning (TLS, MLS) have a better accuracy compared with airborne laser scanning and provide a very dense point cloud. The order of TLS data accuracy is about of some millimeters, whereas the order of MLS data accuracy is about of some centimeters. TLS data are collected by means of scanning from different scanner positions. Scanning is usually recommended to carry out from several positions in order to get point clouds without shadows and occlusions. Though, because of the fact that some areas are inaccessible for scanning, it is not The International Archives of the Photogrammetry, Remote Sensing and Spatial Information Sciences, Volume XLI-B6, 2016
always possible. For example, in urban area the roofs may be inaccessible (Leslar, 2015). MLS data are collected by means of scanning when moving a vehicle with the scanner mounted on its roof. MLS system combines laser scanners, cameras and position and orientation units on a mobile platform. Due to numerous systematic and random errors of position and orientation units, the MLS accuracy is lower than the accuracy provided by the TLS (Gao et al., 2015). On one hand, the number of shadows and occlusions in a point cloud obtained by MLS is more than that of obtained by TLS, on the other hand, the data acquisition rate, by means of MLS, is much higher. The MLS system was developed for collecting point clouds from a street view. Therefore, the MLS, in comparison with TLS, is more suitable for DSM generation and 3D model reconstruction when applied for extended areas and linear objects such as roads.
If compare the MLS-based DSM with the UAV-based DSM, we may confirm that the first one is free of errors in reconstruction of vertical objects such as building walls. An example of DSMs is presented in Figure 1.
Figure 1. DSMs (Green: from MLS, Red: from UAV)
For the purpose of DSM generation and 3D model reconstruction the best solution is the integration of the MLS and UAV data to provide the detailed and complete information about the area. Information about walls and roofs, taken from MLS and UAV surveys respectively, can be combined to get complete building models. Nowadays, many techniques and methods were developed for the integration of laser scanning and UAV data. For example, the integration of MLS and UAV data is described by Zhu et al. (2015), the integration of ALS and UAV data – by Rhee and Kim (2015).
The UAV data can be used for large-scale topographic mapping and it depends on the UAV type, software for UAV data processing and the factors which were considered when discussing the DSM quality. Using only UAV-based DSM for large-scale topographic mapping is not appropriate because of some difficulties in identification of horizontal position of walls and other vertical objects (Fig. 1). The orthophoto plan created by UAV images should be used instead of DSM in determining the horizontal position of objects, and UAV-based DSM – for determining the vertical position of objects. There is a clear possibility that point clouds from UAV and MLS can be classified. Classified ground points should be used for generating digital elevation models (DEMs). In order to rely on the required quality of created DSM, DEM and orthophoto plan, it is necessary to carry out the analysis of measuring accuracy of these models and horizontal coordinates of points. The traditional approach to this problem-solving includes measuring the coordinates of control and check points (Leslar, 2015). For the reliable accuracy estimation it is necessary to measure as many as possible coordinates of these points, which are usually
measured by the traditional surveying equipment such as total stations, levels or GPS-receivers.
Instead of measuring coordinates of control and check points by the traditional surveying equipment TLS data can be applied as a source of these points owing to very high accuracy of a point cloud obtained by TLS. The accuracy of TLS data is always higher than the accuracy of UAV data (Naumann et al., 2013). Additionally, the ground sampling distance (GSD) of any UAV images is more than a distance between the nearest laser points in the cloud obtained by TLS. The GSD depends on the camera characteristics and a flight height. Here we should also concern the MLS data accuracy. Due to the systematic and random errors in MLS data it is necessary to estimate the accuracy of MLS point cloud by means of measuring coordinates of control and check points using traditional surveying equipment. All types of UAV have their own spatial characteristics. These characteristics and the GSD should be taken into account when estimating the accuracy by MLS data (Kung, 2011).
Thus, the reliability of MLS data application as a source of detailed accuracy estimation for generating DSM, DEM and orthophoto plan should be investigated for every type of UAV and the GSD as well.
2. BACKGROUND
The research was done on the basis of data provided by LLC “Unmanned Technologies” company, Novosibirsk. Aerial survey was carried out by UAV Supercam S250 near Novosibirsk city at flight heights of 150, 200 and 250 m in 2 strips in forward and backward directions and covered 2 villages and a highway located between them. The length of the surveying area was 4800 m and height difference was 20 m. Forward and lateral overlaps were 80%, and 60% correspondently. UAV Supercam S250 was equipped with a dual-frequency receiver, a camera Sony Alpha ILCE-6000 with a sensor of 24 megapixels, lens with focal length of 20 mm. ISO 800 and exposure 1/1000 were adjusted.
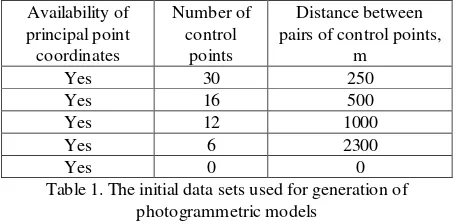
For each of three flights five photogrammetric models with different sets of initial data using for horizontal and vertical tie-in were generated. Table 1 illustrates the sets of such data.
Availability of
Table 1. The initial data sets used for generation of photogrammetric models
Thereby, 15 basic photogrammetric models were generated. Tie-point coordinates of all models were compared with each other. According to the results of comparative analysis for different models the following preliminary conclusions have been done:
1. For surveys at a scale of 1:500 and smaller, contour interval of 1 and 0.5 m, the optimal flight height is 200 m. 2. Horizontal positional accuracy of photo plan check points is within 5-15 cm that corresponds to the accuracy of plan at a scale of 1:500.
3. Vertical positional accuracy of DEM check points obtained by principal point coordinates and 6 control points located at a distance of 2300 m is within 10-15 cm that corresponds to the contour interval of 0.5 m for flat terrain. 4. Vertical positional accuracy of DEM check points obtained by principal point coordinates and 6 control points located at a distance of 4600 m is within 8-20 cm that corresponds to the contour interval of 1 m for flat terrain.
All photogrammetric models were generated by using Agisoft Photoscan. Based on the results of UAV survey at a flight height of 200 m and 16 control points, the orthophoto plan was created and a dense DSM was generated in the form of a point cloud. UAV images obtained from the height of 200 m had footprint of 5 cm. Primarily, the orthophoto plan and the point cloud were generated in UTM-44N projection of WGS-84 coordinate system, and then transformed into the local coordinate system MSK-54, zone 4.
Photogrammetric models, a dense DSM and an orthophoto plan provided by LLC “Unmanned Technologies” company were used for the analysis. For detailed accuracy estimation of a dense DSM the Siberian State University of Geosystems and Technologies (SSUGT) and the Novosibirsk City Administration have carried out MLS surveying with the vehicle’s average speed of 40 km/h. MLS system Riegl VMX-250 was applied. Owing to stated specifications the system provided the absolute measuring accuracy for ground point coordinates within 5 cm. Laser scanning was carried out along the area both in forward and backward directions.
Thereafter, MLS data were calibrated, adjusted, and transformed into the local coordinate system by the Regional Centre for Laser Scanning at the SSUGT. The results of the relative accuracy estimation of control point adjustment are given in Table 2, whereas using check points - in Table 3. Totally, 26 control points and 10 check points were used. Determination of these point positions as well as measuring their coordinates were carried out by MLS data. Only control point coordinates were applied in the adjustment. Check point coordinates served as the criterion of accuracy estimation.
X, m Y, m Z, m
Mean error 0.002 0.002 0.002
RMS error 0.006 0.007 0.003
Maximum error 0.037 0.041 0.028
Table 2. Relative accuracy estimation of MLS data adjustment using control points
X, m Y, m Z, m
Mean error 0.012 0.010 0.003
RMS error 0.015 0.013 0.005
Maximum error 0.033 0.037 0.011
Table 3. Relative accuracy estimation of MLS data adjustment using check points
For absolute accuracy estimation of MLS data adjustment the coordinates of 7 check points, placed on curbs and road marking corners, were measured on the analyzing area with GPS-receivers Trimble 5700 in static mode. The results of absolute accuracy estimation of MLS data adjustment using check point coordinates measured with GPS-receivers are given in Table 4.
X, м Y, м Z, м
Mean error 0.009 0.030 0.029
RMS error 0.021 0.053 0.034
Maximum error 0.044 0.131 0.051
Table 4. Absolute accuracy estimation of MLS data adjustment using check points
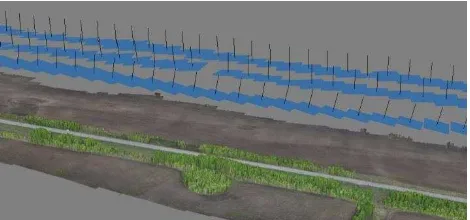
According to (Manual for photogrammetric works, 2002): “Survey network points used for the photogrammetric bridging should have mean errors in plane less than 0.1 mm at plotting map (plan) scale and 0.1 of the accepted contour interval for the height (as regard to the nearest points of the national geodetic network and extended geodetic networks)”. Therefore, obtained MLS data can be used both as horizontal and vertical control and as a source of check points. Orthophoto plan with MLS trajectory is shown in Figure 2 and a fragment of dense DSM with visualization of principal point positions while surveying is shown in Figure 3.
Figure 2. Orthophoto plan with MLS trajectory
For analysis of horizontal positional accuracy of orthophoto plan’s points, we used the points located on buildings and city infrastructure objects. Orthophoto plan was generated using DSM. Point coordinates were measured on the orthophoto plan and point cloud obtained from MLS data. One of such points is shown in red in Figure 4.
Figure 3. A fragment of a dense DSM with visualization of principal point positions while surveying
Figure 4. Distribution of points on the orthophoto plan for horizontal positional accuracy estimation (Left: orthophoto plan,
Right: MLS data)
Estimation of horizontal position accuracy of orthophoto plan points is given in Table 5. RMS error of check points along the X-axis was 0.068 m, and along the Y-axis was 0.095 m that The International Archives of the Photogrammetry, Remote Sensing and Spatial Information Sciences, Volume XLI-B6, 2016
corresponds to the requirements for creation of plans at scale
Table 5. Positional accuracy estimation of orthophoto plan points
Vertical positional accuracy estimation of dense DSM points was also carried out using MLS data. The visual analysis revealed that DSM sites adjacent to the filtered objects as well as fences slightly distort the model, especially on the built-up areas. It was decided to measure the heights on road cross- sections. The choice of check points on a road surface is caused by the highest accuracy of both point clouds from MLS and the one from UAV for roads. This statement is confirmed by statistics presented in Table 6. A set of statistical data is calculated for cross-sections with a depth of 1 m. Cross-sections for the road surface are shown in Figure 5, whereas for the grass in Figure 6. The road surface has the lowest standard deviation that is comparable with both the accuracy of measuring MLS system and the accuracy of algorithms for generating point clouds by UAV data. The mean heights for the road surface cross-sections are very close between each other for the UAV and MLS point clouds. The ones for the cross-sections of the grass are different.
Type of area Min, m Max, m Mean, Grass, MLS 125.587 127.028 125.968 0.28 Road, UAV 127.58 127.7 127.641 0.027 Grass, UAV 125.26 125.44 125.33 0.044 Table 6. The statistics for heights of laser points that represent 2
object classes
Figure 5. Cross-section for the same part of the road (Left: MLS, Right: UAV)
Figure 6. Cross-section for the same part of the grass (Left: MLS, Right: UAV)
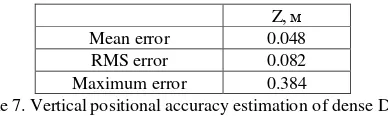
Cross-sections were constructed every 100 m and coordinates of 3 points were measured on each cross section. The results of vertical positional accuracy estimation of dense DSM points are given in Table 7.
Z, м
Mean error 0.048
RMS error 0.082
Maximum error 0.384
Table 7. Vertical positional accuracy estimation of dense DSM points
Taking into account the results of accuracy estimation, it may be concluded that the model has the accuracy sufficient for generating contours with the interval of 50 cm. This is satisfactory for plans at a scale of 1:500.
3. CONCLUSION
In the work it was revealed that UAV aerial survey data can be used for large-scale topographic mapping. The UAV type and GSD depending on a flight height and a mounted camera influence on the DSM accuracy and orthophoto plan generation. Detailed accuracy estimation of a DSM and orthophoto plan generation by UAV aerial survey data was carried out for UAV Supercam S250. It was shown that MLS data can be used as a source of control and check points for this type of UAV, when surveying at heights up to 200 m. MLS data from Riegl VMX-250 system were used for accuracy estimation. The results of analysis have shown that the accuracy of dense DSM and orthophoto plan generation using UAV Supercam aerial survey data meets requirements for creating a plan at a scale of 1:500.
REFERENCES
Dayamit, O.M., Pedro, M.F., Emesto, R.R. and Fernando, B.L., 2015. Digital Elevation Model from Non-metric Camera in UAS Compared with LIDAR Technology. In: The International Archives of the Photogrammetry, Remote Sensing and Spatial Information Sciences, Toronto, Canada, Vol. XL-1/W4, International Conference on Unmanned Aerial Vehicles in Geomatics, pp. 411-414.
Gao, Y., Huang, X., Zhang, F. and Yang, C., 2015. Automatic Geo-referencing Mobile Laser Scanning Data to UAV images. In: The International Archives of the Photogrammetry, Remote Sensing and Spatial Information Sciences, Toronto, Canada, Vol. XL-1/W4, International Conference on Unmanned Aerial Vehicles in Geomatics, pp. 41-46.
Kung, O., Strecha, C., Beyeler, A., Zufferey, J-C., Floreano, D. Fua, P. and Gervaix, F., 2011. The Accuracy of Automatic Photogrammetric Techniques on Ultra-light UAV imagery. In: The International Archives of the Photogrammetry, Remote Sensing and Spatial Information Sciences, Zurich, Switzerland, Vol. XXXVIII-1/C22, ISPRS Zurich 2011 Workshop, pp. 125-130.
Leslar, M., 2015. Integrating Terrestrial LIDAR with Point Clouds Created from Unmanned Aerial Vehicle imagery. In: The International Archives of the Photogrammetry, Remote Sensing and Spatial Information Sciences, Toronto, Canada, Vol. XL-1/W4, International Conference on Unmanned Aerial Vehicles in Geomatics, pp. 97-101.
Manual for photogrammetric works in creating digital topographic maps and plans, 2002, Moscow, TSNIIGAiK (Russian version).
Naumann, M., Geist, M., Bill, R., Niemeyer, F. and Grenzdörfer, G., 2013. Accuracy Comparison of Digital Surface Models Created By Unmanned Aerial Systems imagery and Terrestrial Laser Scanner. In: The International Archives of the Photogrammetry, Remote Sensing and Spatial Information Sciences, Rostock, Germany, Vol. XL-1/W2, UAV-g2013, pp. 281-286.
Rhee, S. and Kim, T., 2015. Automated DSM extraction from UAV images and Performance Analysis In: The International Archives of the Photogrammetry, Remote Sensing and Spatial Information Sciences, Toronto, Canada, Vol. XL-1/W4, International Conference on Unmanned Aerial Vehicles in Geomatics, pp. 351-354.
Ruiz, J.J., Diaz-Mas, L., Perez, F. and Viguria, A., 2013. Evaluating the Accuracy of DEM Generation Algorithms from UAV imagery. In: The International Archives of the Photogrammetry, Remote Sensing and Spatial Information Sciences, Rostock, Germany, Vol. XL-1/W2, UAV-g2013, pp. 333-337.
Zhu, L, Jaakkola, A. and Hyyppä, J., 2013. The Use of Mobile Laser scanning Data and Unmanned Aerial Vehicle images for 3d Model Reconstruction. In: The International Archives of the Photogrammetry, Remote Sensing and Spatial Information Sciences, Rostock, Germany, Vol. XL-1/W2, UAV-g2013, pp. 419-423.