USING AIRBORNE REMOTE SENSING TO INCREASE SITUATIONAL AWARENESS
IN CIVIL PROTECTION AND HUMANITARIAN RELIEF – THE IMPORTANCE OF
USER INVOLVEMENT
H. Römer a, R. Kiefl a, F. Henkel a, C. Wenxi a, R. Nippold b, F. Kurz c, U. Kippnich d a
German Aerospace Center (DLR), Remote Sensing Data Center, 82234 Wessling, Germany – [email protected] b
German Aerospace Center (DLR), Remote Sensing Technology Institute, 82234 Wessling, Germany c
German Aerospace Center (DLR), Institute of Transportation Systems, 12489 Berlin, Germany d
Bavarian Red Cross (BRC), Bad Kissingen, Germany
Commission VI, WG VI/4
KEY WORDS: Airborne, remote sensing, emergency response, real-time, civil protection, situational awareness, web service
ABSTRACT:
Enhancing situational awareness in real-time (RT) civil protection and emergency response scenarios requires the development of comprehensive monitoring concepts combining classical remote sensing disciplines with geospatial information science. In the VABENE++ project of the German Aerospace Center (DLR) monitoring tools are being developed by which innovative data acquisition approaches are combined with information extraction as well as the generation and dissemination of information products to a specific user. DLR’s 3K and 4k camera system which allow for a RT acquisition and pre-processing of high resolution aerial imagery are applied in two application examples conducted with end users: a civil protection exercise with humanitarian relief organisations and a large open-air music festival in cooperation with a festival organising company. This study discusses how airborne remote sensing can significantly contribute to both, situational assessment and awareness, focussing on the downstream processes required for extracting information from imagery and for visualising and disseminating imagery in combination with other geospatial information. Valuable user feedback and impetus for further developments has been obtained from both applications, referring to innovations in thematic image analysis (supporting festival site management) and product dissemination (editable web services). Thus, this study emphasises the important role of user involvement in application-related research, i.e. by aligning it closer to user’s requirements.
1. INTRODUCTION
Situational awareness is a critical aspect of the decision making process in emergency response and civil protection and requires the availability of up-to-date information on the current situation, e.g. on traffic infrastructure or on current location and availability of security and medical staff (Westlund, 2012). Remote sensing related research in this field should not only encompass developing innovative single solutions for (real-time) data collection, but also on the aspect of transforming data into information so that the latter can be considered as a basis for action and decision making. This aim covers also issues of visualisation and dissemination of information acquired from different sources, taking the specific technological, organisational and environmental settings of an end user into account (DHS, 2014; NRC, 2003). In the VABENE++ project (Traffic Management for Large Scale Events and Disasters) of the German Aerospace Center (DLR), tools are being developed to provide time-critical information on the state of infrastructure and traffic derived from several data sources such as satellites, aerial imagery and terrestrial in-situ-sensors (Kurz et al., 2011). An innovative element of this project can be seen in the provision of a real-time (RT), end-to-end monitoring capacity ranging from the acquisition of different raw data (e.g., aerial imagery) towards the creation and dissemination of information products to a specific user. Aiming the development of tools to be successfully used and implemented by end user organisations in the future, important components in VABENE++ are field exercises in collaboration with end users (Kujala, 2003).
In this study new developments for information extraction, visualisation and dissemination based on airborne remote sensing are presented, which have been demonstrated during two application examples in 2015 in cooperation with two different end user groups. These scenarios include a civil protection exercise together with humanitarian relief organisations, and an open-air festival in cooperation with a traffic logistic company and the festival organiser. Special attention is paid on the role of user interaction and feedback in promoting further developments of methodologies and solutions for airborne information extraction, visualisation and situational assessments.
1.1 VABENE++ objectives and monitoring concept
The primary goal of VABENE++ and its predecessors is to contribute to an efficient management of required rescue logistics and the nearby traffic flow particularly under extreme conditions including large scale public events and natural disasters. Now, there have been developed several tools and applications dealing with traffic monitoring and modelling and rescue logistics, but also on general situational assessments including issues of information visualisation and dissemination (Kurz et al., 2011; Römer et al., 2014). Applications are based on input data from various sources including space and airborne monitoring platforms (i.e., Micro Aerial Vehicles, manned aircrafts and optical satellites) and ground based instruments for traffic data collection (Angermann et al., 2012; Kurz et al., 2011).
Figure 1 shows a simplified workflow of pre-operational components that are implemented in an end-to-end RT monitoring system of VABENE++. These components can be applied as whole or as single parts depending on the underlying application scenario. Airborne data collection is carried out using either the 3K camera system licensed for the DLR airplanes Cessna and Dornier Do228, and since 2014, the 4k-camera system on DLR’s research helicopter BO 105. In both cases the camera systems consist of three non-metric off-the-shelf cameras, high performance processing units for RT image processing and extraction of road traffic, as well as a precise GPS/IMU navigation system for direct (on-board) image orthorectification and georeferencing. Pre-processed image data and extracted traffic information can be transmitted to a mobile ground station using a commercial auto tracking microwave C-Band downlink with data transfer rates of 11 Mbit/s (Kurz et al., 2011, 2014). Ground based information is provided and fused from existing information channels on road traffic in Germany, including induction loops and floating-car data (FCD). Furthermore, terrestrial traffic information can be derived from automatic video analysis of traffic cameras and from mobile and stationary devices based on GPS- and Bluetooth technology (Gurczik et al., 2014; Schaefer et al., 2012).
Figure 1. RT monitoring system of VABENE++
Pre-processed aerial imagery, extracted traffic information and information collected from ground based in-situ sensors are centrally stored and further processed at a mobile ground station (MGS). It is the central place where data aggregation, visualisation as well as product generation and dissemination take place. This study particularly focusses on the downstream components of the described workflow, i.e., after aerial imagery has been transmitted to and received at the MGS.
1.2 Application scenarios
One application of the VABENE++ system was conducted on April 2015, during a civil protection exercise of the German Red Cross (GRC) - here as represented by its largest regional association, the Bavarian Red Cross (BRC) - and cooperating humanitarian non-governmental organisations as well as fire services of Germany. Around 300 participants, including trainees, support staff, observers and press) took part in this exercise. In this exercise the immediate treatment of injuries as a consequence of an indoor collapse of a tribune and a simultaneous accident with hazardous contaminants was trained under realistic conditions. Overall training goals included to test and train readiness for action of participating subunits in general (including rescue service teams, medical services, emergency doctors and operation controllers) as well as to evaluate and optimize their teamwork, e.g. for operating and managing treatment areas. VABENE++ was involved in this exercise in order to demonstrate new monitoring solutions on
traffic management, to examine the use of terrestrial and airborne monitoring contributing to situational awareness and to evaluate possible future contributions in case of large scale public events (e.g. G7 summit) and natural disasters. All derived information was directly disseminated to the exercise coordination at the operation’s control room and was used by the user in advance, during and in the aftermath of the exercise. Another application represents a real case scenario - a large open-air music festival in central Europe with more than 70,000 visitors. VABENE++ cooperates with the festival organiser and a service company for traffic management and logistics commissioned by the festival organiser. It was the first involvement of VABENE++ during a large open-air festival, where close end user interactions took place. In this first pilot study main contributions of VABENE++ included the RT provision of traffic information from terrestrial in-situ sensors but also the non RT demonstration of airborne-based traffic monitoring and situational assessments that might be of interest of future cooperation. All derived information was disseminated and visualised inside a central control room. A user workshop in the aftermath was conducted to discuss main findings and future perspectives of this cooperation.
2. AIRBORNE SITUATIONAL AWARENESS
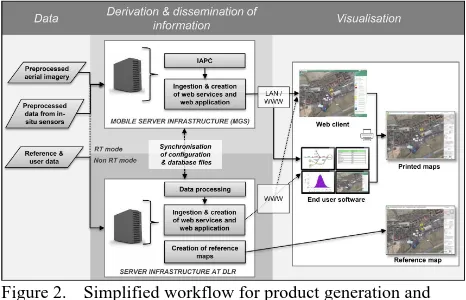
Figure 2 shows a simplified workflow how aerial imagery in combination with other datasets is used to contribute to situational awareness. Two workflows can be distinguished, the one that takes place on mobile server infrastructure (in the MGS) - and thus is directly linked to the RT monitoring system of VABENE++ (Figure 1) and secondly another one that is based on central servers hosted at the DLR.
The RT workflow is used if aerial imagery is directly received in at the MGS allowing product creation and dissemination within a few minutes. It mainly consists of a) an automatic image analysis processing chain (IAPC) based on received and preprocessed aerial imagery (section 2.1) and b) several steps required for the generation and dissemination of web services based on received aerial imagery, results from IAPC, as well as reference information and data provided by end users (section 2.2). Web services in different conventional standards can either be disseminated via Internet or local area network (LAN) in the field in order to be consumed by a wide range of web-clients. As our experiences with user showed that direct consumption and integration of web services in a special end user software (at a control room) is at the current time the exceptional case, an own web application is provided on mobile server infrastructure (section 2.2). Hence, visualisation of information is archived through an interactive web application as well as high quality map products, whose creation is triggered through a new developed client-embedded print service solution (section 2.2.3). In addition to Römer et al. (2014) the workflow runs fully autarkic in the field without requiring regular data synchronisations with stationary server infrastructure at the DLR and was demonstrated for the first time during the civil protection exercise with the BRC in 2015. Nearly the same processes as described for the mobile workflow solution can be conducted on central servers at the DLR. Especially in the preparatory phase of a planned application, processing of data provided by end users is often mandatory in order to generate and disseminate them as web services. Furthermore, configuration files of web application as well as database files need to be synchronised and updated in advance, respectively after each campaign.
If required, reference maps can also be provided in advance of a monitoring campaign based on a classic interactive map production process as described in (Voigt et al., 2007).
Figure 2. Simplified workflow for product generation and dissemination
2.1 Image analysis processing chain (IAPC)
A main scope of image analysis is the spatial analysis of open spaces including parking and assembly areas used by the field staff of end user organisations, in order to provide RT information on parking occupancy, estimations of number of visitors as well as the local availability of resources of rescue forces. The methodology is in principle based on a pixel-based Gaussian maximum likelihood (ML) classification for the discrimination of occupied and free areas (Duda and Hart, 1973; Kersten et al., 2014). The methodology is implemented using Interactive Data Language (IDL) which is a script programming language, and runs on a conventional office notebook (Windows 7 32-bit, 8.00 GB RAM and CPU of 2.20 GHz single core). Due to the availability of a large amount of training data collected on different flight campaigns, robust classification models have been developed in order to directly apply them during field experiments. Thus, time-consuming interactive model training carried out at the beginning of each flight campaign is not a mandatory step anymore (Römer et al., 2014). Furthermore, the IAPC is now applicable for aerial imagery collected with the plane-based 3K and the helicopter-based 4k-camera system. The output of the classification process is a database file containing estimated percentage values of occupied space for each assembly area.
2.2 Web service creation and dissemination
In order to provide a high level of flexibility, to reduce dependencies from proprietary data exchange formats and protocols, as well as to facilitate participation in open or local spatial data infrastructures (SDIs), well documented open standards and specifications such as Web Map Service (OGC, 2006) or ESRI REST (ESRI, 2010) are applied for the web-based dissemination of spatial information. Software components for data ingestion and provision of web services are currently based on ArcGIS for Server 10.3.1, ArcPython (Python 2.7.8) extended by ESRI specific modules, (cp. Zandbergen, 2012) and Microsoft’s webserver Internet Information Service (IIS). For RT use case these components are encapsulated in a virtual machine (VM), with Windows Server 2008 as operating system and which is deployed on the virtualisation environment in the MGS.
2.2.1 Viewing services: Different data types and information resources are used in the VABENE++ system. Most end user requests concern the visualisation and query of these information layers. This section describes characteristics of different types and processes of web service generation. Aerial imagery is received at the MGS as orthorectified image triplets which were acquired by three cameras of the 3K, respectively 4k-camera system. Usually there are hundreds of these image triplets being generated during a flight campaign. In order to allow a RT image visualisation, a stepwise process (instead of a mosaic process of complete coverages) has been implemented. Tiled web maps can be considered as a very common and performant option for web service based dissemination of large amounts of raster data. The implemented automatic process derives such web tiles as soon as new image triplets are available. Tiling scheme and zoom levels are compliant to the map tile conventions used by OpenStreetMap (OSM) tile server, google maps and many other providers as well as to the Tile Map Service specification (TMS) of the Open Source Geospatial Foundation (OSGEO, 2012), while taking differences in numbering conventions between these two service types into account. Due to the demanding requirement for RT processing, no colour balancing is applied during the stepwise mosaicking and tiling process. A drawback of this approach is that smaller inconsistencies in the time stamps of processed image tiles between different zoom levels could occur. This happens particularly in cases of aerial image collection at slow flight velocities, when new incoming images are included in an existing tiling process that has not yet been finished for all zoom levels.
RT information layers as derived from aerial imagery (i.e., results from IAPC), as well as from ground-based in-situ sensors (e.g., analyses of terrestrial video cameras) are provided as ESRI REST and WMS services. These analyses results are imported as distinct Feature Classes in an ESRI File-Geodatabase using an ingestion process which is implemented in ArcPy (cp. Römer et al., 2014). This process can be triggered in arbitrary intervals, e.g., two minutes, and comprises the screening and harvesting of a MGS exchange server and the ingestion of files containing analysis results as attribute information in a File Geodatabase. The latter step includes joining of attributes to corresponding geometries as well as updating valid time interval attributes.
Thus, this workflow allows for the provision of the most recent occupancy information on each assembly or parking area as ESRI REST and WMS services.
Reference data, such as road networks, land use and points of interest provide geographical context information and are crucial components of integrated common operational pictures. There are free available data sources as well as information layers, provided by governmental agencies, which are provided using tiled web services (such as simple tiled web maps, WMTS, TMS or tiled ESRI REST services) for base maps and overlay layers. Additionally, end users usually provide specific data for a distinct use case and field campaign (e.g. assembly or parking areas). Due to the heterogeneity of these input data sets, more or less time consuming preprocessing procedures have to be conducted in the preparation phase of a field campaign.
2.2.2 Web application: Testing and demonstrating web service capabilities require a client application. Furthermore, due to legal or technical constraints, end user software systems are often not available for these tasks. Thus a web based client application was developed which is based on ESRI’s ArcGIS API for JavaScript, version 3.12.
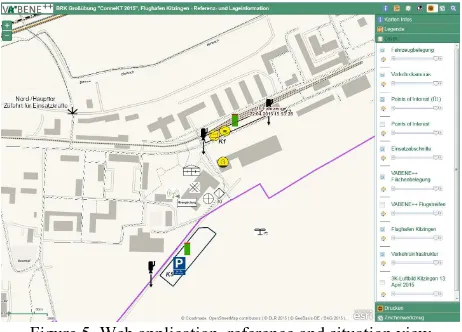
This application can easily be configured by configuration files as well as by web-based configuration wizards allowing access to several web service standards, such as WMS, ESRI REST, tiled web map and WMTS. Configuration comprises a) the definition of a web map which is a compilation of one or more different viewing web services and b) the definition of the application layout and exposed widgets. The latter include tools providing user interaction such as zooming, panning, layer displaying, measuring or drawing. An example for a configured web application is displayed in Figure 5 (section 3.1.2).
2.2.3 Print service: In most cases the web application fulfils end users requirements for the visualisation of current information. However, problems could occur if end users, e.g., mobile relief workers, are not connected with internet or LAN during field operations. This use case can be supported though the provision of print services which can be consumed by clients, e.g., in a mobile operation’s control room that is connected with the local MGS network or the internet. Thus, in comparison to a rapid mapping workflow, e.g. as provided by the Copernicus Emergency Management, this print service brings the process of map production directly to the user and to the incident location, allowing the generation of high-quality and high-resolution map products with user defined extent, scale and thematic focus (EC, 2015). The print service is implemented as a geoprocessing service compliant to the ESRI REST (ESRI, 2010) specification in ArcGIS for Server and is based on map templates. Custom functionality allows for an automatic configuration of a map product including positioning and arrangement of map frame elements such as legend, grids and map marginalia. The print service can be triggered by an end user with a distinct print widget that is implemented in the web application (section 2.2.2). Figure 3 shows a sequence diagram describing the map generation workflow.
Figure 3. Sequence diagram for map product generation
The web application requests the print service via the REST interface and provides a web map definition containing information such as currently visible web services, map extent and zoom level. This definition is applied to the selected map template. The content of the respective viewing services is added to the map template’s main map frame. Depending on the map content as well as complexity and size of the map template, the runtime is variable; hence an asynchronous method call is used for this processing service. The service immediately returns a unified resource locator URL containing the current status of the processing service. Through constant polling of this URL, the web application checks, if and where the processing results are available. At the current time being, results of the processing service are provided as Adobe Portable Document Format (PDF) files.
3. RESULTS
This section describes how airborne-based situational awareness has been achieved during the two application examples with BRC and during the open-air festival. The role of user feedback in influencing scope of further developments and methodologies is discussed in section 4.
3.1 Exercise with the BRC
3.1.1 Exercise preparation phase: Due to the spacious area and significant constructional changes that have been taken place at the former airfield, there was a user demand in getting an up-to-date overview on the location in advance of the exercise. Thus, aerial imagery with a ground sampling distance (GSD) of 20cm was collected two weeks before the exercise using the 3K camera system mounted on the research aircraft Cessna 208B Grand Caravan. In addition, the BRC provided us with exercise specific tactical as well as general logistic information including planned onsite spots for injury treatment, assembly-, accident- and decontamination areas, as well as access routes for approaching rescue forces and information on host nation support (e.g. catering and parking spaces). Further reference information included road network acquired from the Federal Agency for Cartography and Geodesy of Germany and boundaries of the airfield which was derived through visual interpretation of aerial imagery. During the preparation phase, tactical and reference information as well as aerial imagery were processed and disseminated as web services (using the server infrastructure at DLR) and finally visualised using a web application. Based on the thematic content, two different compilations of web services were configured for the web application: a) aerial imagery view containing the most recent aerial imagery, tactical and reference information and b) reference and situation view containing all analysis results, tactical and reference information as well as an unobtrusive greyscale basemap based on OSM data.
Furthermore, as there was a greater user demand for high quality reference maps in DIN-A1 format for exercise preparation and field support, maps have been provided using the classic interactive map production process (Voigt et al. 2007). However, File Geo Database, web services and configured web application were deployed on the mobile server and further used for the RT field demonstration two weeks later.
3.1.2 On-site situational assessments and visualisation: During the exercise, the MGS was located within the former airport building in close neighbourhood to the mobile operation’s control room of the exercise control (EXCON) team. All results derived by the VABENE++ system were disseminated through LAN and directly shared with EXCON. Regarding data collection, aerial imagery and derived traffic data were acquired using the 3K camera system on the Cessna 208B Grand Caravan on two days during the exercise. Data was directly transmitted using the microwave data link and received through an antenna which was located on top of a former flight tower. From there, data where further distributed to the MGS via LAN. Information derived from in-situ sensors included vehicle counts, which were derived through an automated analysis of images from ground-based web cameras (Suzuki et al., 1985; Zivcovic, 2004). Cameras were installed at access and exit road segments of assembly areas in order to detect emergency vehicles when intersecting a fictive (image frame specific) trip wire. The results of these counts as well as video images were transferred to the MGS by radio link.
Regarding the process steps carried out for airborne-based situational assessments, received pre-processed aerial images were processed and exposed as web-tiled and OSGEO TMS web services using the workflow described in section 2.2.1. IAPC was applied to monitor occupancy for two assembly areas and a parking space reserved for visitors, observers and exercise support teams. All three areas covered an area of app. 13,900 square meters. A pixel-based accuracy assessment based on manually extracted vehicle polygons was conducted for the most frequented assembly area and for three individual time steps T1 – T3 (Table 1). Overall classification accuracy indicates very good classification results with 93.91% considering all three time steps together. A moderately high kappa value of 0.70 (for T1 – T3) is a result of relatively poor classification performances, i.e. user- and producer accuracies, for the class occupied. This applies particularly in the case that percentage reference occupancy approaches zero, leading to a low signal-to-noise-ratio for this class (see T3 on Table 1). In general, only slight deviations (–3.26% - +1.24%) regarding the aggregated percentage occupancy values did occur.
Time step
Occupancy (%) Users- / producers accuracy (%) for classes
Ref.1 IAPC Dev.2 ‘Free’ ‘Occupied’
T1 T2 T3
T1-3 25.33
7.96 2.48
11.93 22.08
9.20 1.97
11.09 –3.26 +1.24 –0.51
–0.84
90.67 / 94.64 98.81 / 97.48 97.90 / 98.41
96.10 / 97.02
81.91 / 71.38 74.79 / 86.43 21.24 / 16.88
76.34 / 70.95 1 Percentage reference occupancy; 2 Deviation of occupancy (%)
Table 1. Classification and accuracy results as represented for an assembly area at three time steps
Figure 4 shows the classification results for one assembly area observed at the time step T1. The free space around the emergency vehicles is precisely masked out from the background aerial image (Figure 4 c). For the estimation of percentage occupancy of an entire area, an empirically derived capacity factor is used in order to consider that not all of the available space can actually be used for parking (Römer et al., 2014).
Figure 4. (a) Assembly area, (b) Probability map for class free, (c) classification map for class free (occupancy here is 37%).
The results of the traffic camera image analysis as well as the IAPC derived occupancy information for the assembly areas were processed and disseminated as web services using the workflow described in section 2.2.1.
A web application was used to visualise aerial imagery, vehicle count data, results from IAPC as well as tactical and reference information. A scale dependent visualisation concept allows a user-friendly intuitive access of all derived information. This means for example that most of the tactical information, which is represented by point symbols, is only displayed if the map scale exceeds a certain value. Experiences from the exercise show that aerial imagery as well as results of IAPC could be visualised in the prepared web-client within five to ten minutes after data acquisition. Figure 5 shows the reference and situation view of the configured web application for April 22, 2015, 15:53:28. Tactical signs, camera locations, bar charts representing derived occupancy information for assembly and parking areas and vehicle count data are visualised.
Figure 5. Web application, reference and situation view
In addition to the web-based visualisation, users were also enabled to generate and print their own map products using the print service prototype, which was first demonstrated in October 2014 (Gstaiger et al., 2015) and described in section 2.2.3.
Experiences from the field campaigns show that high quality digital map products were available in about 25 -30 minutes after image data acquisition. Figure 6 shows a map product example, based on the reference and situation view of the web application. Besides the described context, fixed elements, i.e. information text and logos, as well as automatically generated elements such as legend, overview map, map grid and data source information is visualised.
Figure 6. Automatically generated map product example
3.2 Situational awareness during an open-air festival
3.2.1 Preparatory steps: In advance of the festival, web services and web application were prepared at stationary servers at DLR. The festival organiser provided us with event-specific information such as an alarm plan, general and rescue logistics, critical infrastructures as well as an event-specific orientation grid. This information was georeferenced, processed and ingested into feature classes in the File Geo Database. Due to the requirement in this campaign to expose web services and web application to the internet and in order to comply with the organiser’s wish for the confidential treatment of the sensitive data provided and used during this collaboration, web services as well as web application were password protected. Web services were secured using the ArcGIS for Server embedded token-based authentication system, as implemented in ArcGIS JavaScript API based on the OAuth2 (Open Authorization) specification (IETF, 2012).
In addition archive aerial imagery from 2012, which was acquired from the Federal Agency for Cartography and Geodesy of Germany, was used as reference information. All event-specific information layers and archive imagery were disseminated as password protected ESRI Rest web services. Further reference information, such as road map overlays and a greyscale OSM base map, was consumed as tiled web services.
3.2.2 On-site situational assessments and visualisation: Aerial imagery was collected on three days during and in the beginning of the festival using the 4k camera system on DLR’s research helicopter BO 105 (Gstaiger et al., 2015). A flight attitude of 1000 meters above sea level was applied in order to minimize potential disturbances resulting from noise and visual perceptions of visitors. As it was a first cooperation with the festival organiser and the commissioned service company, a full RT demonstration of airborne monitoring and situational assessment was not within the scope of this pilot campaign. This means that aerial imagery was not directly received at a MGS and thus, had to be manually distributed to stationary servers at DLR in the evening after each flight. As there was a requirement or colour balanced and well-designed image mosaics, extensive post-processing were conducted on stationary servers at DLR, including mosaicking of single pre-processed aerial images. Based on the image mosaics, secured ESRI REST services for three separate days were published. This alternative workflow allowed the visualisation of aerial imagery in the web application, each the next day of data acquisition.
Due to the possibility to demonstrate and share the web application in a traffic control centre and due to intensive user interactions during and after this event, there have been obtained several new findings regarding the usability of airborne-based situational assessment during open air festivals (section 4).
4. DISCUSSION
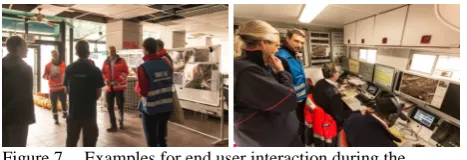
In spite of the fact that the two presented application examples differed significantly in their thematic scope, experimental settings and users involved, a common element in both examples was a close end user interaction. The latter was realized during the application, i.e. through direct sharing of derived information respectively products in an operation’s control room and secondly, in the aftermath of the application, i.e. through debriefings and lessons-learnt meetings (Figure 7). This section summarizes and discusses end user feedbacks gained in both applications.
Figure 7. Examples for end user interaction during the experiments: (left) discussions and debriefing, (right) sharing of derived information products at the mobile operation’s control room
4.1 The role of aerial imagery and thematic information extraction for decision support and situational awareness
The importance of aerial imagery to increase situational awareness has been emerged in both demonstration examples. A major application of aerial images is simply to get a detailed spatial understanding of the real-world situation at a certain time. In the case of the BRC exercise, a user requirement was to get an overview on the current location of the airfield, where intensive building activities have been taken place. Thus, aerial imagery was used to support exercise preparations, i.e. to match planning documents (e.g. development and building plans) with current imagery. Additionally, image data was applied to support field orientation and logistics during the exercise. In case of the music festival, aerial imagery has proven to be a valuable source of information to check and adjust existing planning and emergency maps through conducting spatial alignments with provided georeferenced aerial imagery. A substantial value of aerial imagery arises, if it is provided as processed mosaicked and georeferenced information in RT. This issue became evident during the open air festival, particularly regarding the application of imagery in festival site management. The latter includes all operations regarding monitoring and management of festival sites, mainly camping sites and parking spaces, and all related short-term actions and decisions that ensure a smoothly occupancy of sites, especially during the opening and closing phases of the festival. As there are direct implications between traffic and site management, these two tasks are carried out by the traffic management and logistic service company. Although this user group already applied non-georeferenced and non-mosaicked aerial imagery (provided by the festival organiser) for site monitoring purposes, they explicitly emphasized the great potential that would arise, if aerial imagery would be made available in RT, mosaicked and georeferenced. Furthermore, as current occupancy information is primary derived from observations of field staff and from visual interpretation of aerial imagery, an automated occupancy assessment as realized through the IAPC would significantly contribute to site management.
Thus, existing classification methods, which are tailored to the discrimination of open spaces and vehicles, are currently adjusted to be applied for festival site monitoring. Methodological developments regarding image analysis, as well as issues on information aggregation and visualisation are currently developed in close consultation with the user. Figure 8 shows a preliminary and promising classification result for the discrimination of open spaces and areas occupied by vehicles and tents.
Figure 8. (a) Aerial image subset of a festival camping area, (b) classification of tents and vehicles (red)
4.2 Feedbacks on information visualisation and product dissemination
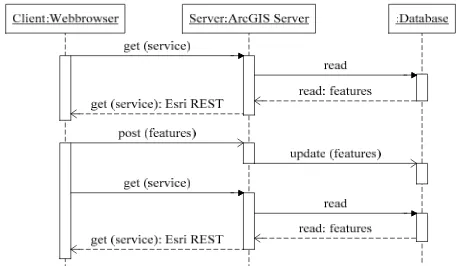
4.2.1 From static to dynamic map products: The value of printed maps, which were provided in addition to web-based visualisation, was considered as important by the user in both application examples. In case of the BRC exercise, reference maps as prepared in DIN A3 and DIN A1 format were found to be useful to increase local situational awareness: although field units were equipped with GPS-based navigation systems, hardcopy maps still played an important role for field orientation. However, end users from the BRC exercise working at a mobile command and control room criticises the static nature of prepared reference maps limiting their use during field operations. Maps used in control rooms are often pinned at a white or magnetic board in order to draw-in new or to delete and change existing positions of tactical signs or text attributes. This issue brought us to the implementation of editable web services allowing client controlled changes of attributes and geometries in a certain information layer (e.g. tactical symbols) with direct implications on an underlying feature class in a database. Editable web services, such as WFS-T (OGC, 2005), are already well specified; additionally the ESRI REST interface provides editing capabilities as well (ESRI, 2010). Nevertheless the implementation task requires some adjustments to the current back-end of the system, especially regarding data storage scheme and the web front-end. Figure 9 shows a simplified sequence diagram with a workflow, which could serve as a basis for a prototypical implementation of editing web services in the VABENE++ system. Here, the client sends initially a get request to a GIS server that read the feature data from a database and then returns it to the client. In case of an editing task, the client posts any changes on the geometry and / or attributes of features in an editable service to the GIS server, which updates the database objects. As soon as the client sends a new get request, the server returns the updated feature.
Furthermore, editing web services could contribute to a dynamic and shared situational assessment increasing the general applicability of both, web applications and client embedded print functionalities. The usefulness of editable web service has also been pointed out by the traffic logistic company, particularly in order to facilitate communication between field staff and control room and to support festival-site management. Possible meaningful applications involve changing status (closed/open) of exiting sites, as well as to establish new parking and camping areas, e.g., if heavy rain affects local site trafficability.
Figure 9. Draft sequence diagram for editing web service
Regarding to the user controlled map generation based on a print service, end users from both experiments emphasized its great value for freezing dynamic situations displayed in a web-browser at a certain time step and to allow a shared common situational awareness. Additionally, end users of the BRC exercise mentioned, that printers in mobile control rooms (that are special equipped emergency vehicles) usually do not offer print formats greater than DIN A4. This issue could easily be addressed by the implementation of further map templates in page formats, which are not yet supported by the system.
4.2.2 Towards an integrated spatial operational picture: Although a general user’s interest for an integrated and spatial operational picture can be ascertained from both experiments, software systems, which are operated by end users are often only of limited value to process geospatial data in general. The latter involves for example the ability of direct consumption of web services as a premise of having access to geographic information from various sources. Thus, end users applied our web application in addition to their own software solutions, which stands a little bit against the idea of an integrated operational picture. However, this application offered a performant and intuitive use of several geospatial information layers provided in both scenarios and was frequently used. In general a lack in geospatial data processing in end user software is not a surprising observation confirming central findings of a survey conducted by (Westlund, 2012) with disaster management practitioners. In this study a general uncertainty regarding geo-spatial technology, respectively regarding the effective implementation of technology in end user working environments could be observed. Thus, an indirect role of the VABENE++ project includes also transferring knowledge on the use and added value of geospatial technologies in civil protection and emergency response.
5. CONCLUSION
This study made clear that only through the combined use of innovative solutions for data collection (as represented by the 3K and 4k camera systems) and automated downstream image analysis and information processing and dissemination steps, remote sensing can significantly contribute to decision making and situational awareness in RT civil protection and emergency response scenarios.
The valuable of end user feedback received from humanitarian relief organisations and the private companies on festival organisation and management underpins a) the great potential of currently developed solutions for RT aerial image collection and pre-processing (3K and 4k camera systems), information extraction (IAPC) and information dissemination (e.g., web service oriented information sharing, print on demand function) and b) the great importance of user involvements in aligning research to user requirements by providing impetus on further developments. The latter include particularly airborne-based solutions in support of festival site management as well as to increasingly consider the end user as a direct source of spatial information within a shared operational picture.
However, aiming a successful implementation of tools in end user organisations implies overcoming organisational (e.g., data quality, data sharing), economic (costs benefit analysis), cultural (legal and security concerns) and hardware and software challenges. This is a long-term process requiring further user-centred research approaches as proposed in this study.
ACKNOWLEDGEMENTS
We would like to acknowledge the whole project team of the DLR research project VABENE++ as well as to thank the BRC and the festival organiser for this close, effective and interdisciplinary collaboration.
REFERENCES
Angermann, M., Frassl, M., Lichtenstern, M., Gullotta, G., 2012. „Perspektivenwechsel“ - Luftgestützte Sensorik im Einsatz für den Bevölkerungsschutz. Bevölkerungsschutz, 2012 (1), pp. 26-31.
Duda, R.O., Hart, P.E., 1973. Pattern classification and scene analysis. Willey, New York.
ESRI, 2010. GeoServices REST Specification version 1.0. An ESRI White Paper, Redlands, USA. http://www.esri.com/~/media/Files/Pdfs/library/whitepapers/pdf s/geoservices-rest-spec.pdf (19 Nov. 2015).
European Commision (EC) 2015. Copernicus Emergency Management Service – Mapping, Brussels, Belgium,
http://emergency.copernicus.eu/mapping/ems/emergency-management-service-mapping (11 Nov. 2015).
Gurczik, G., Tcheumadjeu, L.C.T., Luber, A., Ruppe, S., Junghans, M., 2014. Floating observer information processing on the basis of mobile bluetooth data. International Conference on Engineering and Applied Sciences Optimization (OPT-i), 04.-06. June 2014, Kos, Greece, 11p.
Internet Engineering Task Force (IETF), 2012. The OAuth 2.0 Authorization Framework. http://tools.ietf.org/html/rfc6749 (20 Nov. 2015).
Kersten, J., 2014. Simultaneous feature selection and Gaussian mixture model estimation for supervised classification problems. Pattern Recognition, 47, pp. 2582-2595.
Kujala, S., 2003. User involvement: a review of the benefits and challenges. Behaviour & Information Technology, 22(1), Taylor and Francis, pp. 1-16.
Kurz, F., Rosenbaum, D., Leitloff, J., Meynberg, O., Reinartz, P., 2011. Real time camera system for disaster and traffic monitoring. Int'l Conf. Sens. Mod. Photogram. Rem. Sens., Teheran, 7p.
Kurz, F., Rosenbaum, D., Meynberg, O., Mattyus, G., 2014. Real-time mapping from a helicopter with a new optical sensor system. Gemeinsame Tagung 2014 der DGfK, der DGPF, der GfGI und des GiN (DGPF 23/2014), Hamburg, Germany.
National Research Council of the National Academies (NRC), 2003. Using Remote Sensing in State and Local Government Information for Management and Decision Making. The National Academic Press, Washington, D.C., p. 112.
Open Geospatial Consortium Inc. (OGC), 2005. Web Feature Service Implementation Specification. OGC 04-094, version 1.1.0 http://portal.opengeospatial.org/files/?artifact_id=8339 (10 Nov. 2015).
Open Geospatial Consortium Inc., (OGC) 2006. OpenGIS® Web Map Server Implementation Specification. OGC 06-042,
version 1.3 http://portal.opengeospatial.org/files/?artifact_id=14416 (10
Nov. 2015).
Open Source Geospatial Foundation, 2012. Tile Map Service Specification, version 1.0 http://wiki.osgeo.org/wiki/ Tile_Map_Service_Specification (10 Nov. 2015).
Römer, H., Kersten, J., Kiefl, R., Plattner, S., Mager, A., Voigt, S., 2014. Airborne near-real-time monitoring of assembly and parking areas in case of large-scale public events and natural disasters. International Journal of Geographical Information Science, 28(4), pp. 682-699.
Schaefer, R.-P., Thiessenhusen, K.-U., Wagner, P., 2002. A traffic information system by means of real-time floating-car data. Proceedings of ITS world congress 2002, Chicago, IL.
Suzuki, S., Abe, K., 1985. Topological Structural Analysis of Digitized Binary Images by Border Following. CVGIP, 30 1, pp. 32-46.
Voigt, S., Kemper, T., Riedlinger, T., Kiefl, R., Scholte, K., Mehl, H., 2007. Satellite image analysis for disaster and crisis-management support. IEEE Transactions on Geoscience and Remote Sensing, 45 (6), pp. 1520-1528.
U.S. Department of Homeland Security (DHS), 2014. Using social media for enhanced situational awareness and decision support http://www.firstresponder.gov/Pages/Social-Media-Study.aspx (03 Nov. 2015).
Westlund, S., 2012. The use of Geospatial Technology in Disaster Management. International Journal of Applied Geospatial Research, 1(3), pp. 17-30
Zandbergen, P.A., 2012. Python Scripting for ArcGIS. Esri Press, Redlands, California, p. 368.
Zivkovic, Z., 2004. Improved Adaptive Gaussian Mixture Model for Background Subtraction. Proceedings of the 17th International Conference on Pattern Recognition, 23-26 Aug 2004, p. 4.
Revised XYXY XYXY